Image #4: Large-Scale Oil Palm Causes Deforestation of Primary Forest in the Peruvian Amazon (Part 1: Nueva Requena)

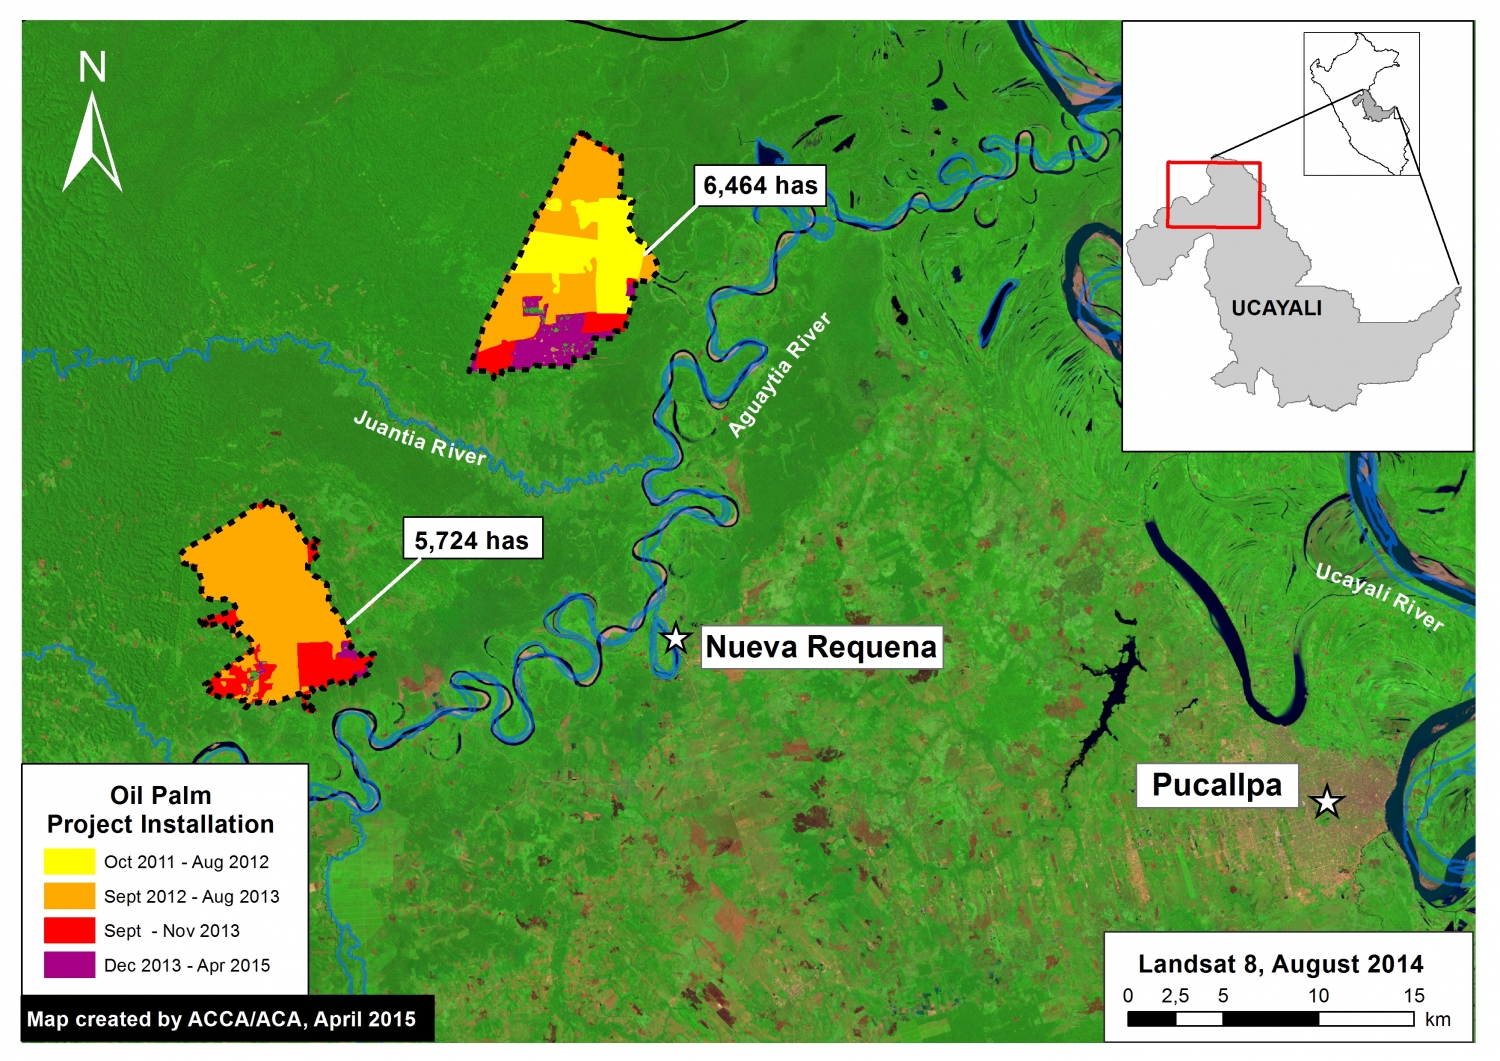
Image of the Week #4 shows the expansion of two large-scale oil palm projects near the town of Nueva Requena in the central Peruvian Amazon (Department of Ucayali). These projects began in late 2011 and, as of April 2015, now cover nearly 12,200 hectares (ha). Our analysis reveals that, of this total area, 9,400 ha came at the expense of primary forest and 2,350 ha from secondary forest.
NR_MAAP_4d_v5
Image of the Week 4a. Two large-scale oil palm projects near Nueva Requena in the central Peruvian Amazon (Department of Ucayali) began in late 2011 and now cover nearly 12,200 ha. Key data sources: USGS.

Map Description

Background map is a Landsat 8 satellite image (30 meter resolution) from August 2014. Dark green indicates forest cover. Light green indicates younger or secondary vegetation. Blue indicates water bodies. Data is from USGS.

The dashed black lines indicate the outline of the two large-scale oil palm projects, one of which is known to be “Plantaciones de Ucayali”, as of April 2015.

The colors indicate how the deforestation and plantation installation unfolded over time for the two projects according to our analysis of Landsat imagery.

Between October 2011 and August 2012, large scale-clearing and installation (indicated in yellow) started in the northern project.

Between September 2012 and August 2013, large-scale clearing and installation (indicated in orange) continued in the northern project and began in the southern project.

Between September and November 2013, clearing and installation (indicated in red) continued in the southern portion of both projects.

Most recently, between December 2013 and April 2015, clearing and installation (indicated in purple) continued in the southern portion of the northern project.

As of April 2015, the two projects cover an area of 12,188 ha.

Landsat Time-series 2010 – 2015
NR_MAAP_4g_v2
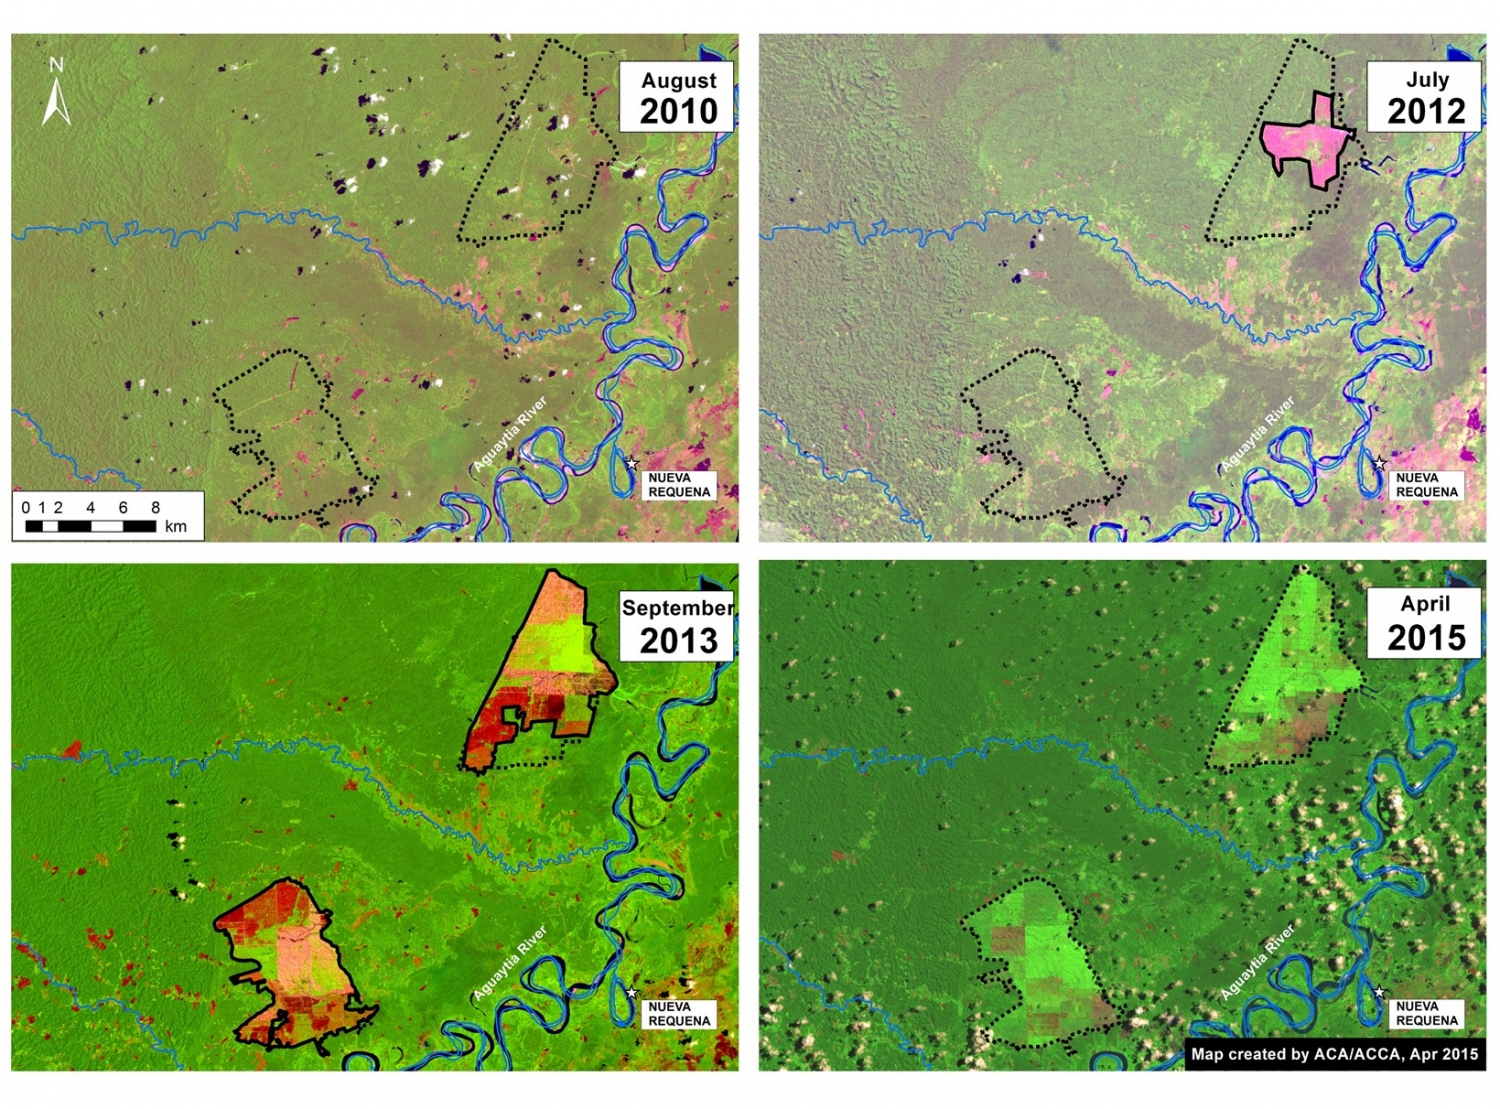
Image 4b. Landsat time-series (2010 – 2015) for both large-scale oil palm projects near Nueva Requena. Key data sources: USGS.

Image 4b is a series of Landsat images showing the change over time for both oil palm projects. In these images, dark green indicates forest cover, light green indicates secondary vegetation and oil palm plantations, pink indicates exposed ground (and is therefore a key indicator of recent deforestation), and the scattered white and black spots indicate clouds and their shade.

The first image, Landsat 5 from August 2010, shows the eventual project area (indicated by dashed black lines) immediately prior to the start of the project in 2011.

The second image, Landsat 7 from July 2012, shows the start of large-scale clearing in the northern portion of the project area.

The third image, Landsat 8 from September 2013, shows the clearing quickly expanded in both projects. It also shows the start of the oil palm plantation planting in the northern project (indicated by bright green).

The fourth image, Landsat 8 from April 2015, is the latest cloud-free image for the project area. It shows the continued expansion of the northern project and the extensive oil palm plantation plantings in both projects.

Landsat Time-series 1990 – 2015
NR_MAAP_4e_v5
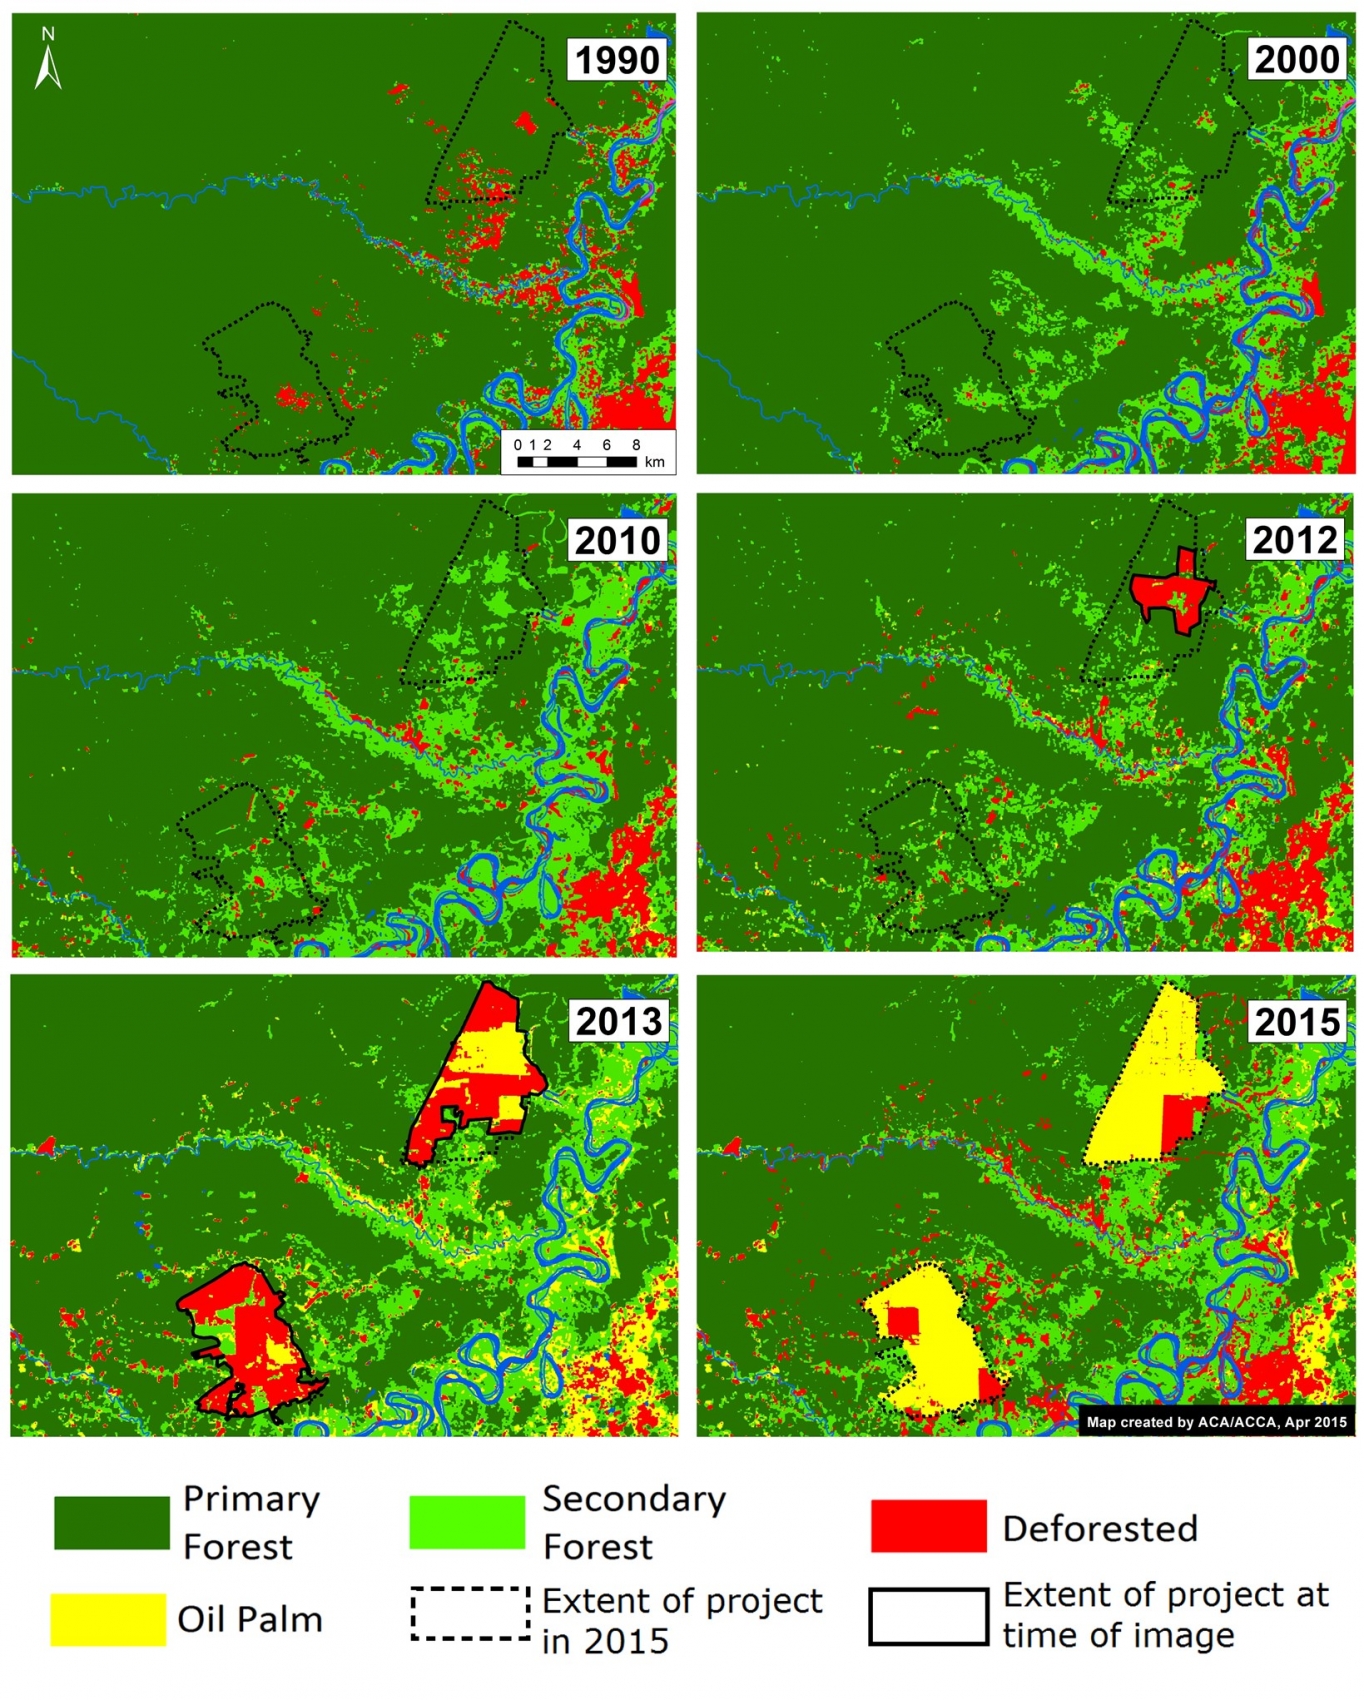
Image 4c. Landsat time-series (1990 – 2015) for both large-scale oil palm projects near Nueva Requena. Key data sources: USGS.

We conducted another Landsat time-series analysis, but going back further in time (to 1990) in order to better understand the state of the forests cleared for the oil palm project. For each image, we determined whether an area was primary forest, secondary forest, deforested, or oil palm. Image 4c illustrates the results of this analysis.

It is important to note that in 2010, just prior to the large scale clearing, the two project areas were mostly a mix of primary and secondary forest.


Deforestation of Primary Forest

NR_MAAP_4f_v4
Image 4d. Classification of land use prior to oil palm activities. Key data sources: USGS.

Finally, we used the results from the Landsat time-series analysis to conduct a classification of land use prior to oil palm activities.

We determined that, of the 12,188 ha of the two oil palm projects, 9,404 ha (77%) was primary forest immediately prior to project installation. That is the equivalent to nearly 7,000 soccer fields. An additional 2,350 ha (19 %) was secondary forest. Only 434 ha (4 %) was already deforested at the start of the project.

We defined primary forest as an area that from the earliest available Landsat, in this case 1990, was characterized by dense closed canopy forest cover.


This work builds off of the following publication: Environmental Investigation Agency. Deforestation by Definition. 2015. Washington, DC. http://eia-global.org/news-media/deforestation-by-definition

Citation

Finer M, Novoa S (2015) Large-Scale Oil Palm Causes Deforestation of Primary Forest in the Peruvian Amazon (Part 1: Nueva Requena). MAAP: Image #4. Link: https://www.maaproject.org/2015/04/image-4-oil-palm-projects-cause-deforestation-of-primary-forest-in-the-peruvian-amazon-part-1-nueva-requena/
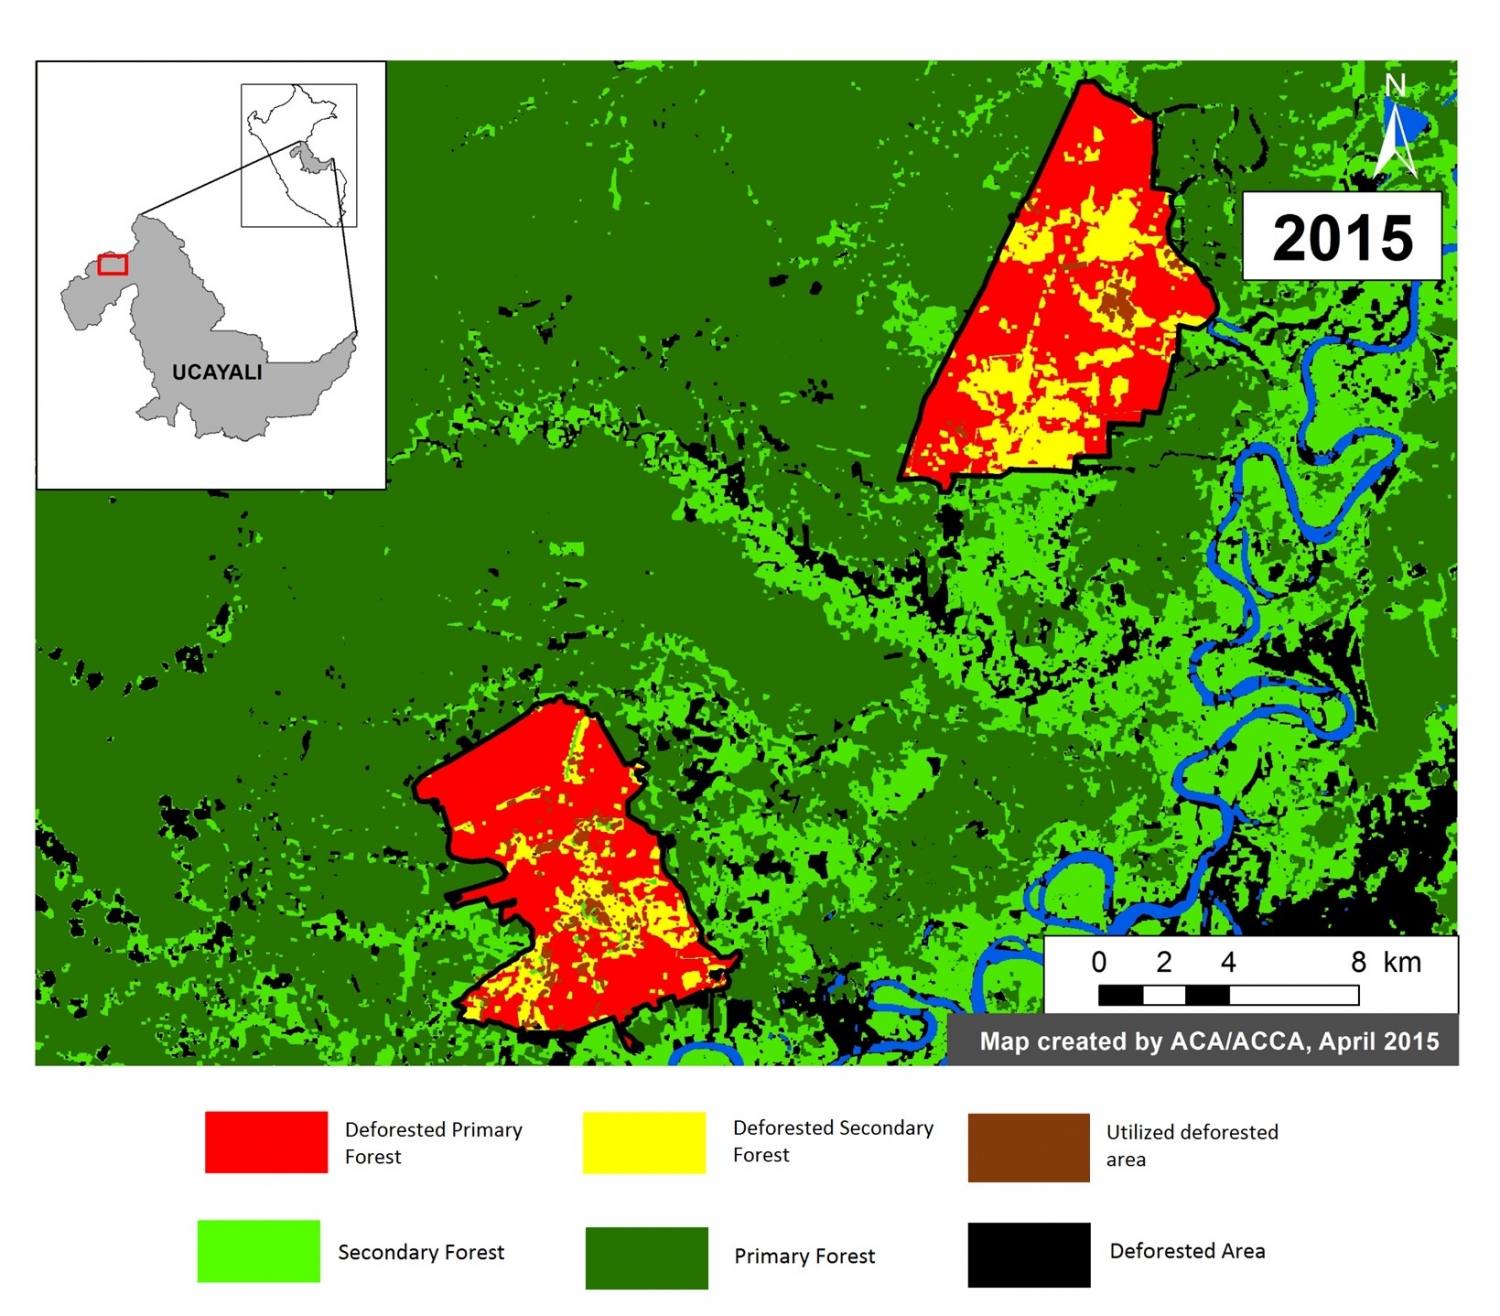
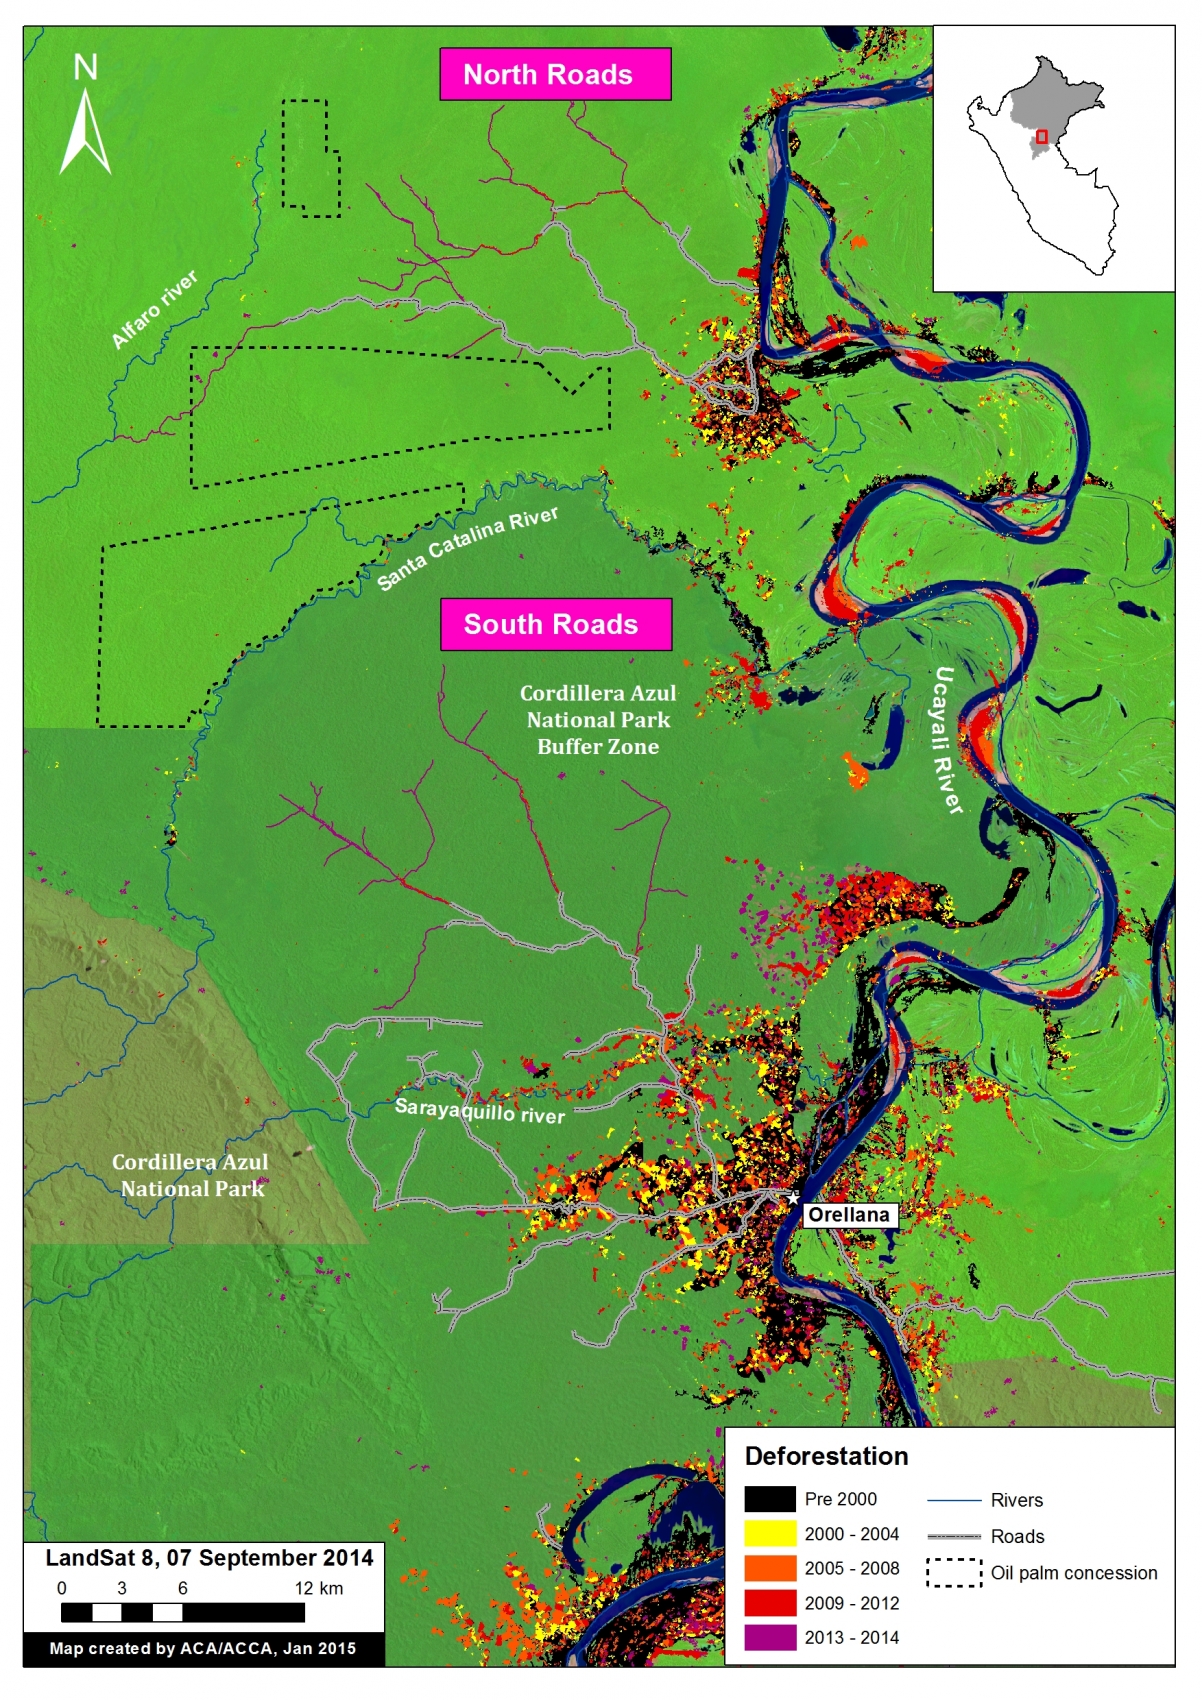
Image #3: Detection of New (Logging?) Roads in the Peruvian Amazon

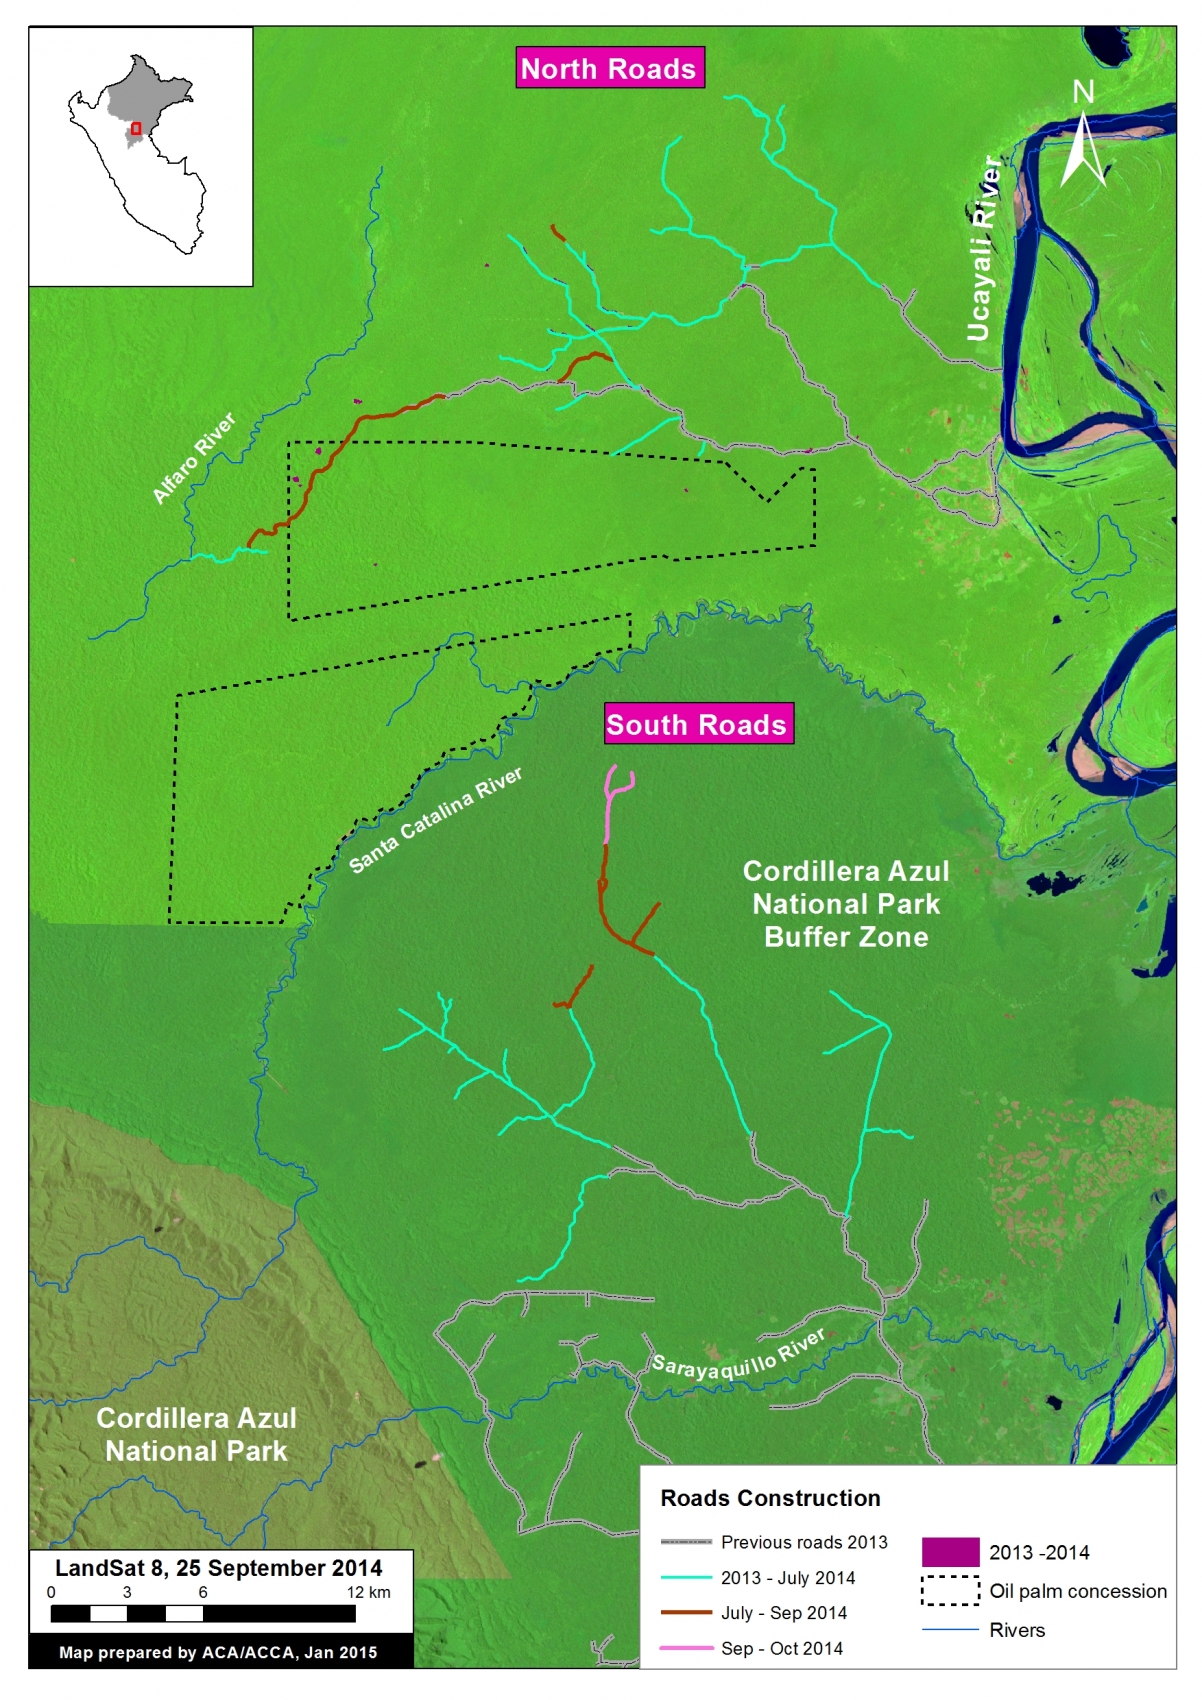
Image of the Week #3 shows the rapid proliferation of two new road networks in the northern Peruvian Amazon (Department of Loreto). Most notably, it highlights the construction of nearly 150 km of new roads, possibly illegal logging roads, through mostly primary forest between 2013 and 2014. One of the roads is within the buffer zone of the Cordillera Azul National Park.

TierraBlanca_MAAP_3a_v4
Image of the Week 3. Detection of new road construction in the northern Peruvian Amazon (Department of Loreto) Key data sources: MINAM, Hansen/UMD/Google/USGS/NASA, USGS, SERNANP, Grupo Palmas, GOREL.

Map Description

Background map is a Landsat 8 image (30 m resolution) from September 7, 2014. Green indicates forest cover. Our analysis has demonstrated that much of this forest cover is primary forestData is from USGS.

Black indicates areas that were deforested as of 2000 according to data from the Peruvian Environment Ministry. Yellow, orange, and red indicate areas that were deforested from 2000 to 2012 (each color covers a four year period) (Hansen MC et al. 2013 Science 342: 850–53; Data download).

Purple indicates areas that were deforested between 2013 and 2014 based on our analysis of Landsat imagery using CLASlite forest monitoring software. Note the two new road networks, labeled North and South, respectively, to the west of the Ucayali River.

Black dashed lines indicate planned oil palm plantations. We obtained this data from Environmental Impact Studies and the Regional Government of Loreto (GOREL).

Protected areas data is from SERNANP. Note the different shades of green to differentiate the protected area and its respective buffer zone.

TierraBlanca_MAAP_3b_v3
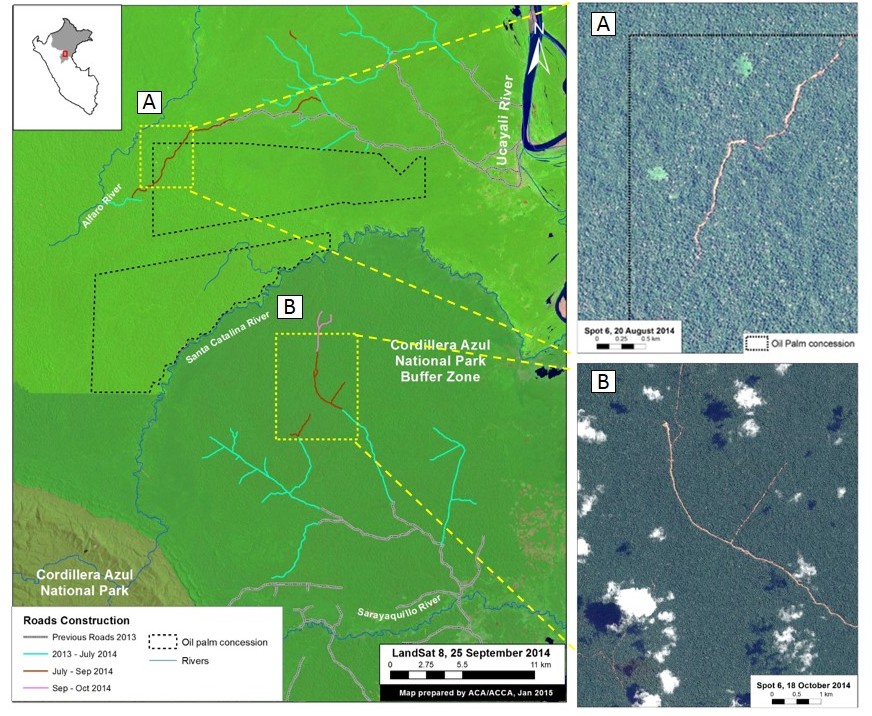
Image 3b. Road construction time-series. Key data sources: USGS, SERNANP, Grupo Palmas.

Construction of New Roads

We color coded the segments of road by construction period: Grey indicates  road segments constructed between 2009 and 2012. Teal indicates road  segments constructed between January 2013 and July 2014 (117.3 km). Dark-orange   indicates road segments constructed between July and September 2014 (25.9  km). Pink indicates road segments constructed between September and October  2014 (4.8 km).

In sum, 148 km of new roads was constructed in this area between January 2013 and  October 2014 (76.24 km in south and 77.38 km in the north).

The southern network is characteristic of a logging road in that it does not have a clear destination and instead just keeps extending and branching deeper into closed-canopy forest.

The northern network is more puzzling in that it crosses a proposed palm oil concession (Grupo Romero’s Tierra Blanca project) and terminates at the Alfaro River. Also note several areas of recent deforestation near the road in the northwest corner of the oil palm concession.


TierraBlanca_MAAP_3c_v3
Image 3c. High resolution SPOT 6 images (1.5 m resolution) of portions of the northern and southern road networks. Key data sources: USGS, SPOT 6.

High-resolution zooms

Panel A is a high resolution SPOT 6 image (1.5 m resolution) from August 2014 of a portion of the northern road network.

Panel B is a high resolution SPOT 6 image (1.5 m resolution) from October 2014 of a portion of the southern road network.


Citation

Finer M, Novoa S (2015) Detection of New (Logging?) Roads in the Peruvian Amazon. MAAP: Image #3. Link: https://www.maaproject.org/2015/04/detection-of-new-road-construction-in-southern-loreto-peru/

Mining News Watch #15

Report #15 // January 28, 2015 – March 17, 2015

Top Stories

  • Antonio Fernández Jeri has been appointed as the new High Commissioner of Mining Formalization and the Interdiction of Illegal Mining.

  • The Amazon Conservation Association issued a new map showing that gold mining-driven deforestation grew by 226.5 hectares between October 2014 and February 2015 in the buffer zone of the Tambopata National Reserve.

  • A new report found that miners from Ecuador are using a series of underground tunnels to smuggle illegal gold from the Amazonas department of Peru.

Deforestation

  • A new analysis conducted by the Amazon Conservation Association (ACA) found that, despite government efforts to crack down on illegal gold mining, mining-driven deforestation in the buffer zone of the Tambopata National Reserve in Madre de Dios grew by 226.5 hectares between October 2014 and February 2015.[1] This deforestation is the equivalent of 310 soccer fields in just four months.

Formalization Process

  • The Presidency of the Council of Ministers (PCM) appointed Antonio Fernández Jeri as the new High Commissioner of Mining Formalization and the Interdiction of Illegal Mining. Fernández is the third person to hold this title, following Augusto Soto Castagnola and Daniel Urresti. He is now responsible for coordinating and overseeing the implementation of the national strategy to combat illegal mining.[2]
  • More than 2,000 informal miners met in Arequipa to demand a more efficient formalization strategy, under the leadership of economist Hernando de Soto of the Institute for Liberty and Democracy (ILD), a think-tank that focuses on helping developing countries modernize their economies. The new “true formalization” process will supposedly be more supportive of miners enrolled in the process and will include a plan to protect and remediate the environment. In contrast to the present formalization process, the plan will also contain different procedures for miners depending on region (coast, mountains, or rainforest). The proposal is set to be completed in 45 days and then sent to the Executive for approval.[3,4]
  • The regional president of Madre de Dios, Luis Otsuka, met with Peruvian President Ollanta Humala to address the issue of mining formalization. Prior to the meeting, the general manager of the regional government of Madre de Dios declared the process a “failure” in need of “integral revision.”[5] Otsuka reported that the first meeting with Humala yielded positive results in that the two leaders definitively agreed that the formalization process must be amended in order for “real” formalization to occur.[6] More concrete changes will likely develop out of further meetings, during which Otsuka hinted that the two will discuss amending Supreme Decree 016-2014, a controversial law regulating fuel supply, which Otsuka says negatively affects the region’s economy.[7]
  • To date, only eight mining companies have successfully completed the formalization process in Peru, all in the department of Puno. Around 70,000 miners initially registered for formalization.[8] Still, no informal miners have been formalized in Madre de Dios.
  • The Public Defender (Defensoría del Pueblo) analyzed the efficacy of the government’s strategies to eliminate illegal mining, including formalization and remediation of the environment. It found that the most significant difficulties were minimal budget dedicated to formalization, lack of qualified leaders and personnel, inadequate planning, and insufficient supervision.[9]

Illegal Gold Smuggling

  • A report aired on Peruvian news program Panorama showing that illegal miners from Ecuador are extracting gold from Peruvian territory in the Amazonas department through a series of 150 underground tunnels which are up to two kilometers long. The tunnels are used both to extract gold and to transport it illegally, and are used by both Peruvian and Ecuadorian miners.[10] The government plans to intervene in the area through raids on illegal mining operations and inspections of key checkpoints in the area.[11,12]
  • The President of the Central Reserve Bank of Peru denounced Bolivia for exporting US$1 billion more in gold in 2014 than the country has the capacity to produce. Analysts suspect that the gold was sourced illegally from Peru and then smuggled over the border due to inadequate customs control.[13]

Mercury Regulation

  • A new peer-reviewed study by the Royal Society of Chemistry found that mercury pollution from illegal mining sites moves rapidly downstream and can impact communities as least 560 kilometers (350 miles) away. According to the study, communities along the Madre de Dios River and its tributaries are at risk and should avoid regular consumption of carnivorous fish.[14,15]
  • The Alliance for Responsible Mining (ARM) has developed a new “fairmined” mining standard in an effort to promote sustainable mining. Currently, the AURELSA mine in Madre de Dios is one of the only companies in Peru to achieve the fairmined standard. To get the fairmined certification, a mining company must reduce their mercury emissions by 60 to 90 percent, ensure that chemical waste is disposed of safely, and guarantee worker’s rights. Buyers of fairmined gold pay a premium of ten percent which is then reinvested in the company and the interests of the local community.[16]

Other

  • Inspectors from the National Customs and Tax Administration (Sunat) seized 2,507 gallons of diesel fuel that was being transported along the Inambari River in Madre de Dios without the required documentation, destined for illegal mining operations.[17] A second seizure occurred a few weeks later, coordinated by the regional police and Sunat, during which 1,800 gallons of fuel were confiscated along the Madre de Dios River.[18] Sunat says it has increased its operational actions along the rivers and tributaries in the region.
  • The Magistrate Control Office (OCMA) found that the chief judge and president of the Court of Madre de Dios, John Russel Hurtado Centeno, was running an illegal mining camp called “Guadalupe” while simultaneously serving in the court system. He has been suspended indefinitely from his position while investigations continue.[19]
  • The Peruvian government found that gold production in the country fell by 6.7% in 2014 relative to 2013, yet Peru is still the sixth largest gold producer globally. The decrease is likely due to lower production in the largest mine in the country, Yanacocha.[20] Additionally, it is estimated that gold production in Madre de Dios will fall by 20% in 2015, largely due to the government’s offensive on illegal mining in the region.[21]

Notes: The ACA Mining News Watch focuses mostly on issues pertaining to the Peruvian Amazon and may not cover issues related to non-Amazonian parts of the country. We would like to credit ProNaturaleza’s “Observatorio Amazonia” as our primary resource for articles related to illegal mining in Peru.

Featured image credit: Gobierno Regional de Madre de Dios GOREMAD

Download the complete report in PDF