To date, we have published 4 MAAP articles* tracking deforestation by the company United Cacao in the northern Peruvian Amazon (outside the town of Tamshiyacu in the Loreto region). In these articles, based on analysis of satellite imagery, we have documented the deforestation of 2,380 hectares (5,880 acres) related to this project.
The company, however, continues to deny this deforestation**. In general, their main response seems to be that the land in question had been deforested for previous agricultural projects prior to their arrival in 2013.
Here in MAAP #35, we show definitively that this assertion simply does not match the satellite evidence. This article is based on analysis of recently-acquired satellite images from early 2013, the time period that the cacao project began. These images show, in extremely high resolution, the large-scale deforestation of primary forest in the project area between March and September 2013.*** Click each image to enlarge.
It is important to resolve the deforestation-related issues because the company has plans to expand its agricultural land bank in the coming years. Please see this recent statement from the Peruvian Forestry Service (SERFOR) for details on the legal aspect of this case.
As a reference, at the end of the article there is a graphic (Image 35l) illustrating the difference (as seen in high-resolution imagery) between primary forest, secondary vegetation, agricultural areas, and deforested areas.
New Evidence of Large-Scale Deforestation in 2013
We recently obtained high-resolution satellite imagery from March 25, 2013, immediately before the beginning of the deforestation for the cacao project. Image 35a shows the same exact project area between March (left panel) and September (right panel) 2013. In March, the project area is predominantly covered with primary forest*** and contains only a few scattered patches of previously disturbed land. In contrast, in September, the project area is clearly undergoing a large-scale deforestation event (1,100 hectares at that time).
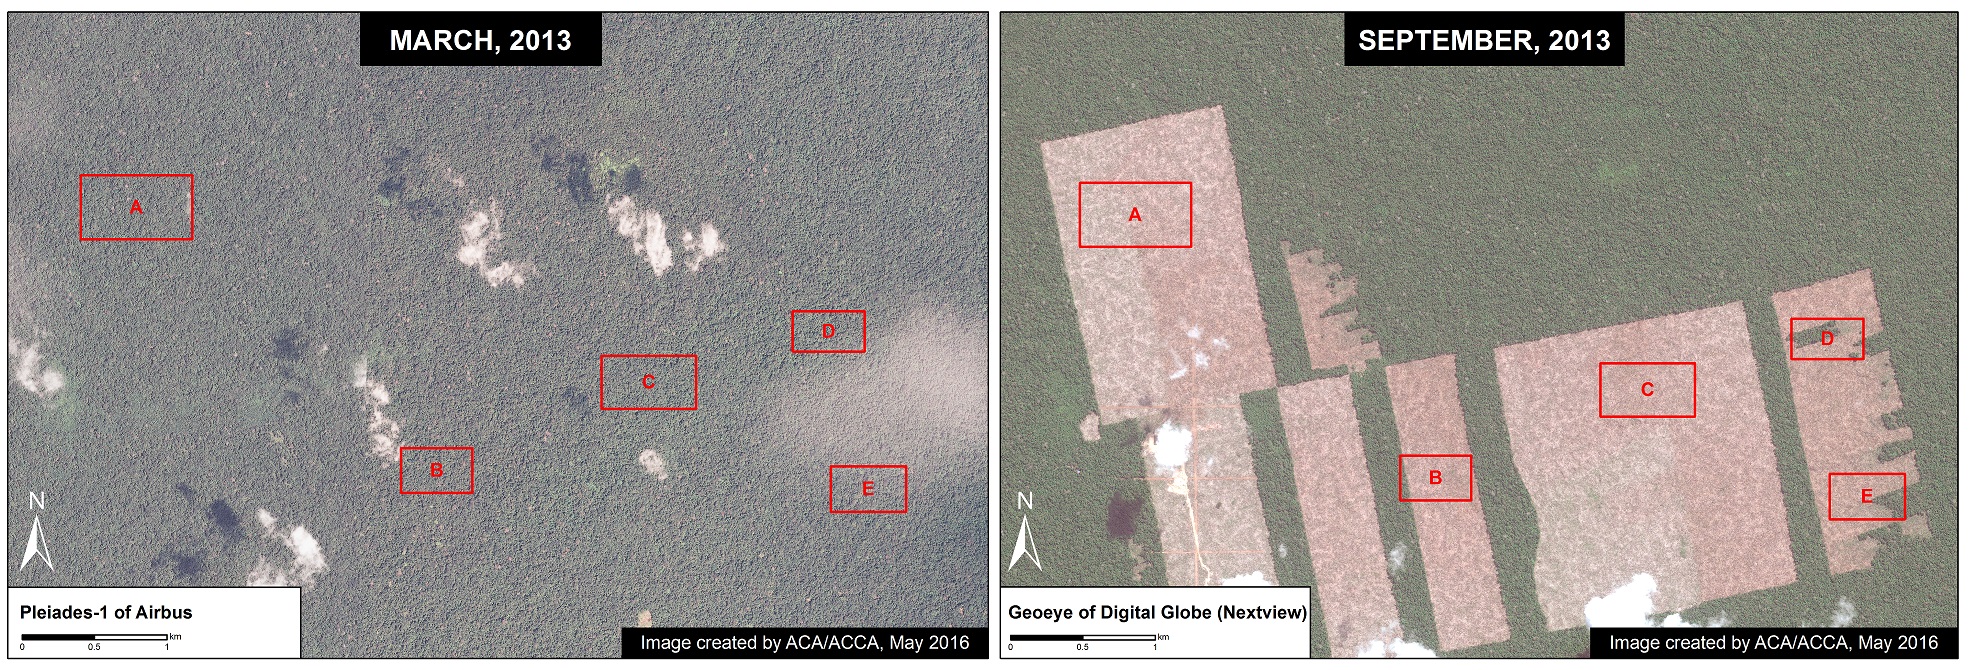
Image 35a. Data: Airbus, Digital Globe (Nextview)
Zoom A
In the following series of images, we show zooms of the areas indicated by Insets A-E in Image 35a. Each image shows the same exact area within the cacao project between March (left panel) and September (right panel) 2013. In all images, one can clearly see intact forest in March followed by large-scale deforestation in September.

Image 35b. Data: Airbus, Digital Globe (Nextview)
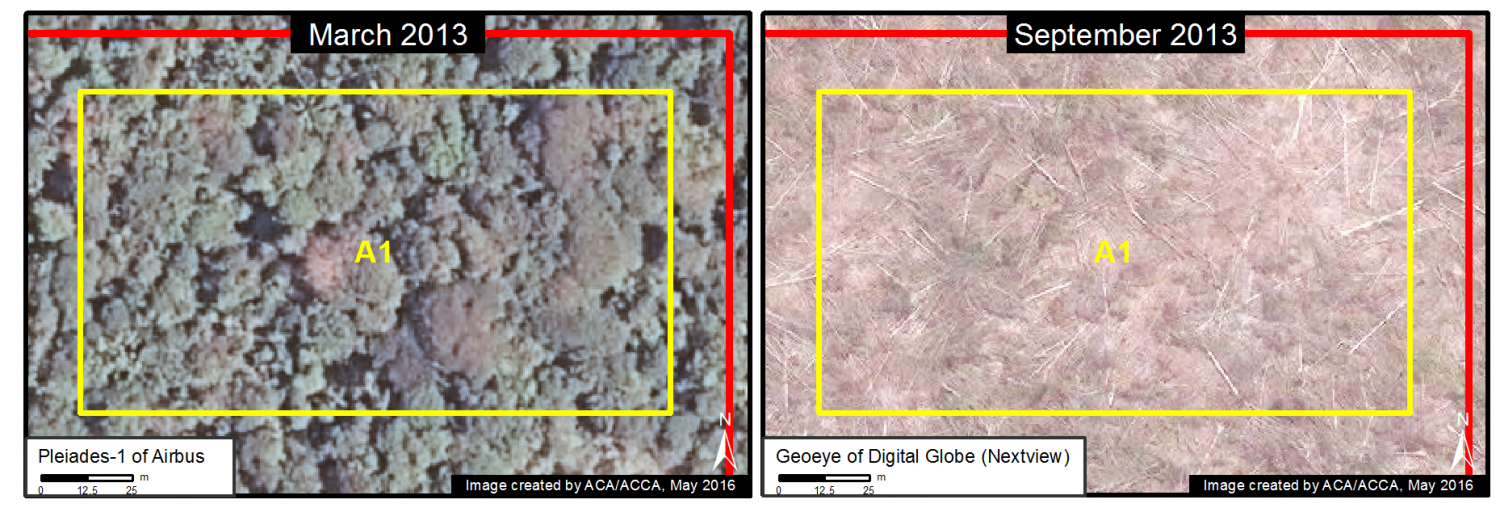
Image 35c. Data: Airbus, Digital Globe (Nextview)
Zoom B
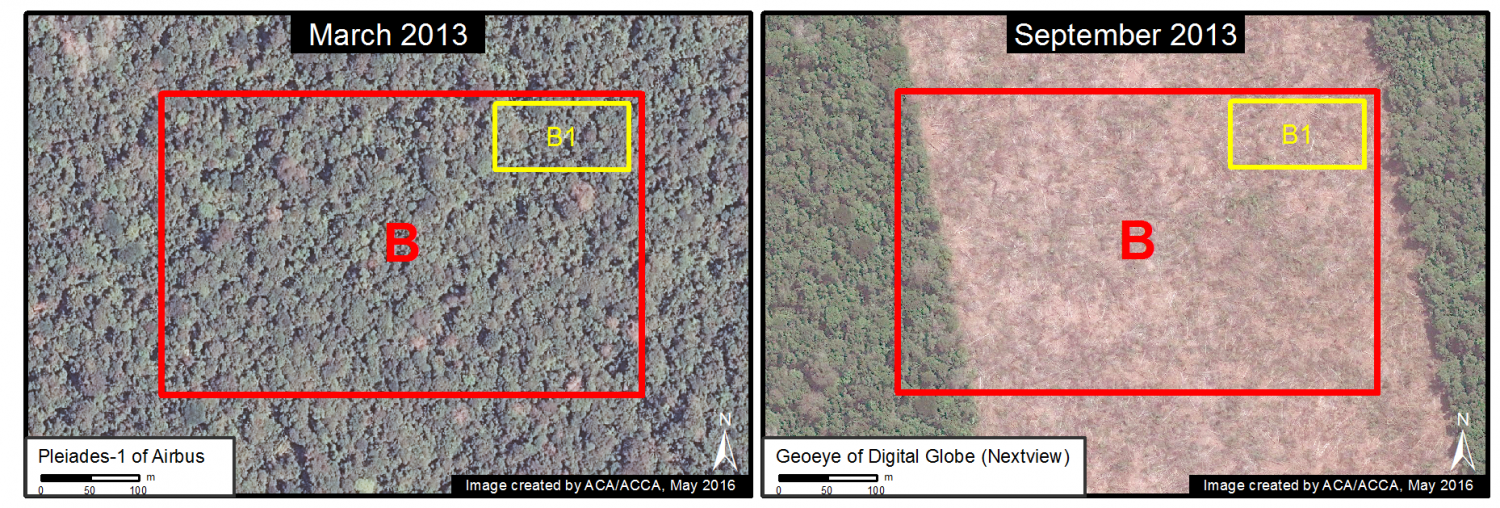
Image 35d. Data: Airbus, Digital Globe (Nextview)
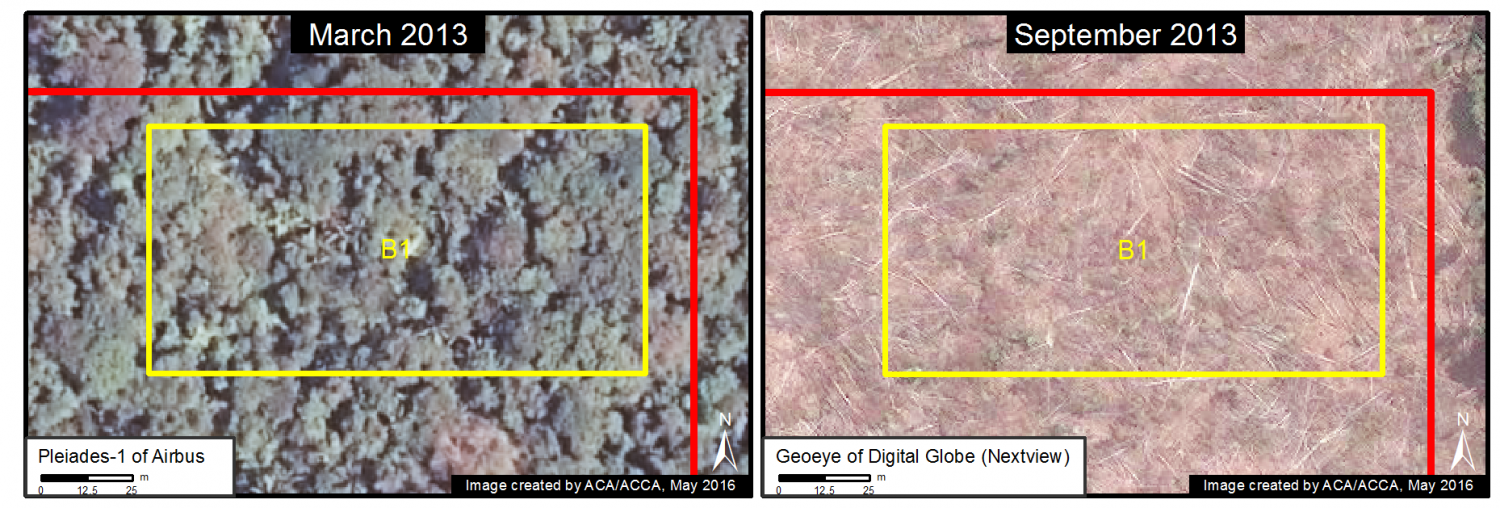
Image 35e. Data: Airbus, Digital Globe (Nextview)
Zoom C
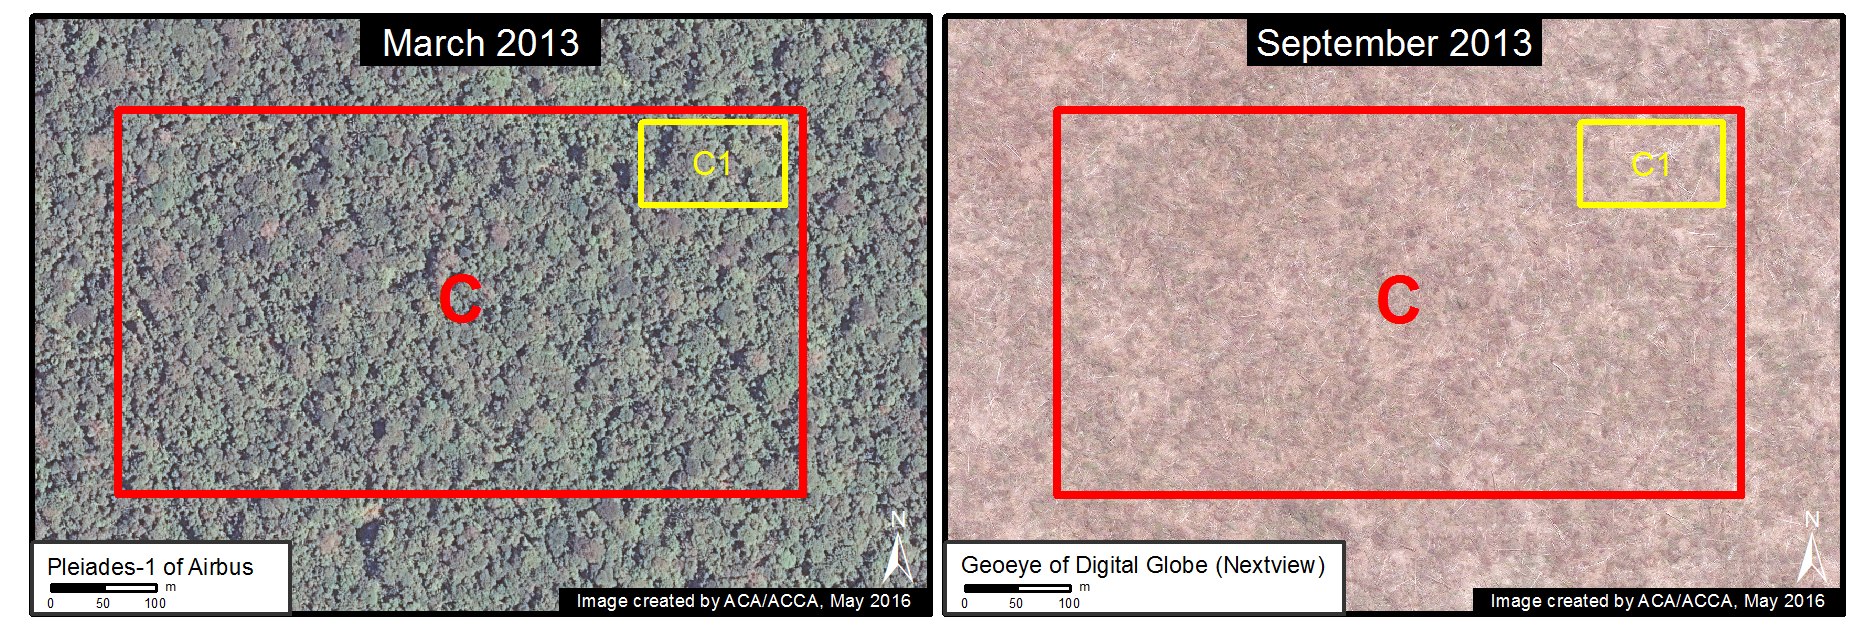
Image 35f. Data: Airbus, Digital Globe (Nextview)
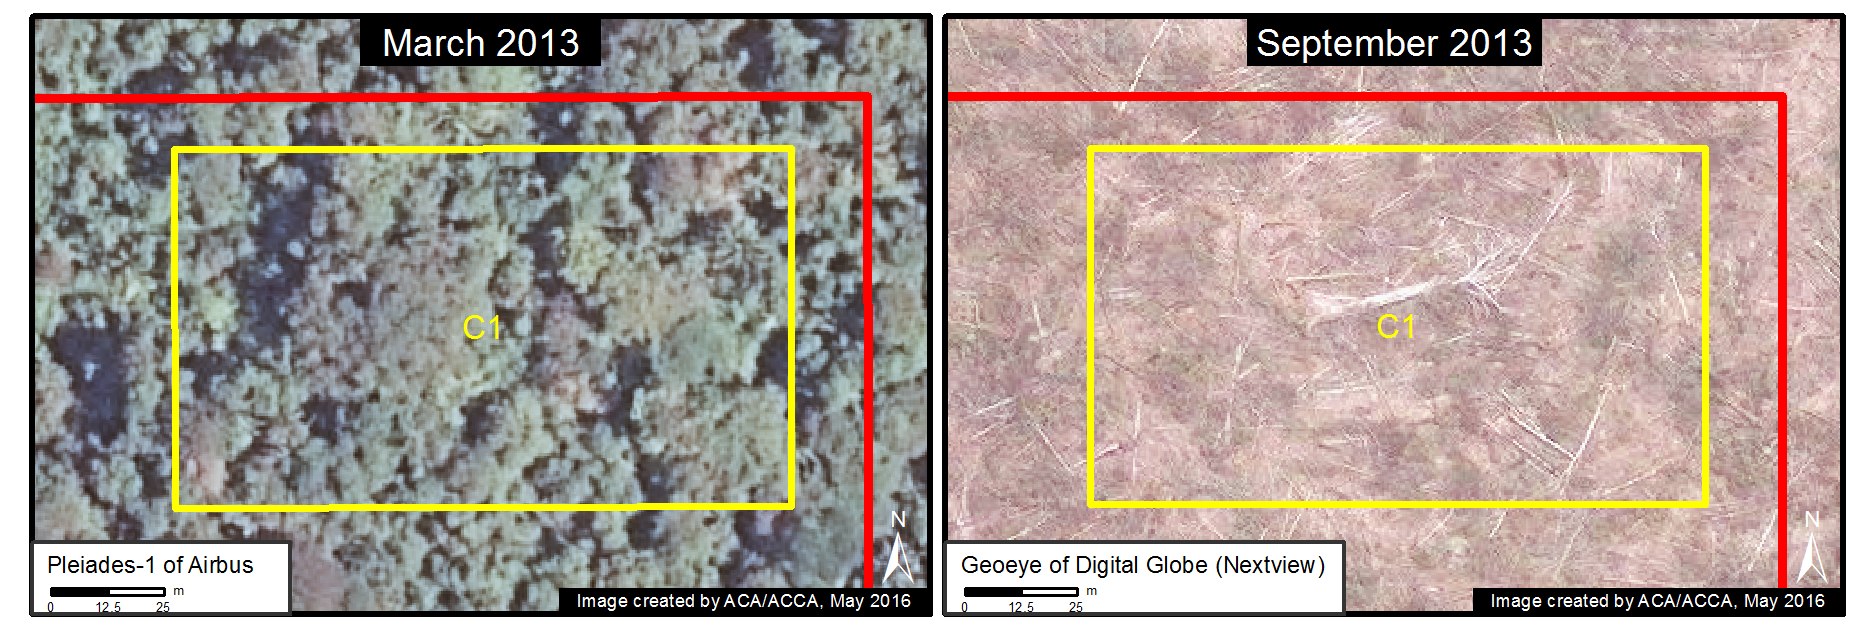
Image 35g. Data: Airbus, Digital Globe (Nextview)
Zoom D
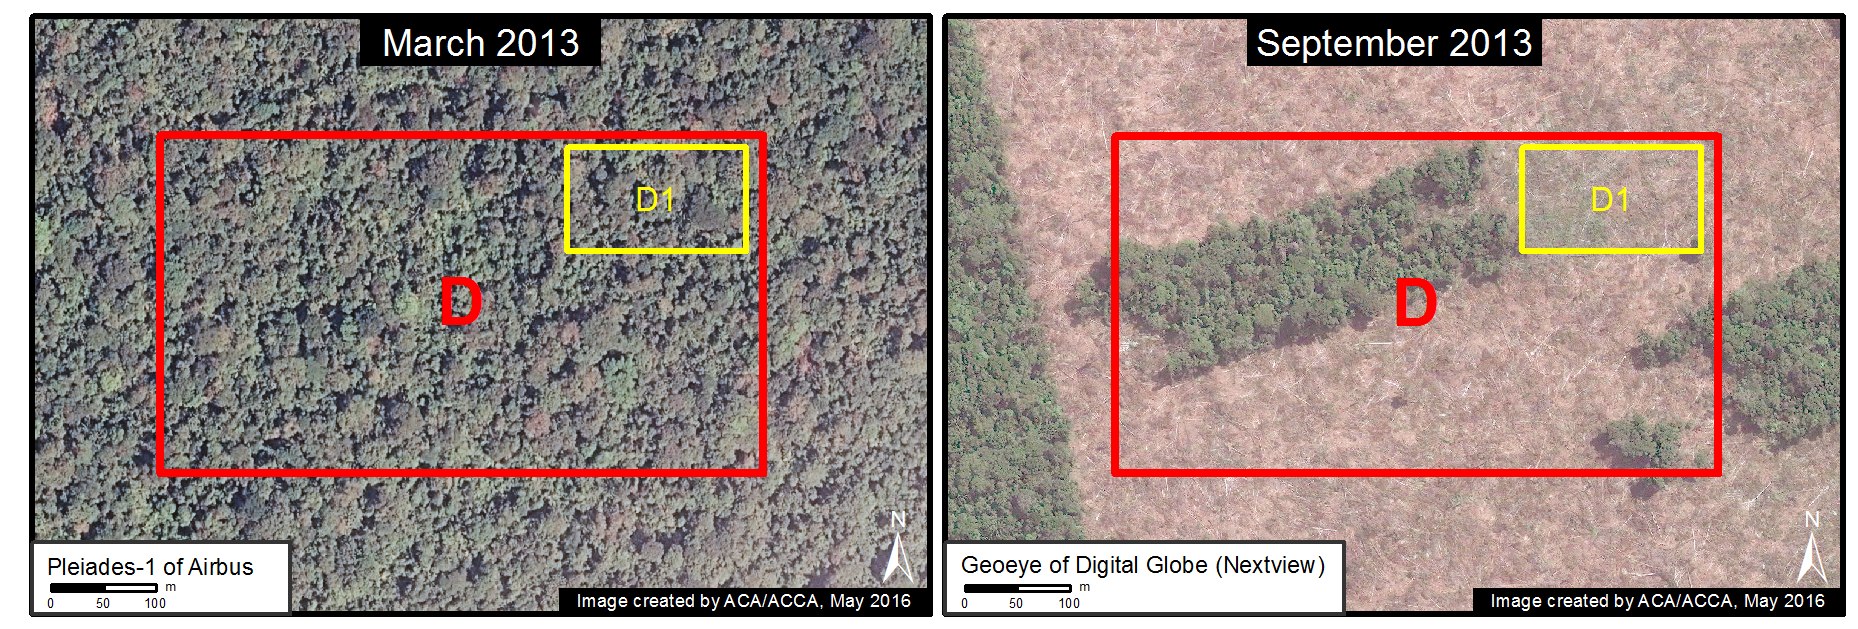
Image 35h. Data: Airbus, Digital Globe (Nextview)
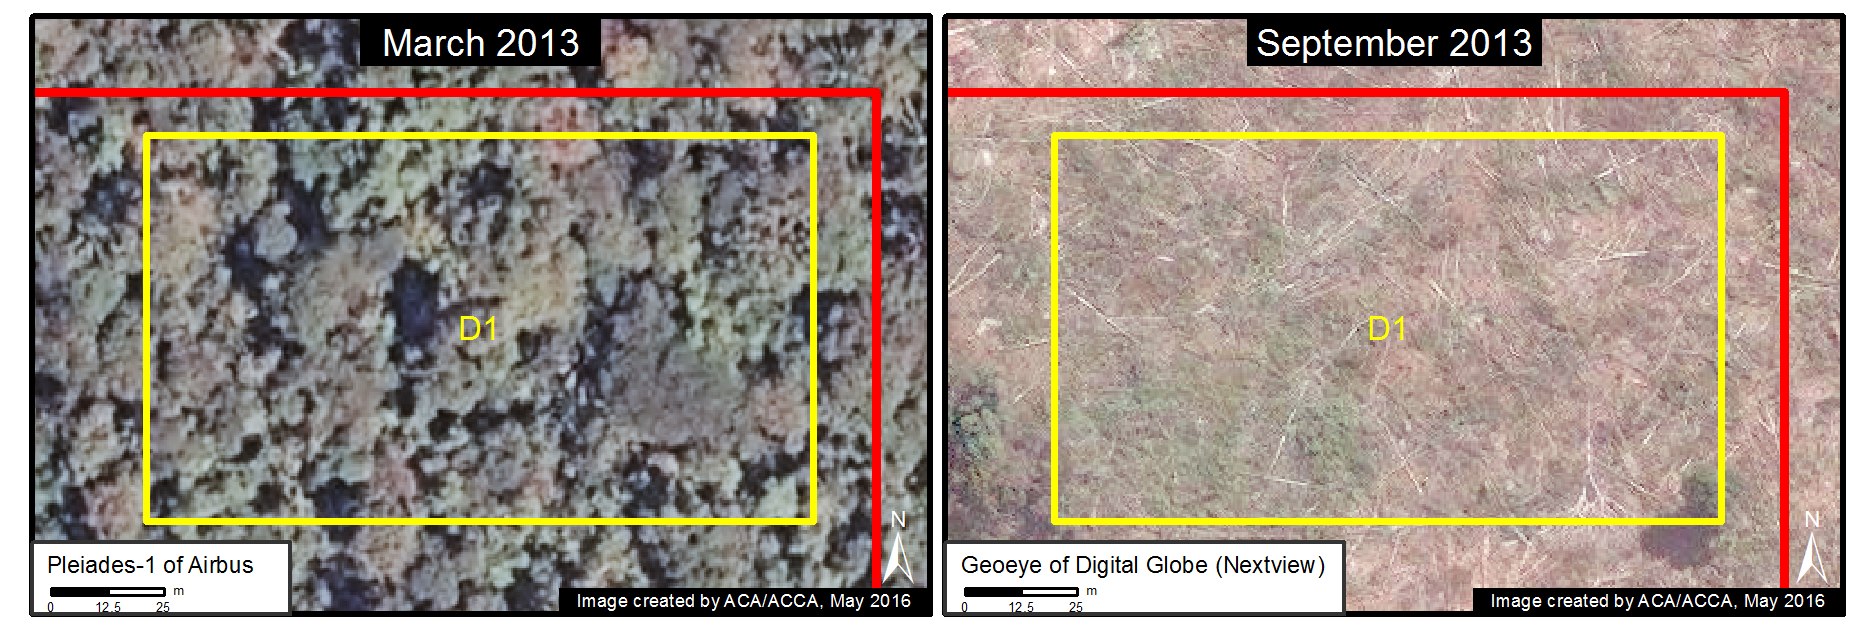
Image 35i. Data: Airbus, Digital Globe (Nextview)
Zoom E
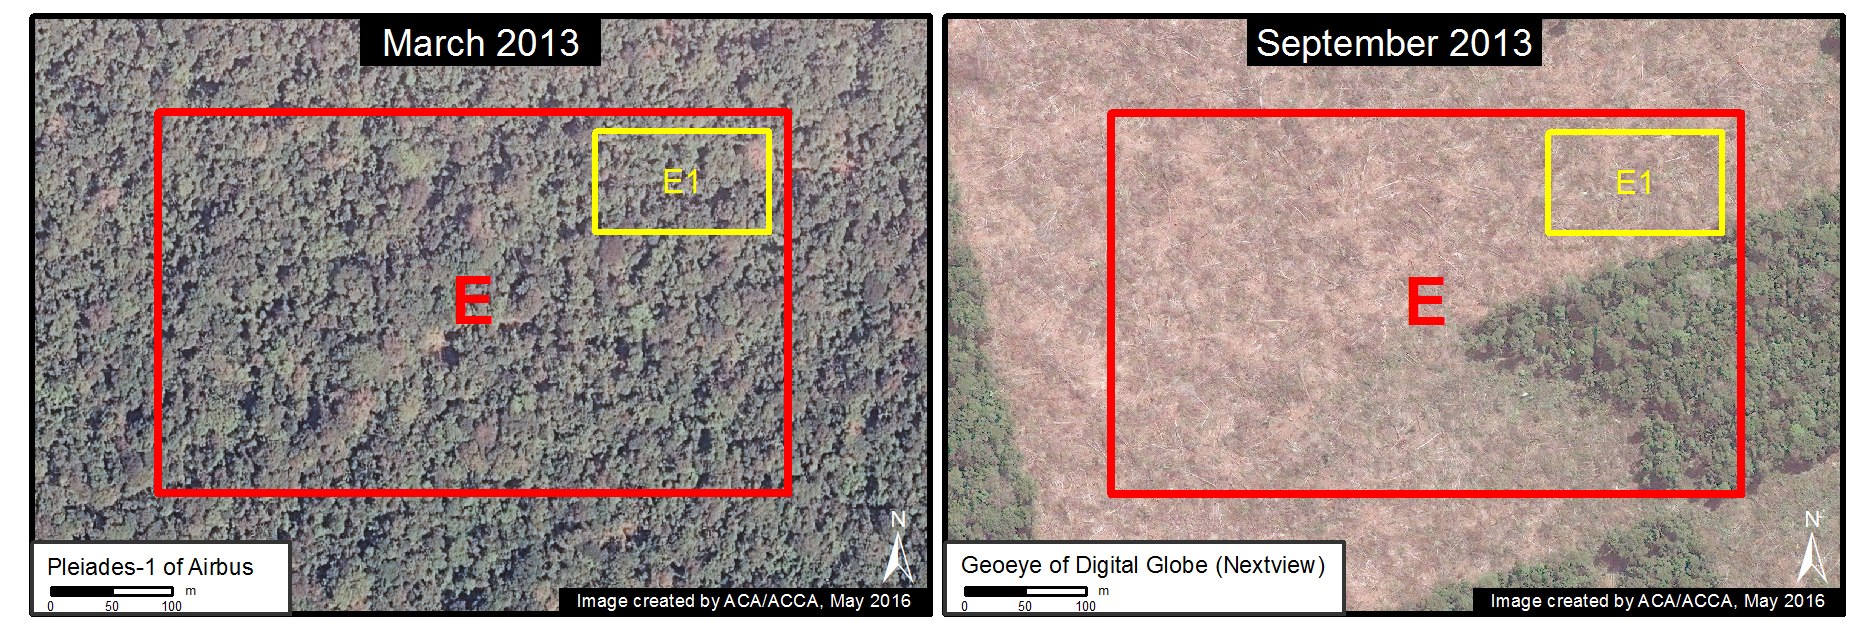
Image 35j. Data: Airbus, Digital Globe (Nextview)
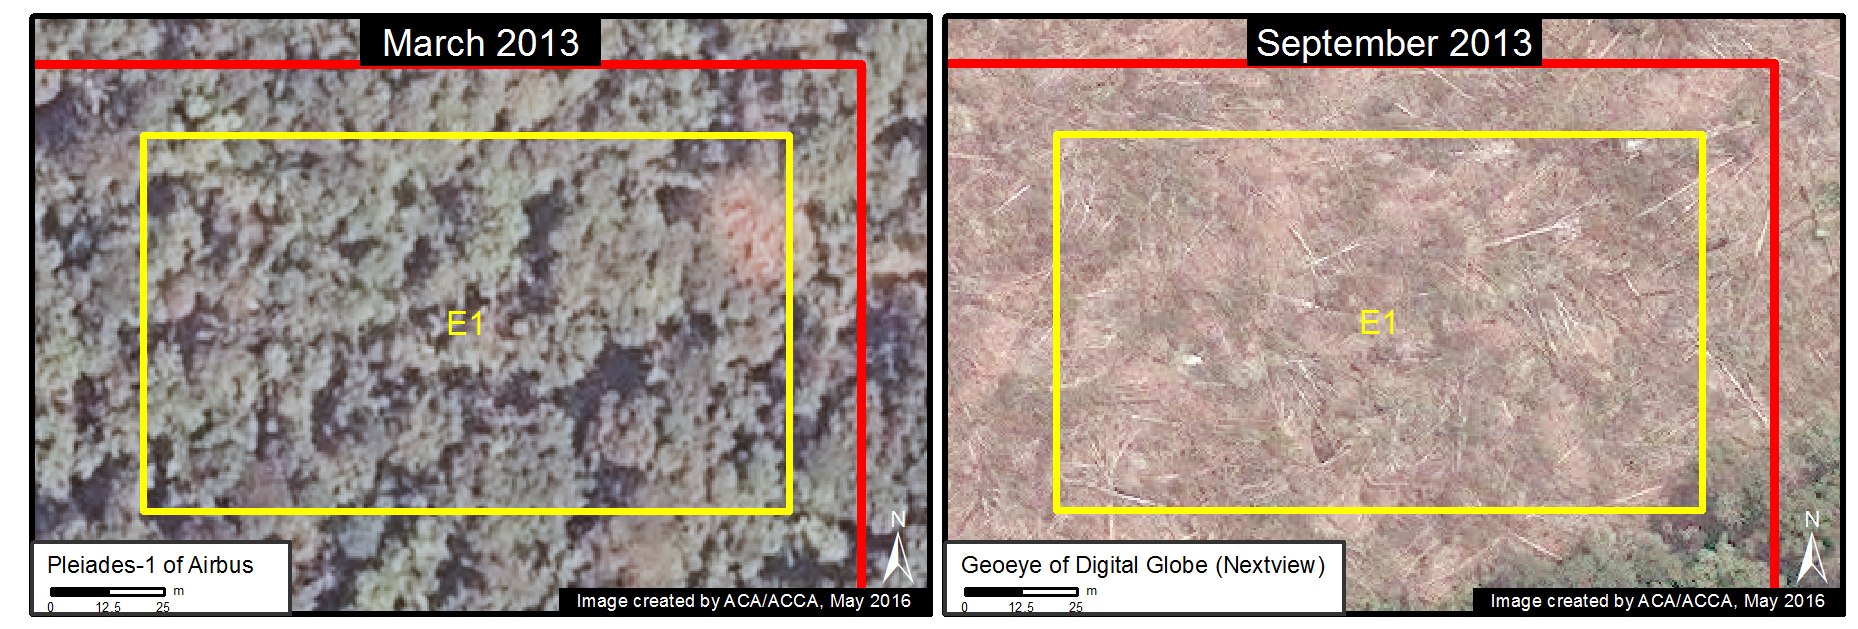
Image 35k. Data: Airbus, Digital Globe (Nextview)
Reference Graphic
Finally, for reference, Image 35l illustrates the difference (as seen in high-resolution imagery) between primary forest, secondary vegetation, agricultural areas, and deforested areas.
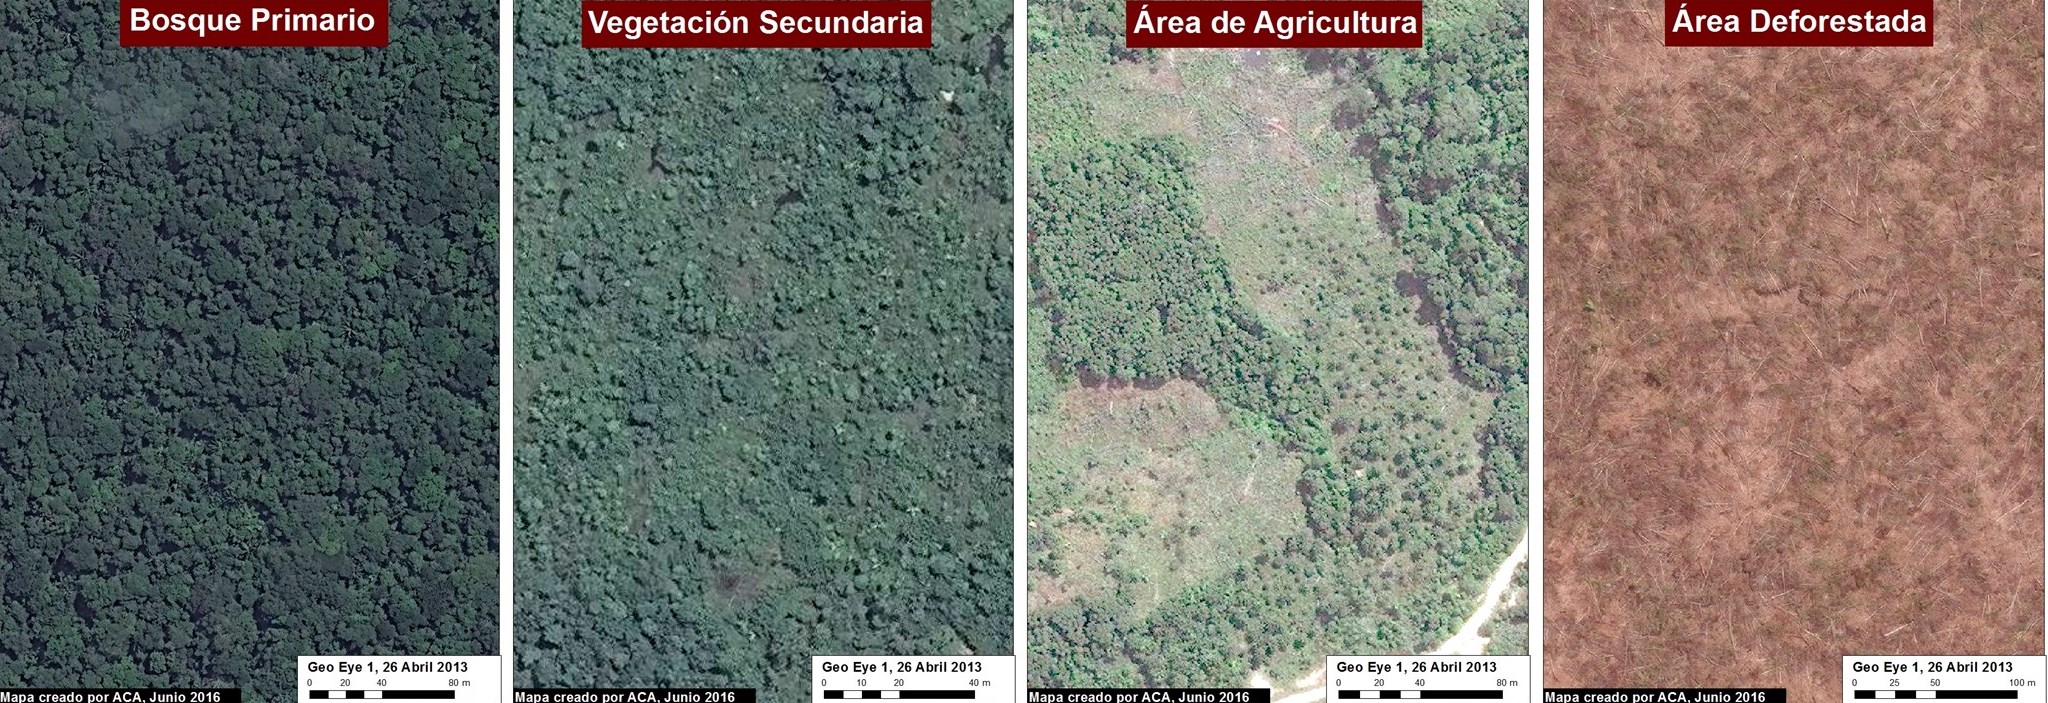
Image 35l. Data: Worldview (NextView)
References
*MAAP #27, MAAP #13, MAAP #9, MAAP #2
**See articles in Directors Talk, La Region, y The Guardian
***see MAAP #9 for details on our time-series analysis dating back to 1985 that revealed that the vast majority of the project area is primary forest
Citation
Finer M, Cruz C, Novoa S (2016) Confirming Amazon Deforestation by United Cacao in 2013 [High Res View]. MAAP: 35.
