MAAP #136: Amazon Deforestation 2020 (Final)


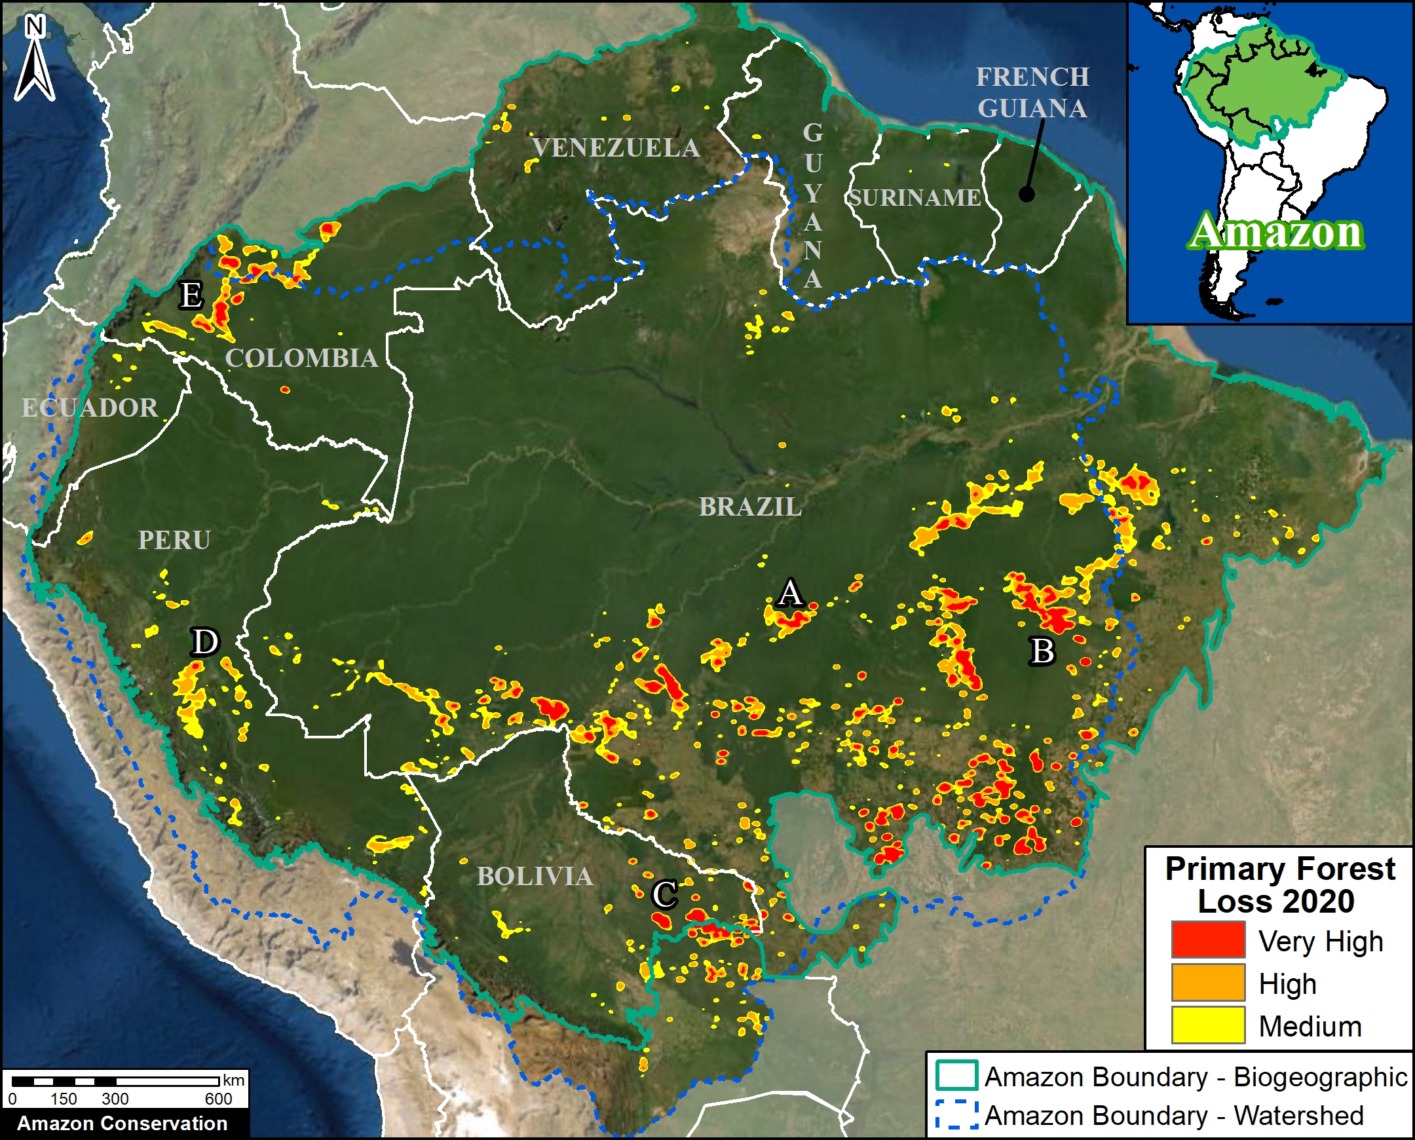
Base Map. Forest loss hotspots across the Amazon in 2020. Data: Hansen/UMD/Google/USGS/NASA, RAISG, MAAP. The letters A-E correspond to the zoom examples below.
*To download the report, click “Print” instead of “Download PDF” at the top of the page.
In January, we presented the first look at 2020 Amazon deforestation based on early warning alert data (MAAP #132).
Here, we update this analysis based on the newly released, and more definitive, annual data.*
The Base Map illustrates the final results and indicates the major hotspots of primary forest loss across the Amazon in 2020.
We highlight several key findings:
- The Amazon lost nearly 2.3 million hectares (5.6 million acres) of primary forest loss in 2020 across the nine countries it spans.
g - This represents a 17% increase in Amazon primary forest loss from the previous year (2019), and the third-highest annual total on record since 2000 (see graph below).
j - The countries with the highest 2020 Amazon primary forest loss are 1) Brazil, 2) Bolivia, 3) Peru, 4) Colombia, 5) Venezuela, and 6) Ecuador.
h - 65% occurred in Brazil (which surpassed 1.5 million hectares lost), followed by 10% in Bolivia, 8% in Peru, and 6% in Colombia (remaining countries all under 2%).
k - For Bolivia, Ecuador, and Peru, 2020 recorded historical high Amazon primary forest loss. For Colombia, it was the second highest on record.
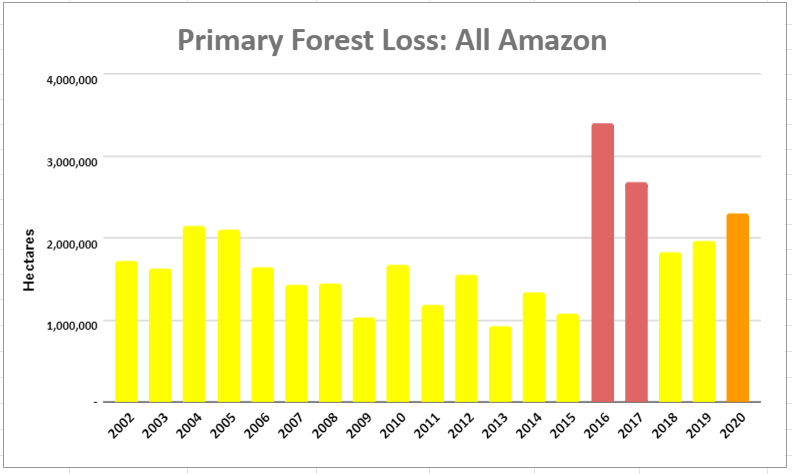 In all of the data graphs, orange indicates the 2020 primary forest loss and red indicates all years with higher totals than 2020.
For example, the Amazon lost nearly 2.3 million hectares in 2020 (orange), the third highest on record behind only 2016 and 2017 (red).
Note that the three highest years (2016, 2017, and 2020) had one major thing in common: uncontrolled forest fires in the Brazilian Amazon.
See below for country-specific graphs, key findings, and satellite images for the top four 2020 Amazon deforestation countries (Brazil, Bolivia, Peru, and Colombia).
 Brazilian Amazon
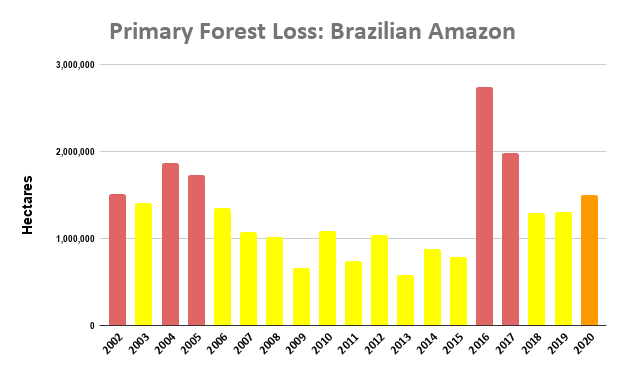
2020 had the sixth-highest primary forest loss on record (1.5 million hectares) and a 13% increase from 2019.
Many of the 2020 hotspots occurred in the Brazilian Amazon, where massive deforestation stretched across nearly the entire southern region.
A common phenomenon observed in the satellite imagery through August was that rainforest areas were first deforested and then later burned, causing major fires due to the abundant recently-cut biomass (Image A). This was also the pattern observed in the high-profile 2019 Amazon fire season. Much of the deforestation in these areas appears to associated with expanding cattle pasture areas.
In September 2020 (and unlike 2019), there was a shift to actual Amazon forest fires (Image B). See MAAP #129 for more information on the link between deforestation and fire in 2020.
Note that the three highest years (2016, 2017, and 2020) had one major thing in common: uncontrolled forest fires in the Brazilian Amazon.
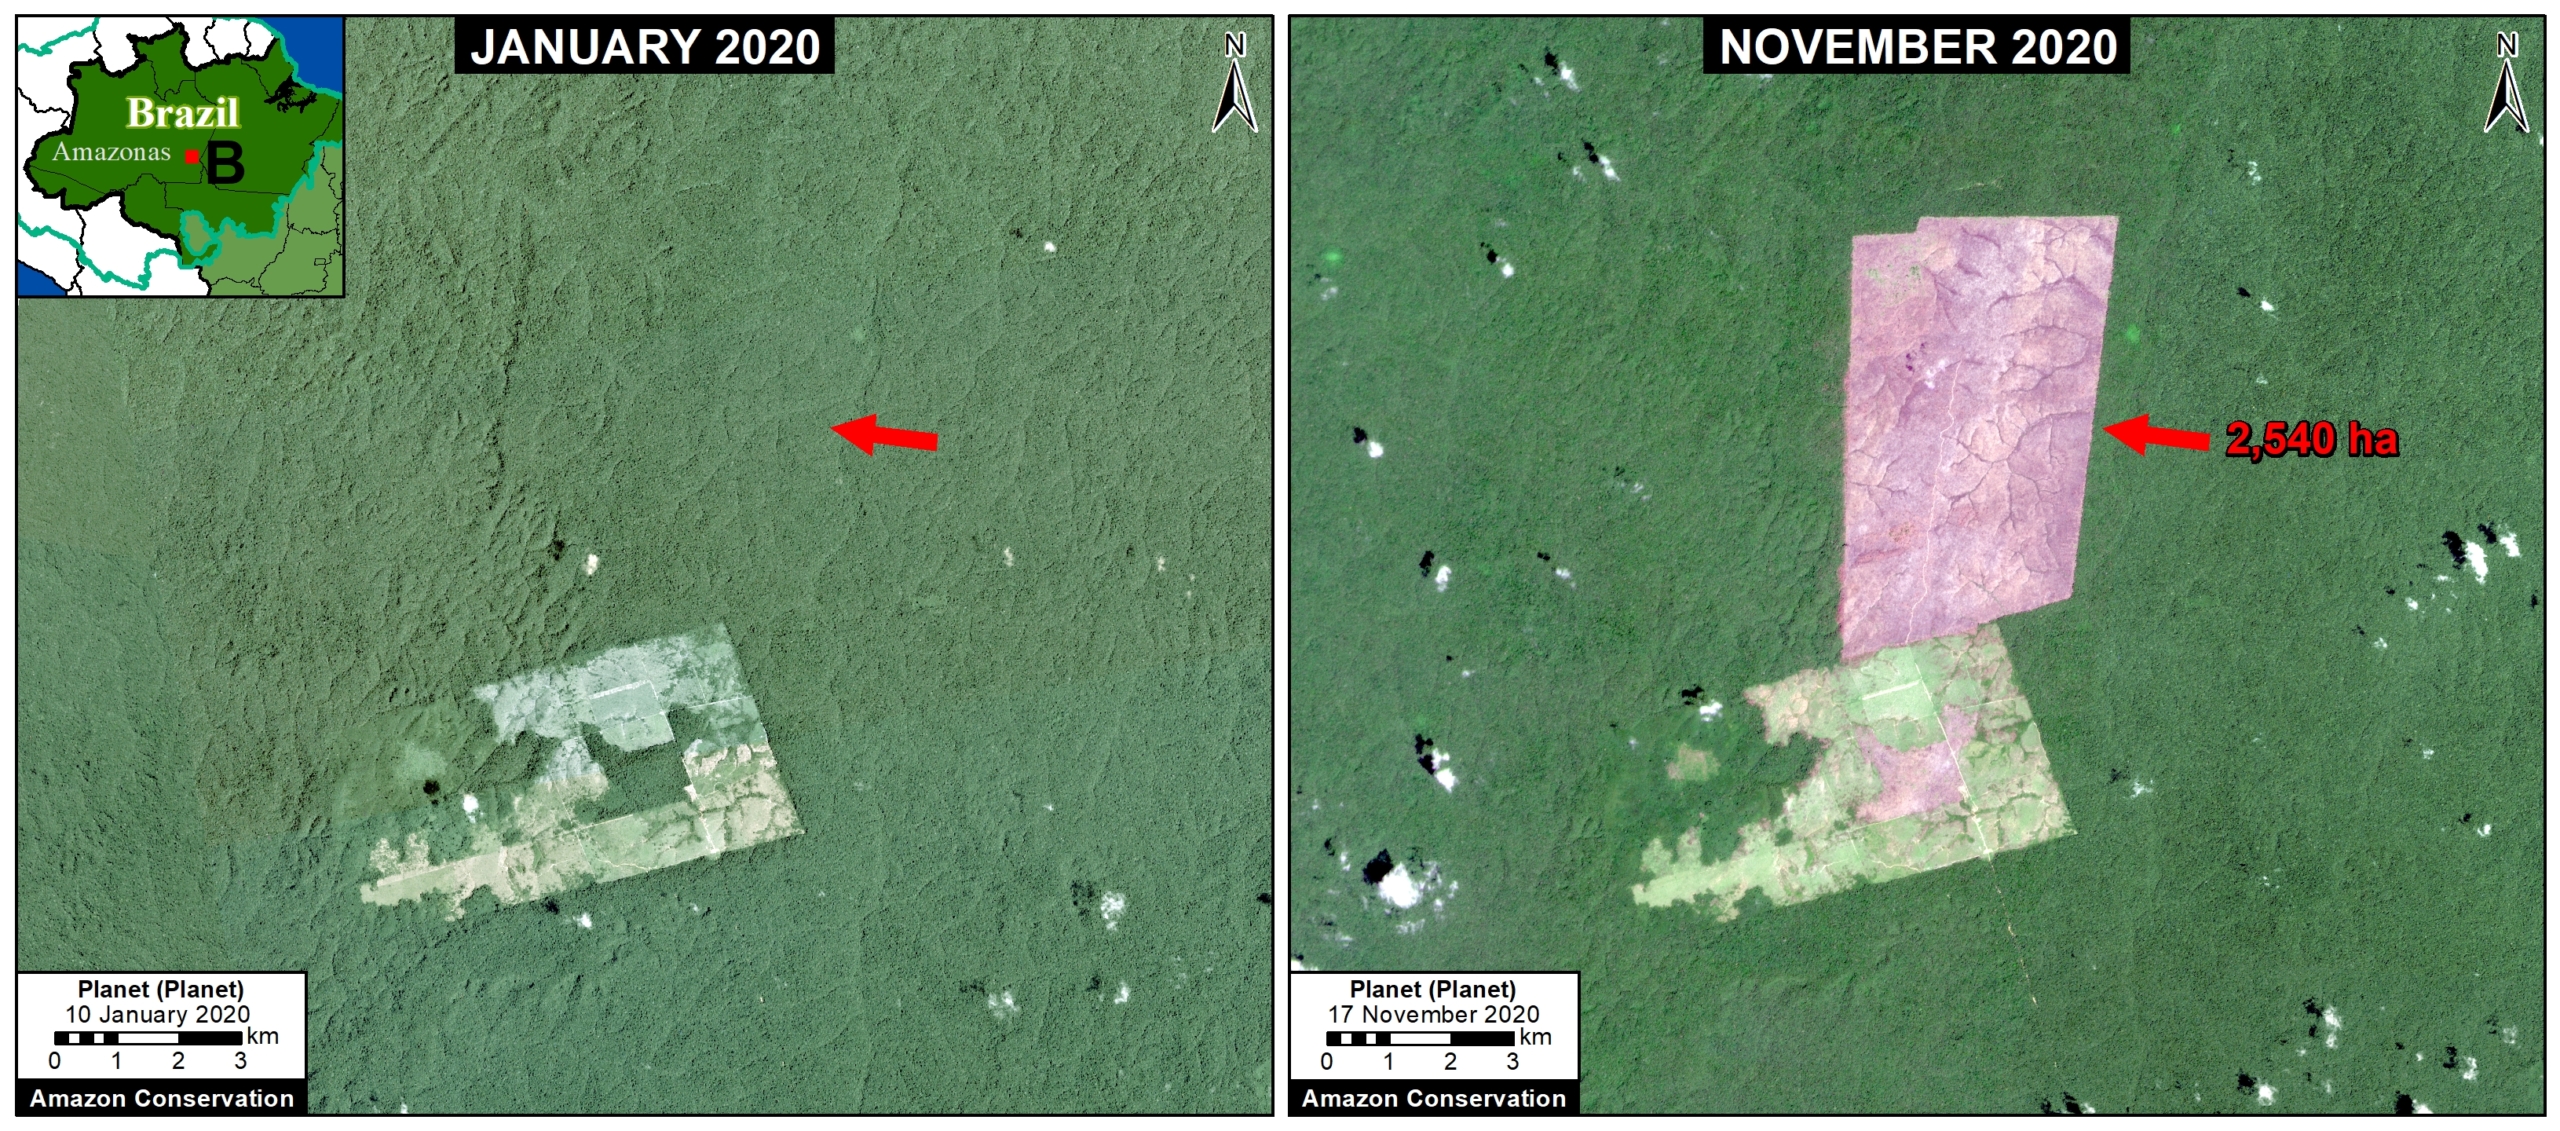
Image A. Deforestation in Brazilian Amazon (Amazonas state) of 2,540 hectares between January (left panel) and November (right panel) 2020. Data: Planet.
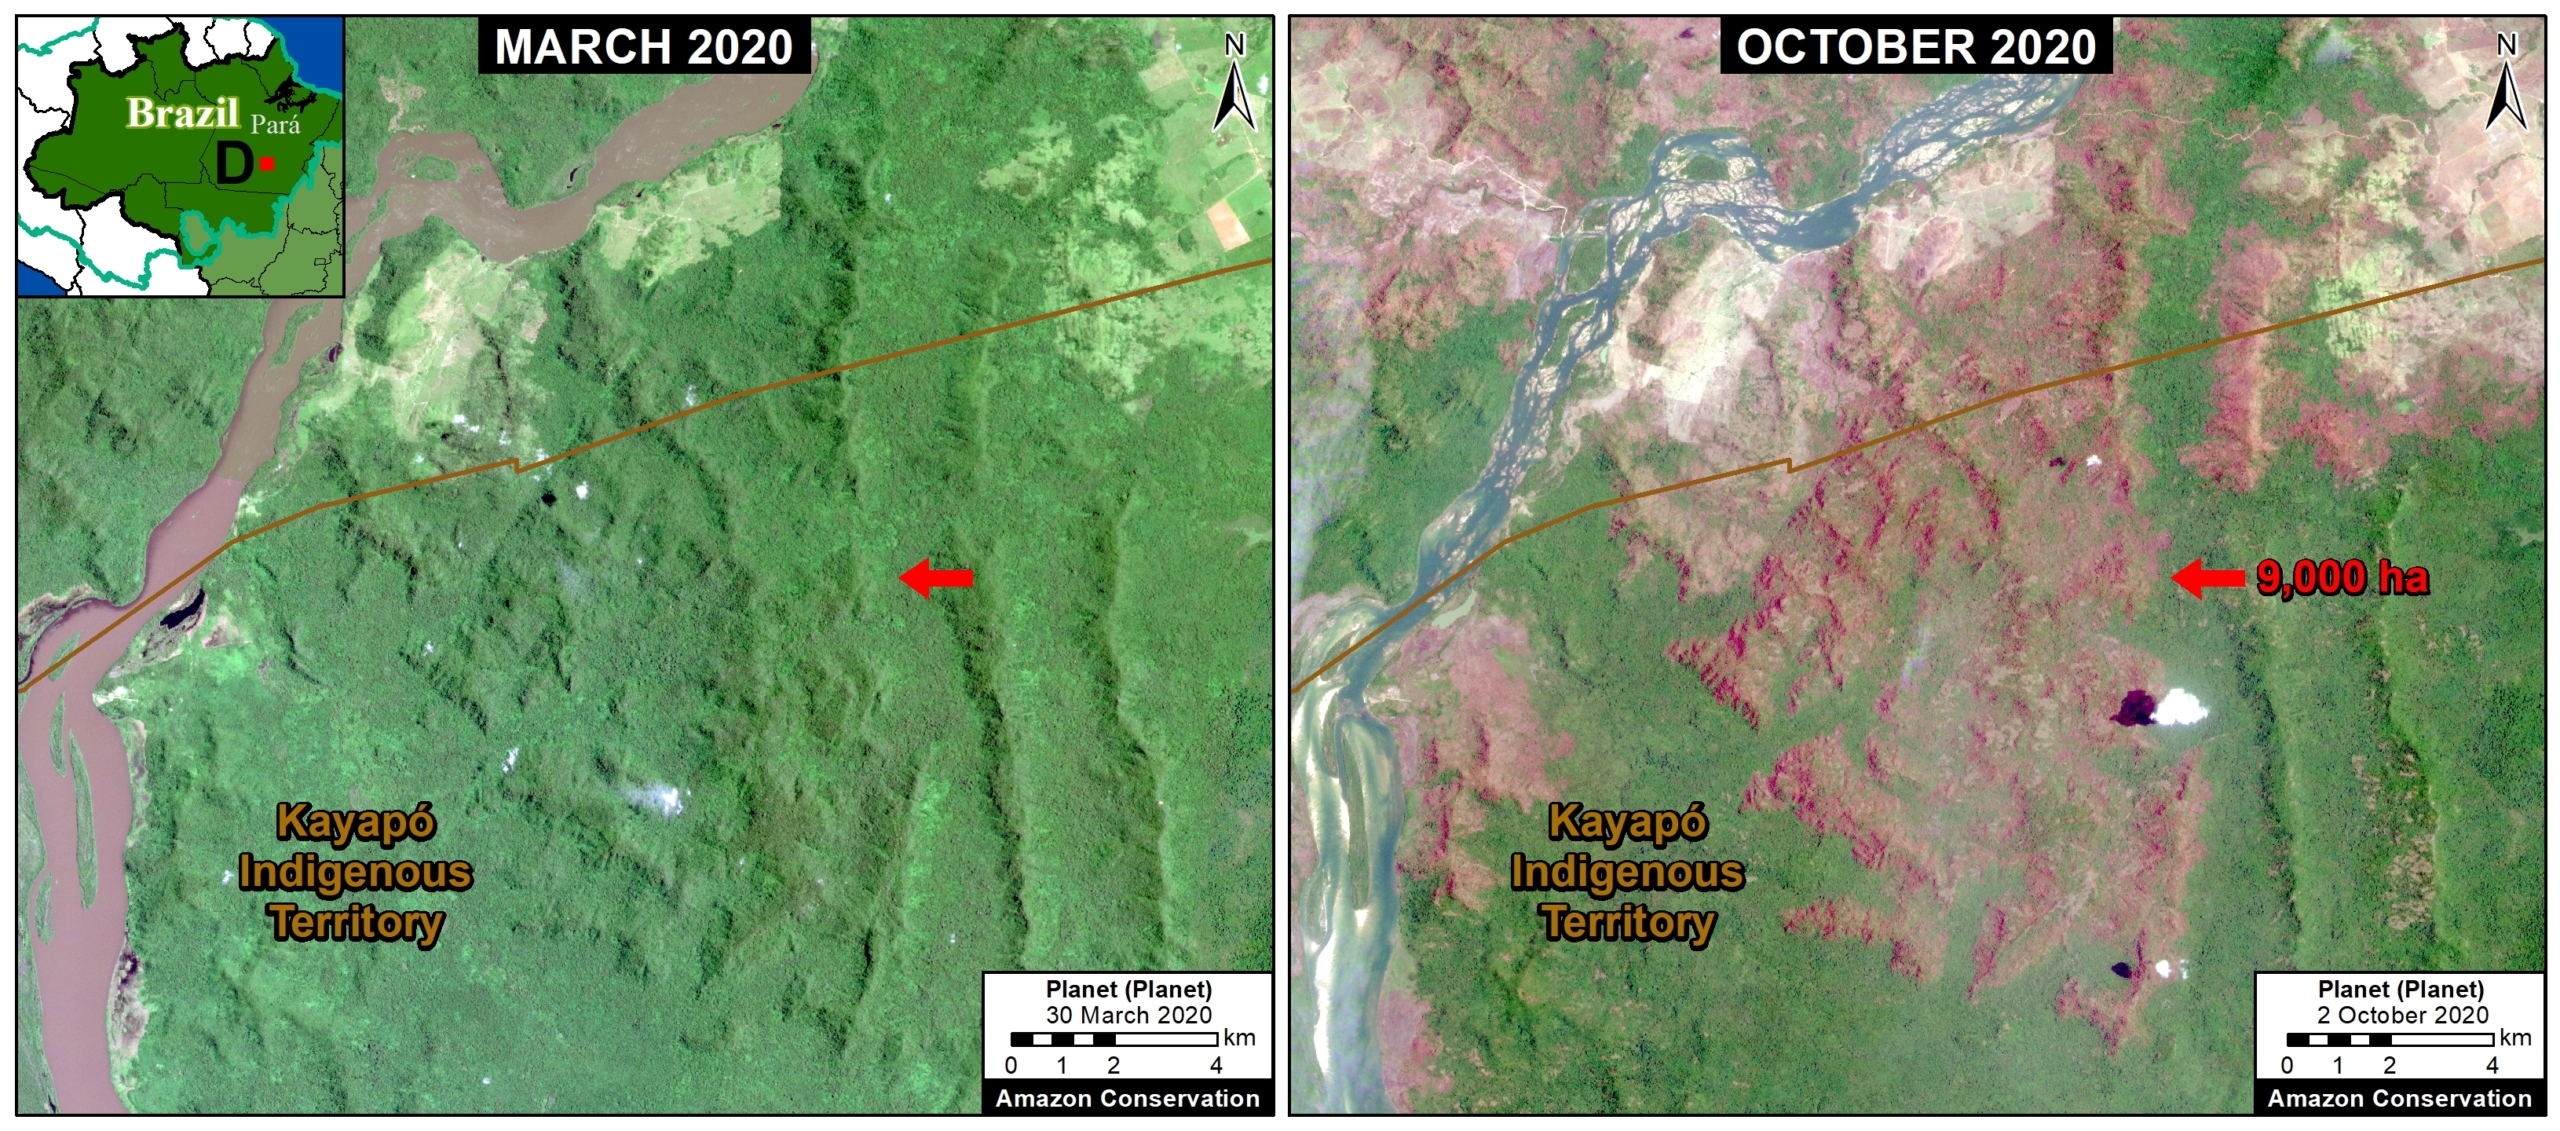
Image B. Forest fire in Brazilian Amazon (Para state) that burned 9,000 hectares between March (left panel) and October (right panel) 2020. Data: Planet.
Bolivian Amazon
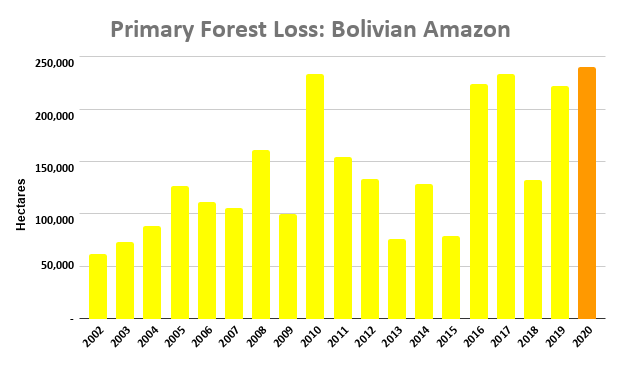
2020 had the highest primary forest loss on record in the Bolivian Amazon, surpassing 240,000 hectares.
Indeed, the most intense hotspots across the entire Amazon ocurred in southeast Bolivia, where fires raged through the drier Amazon forests (known as the Chiquitano and Chaco ecosystems).
Image C shows the burning of a massive area (over 260,000 hectares) in the Chiquitano dry forests (Santa Cruz department).
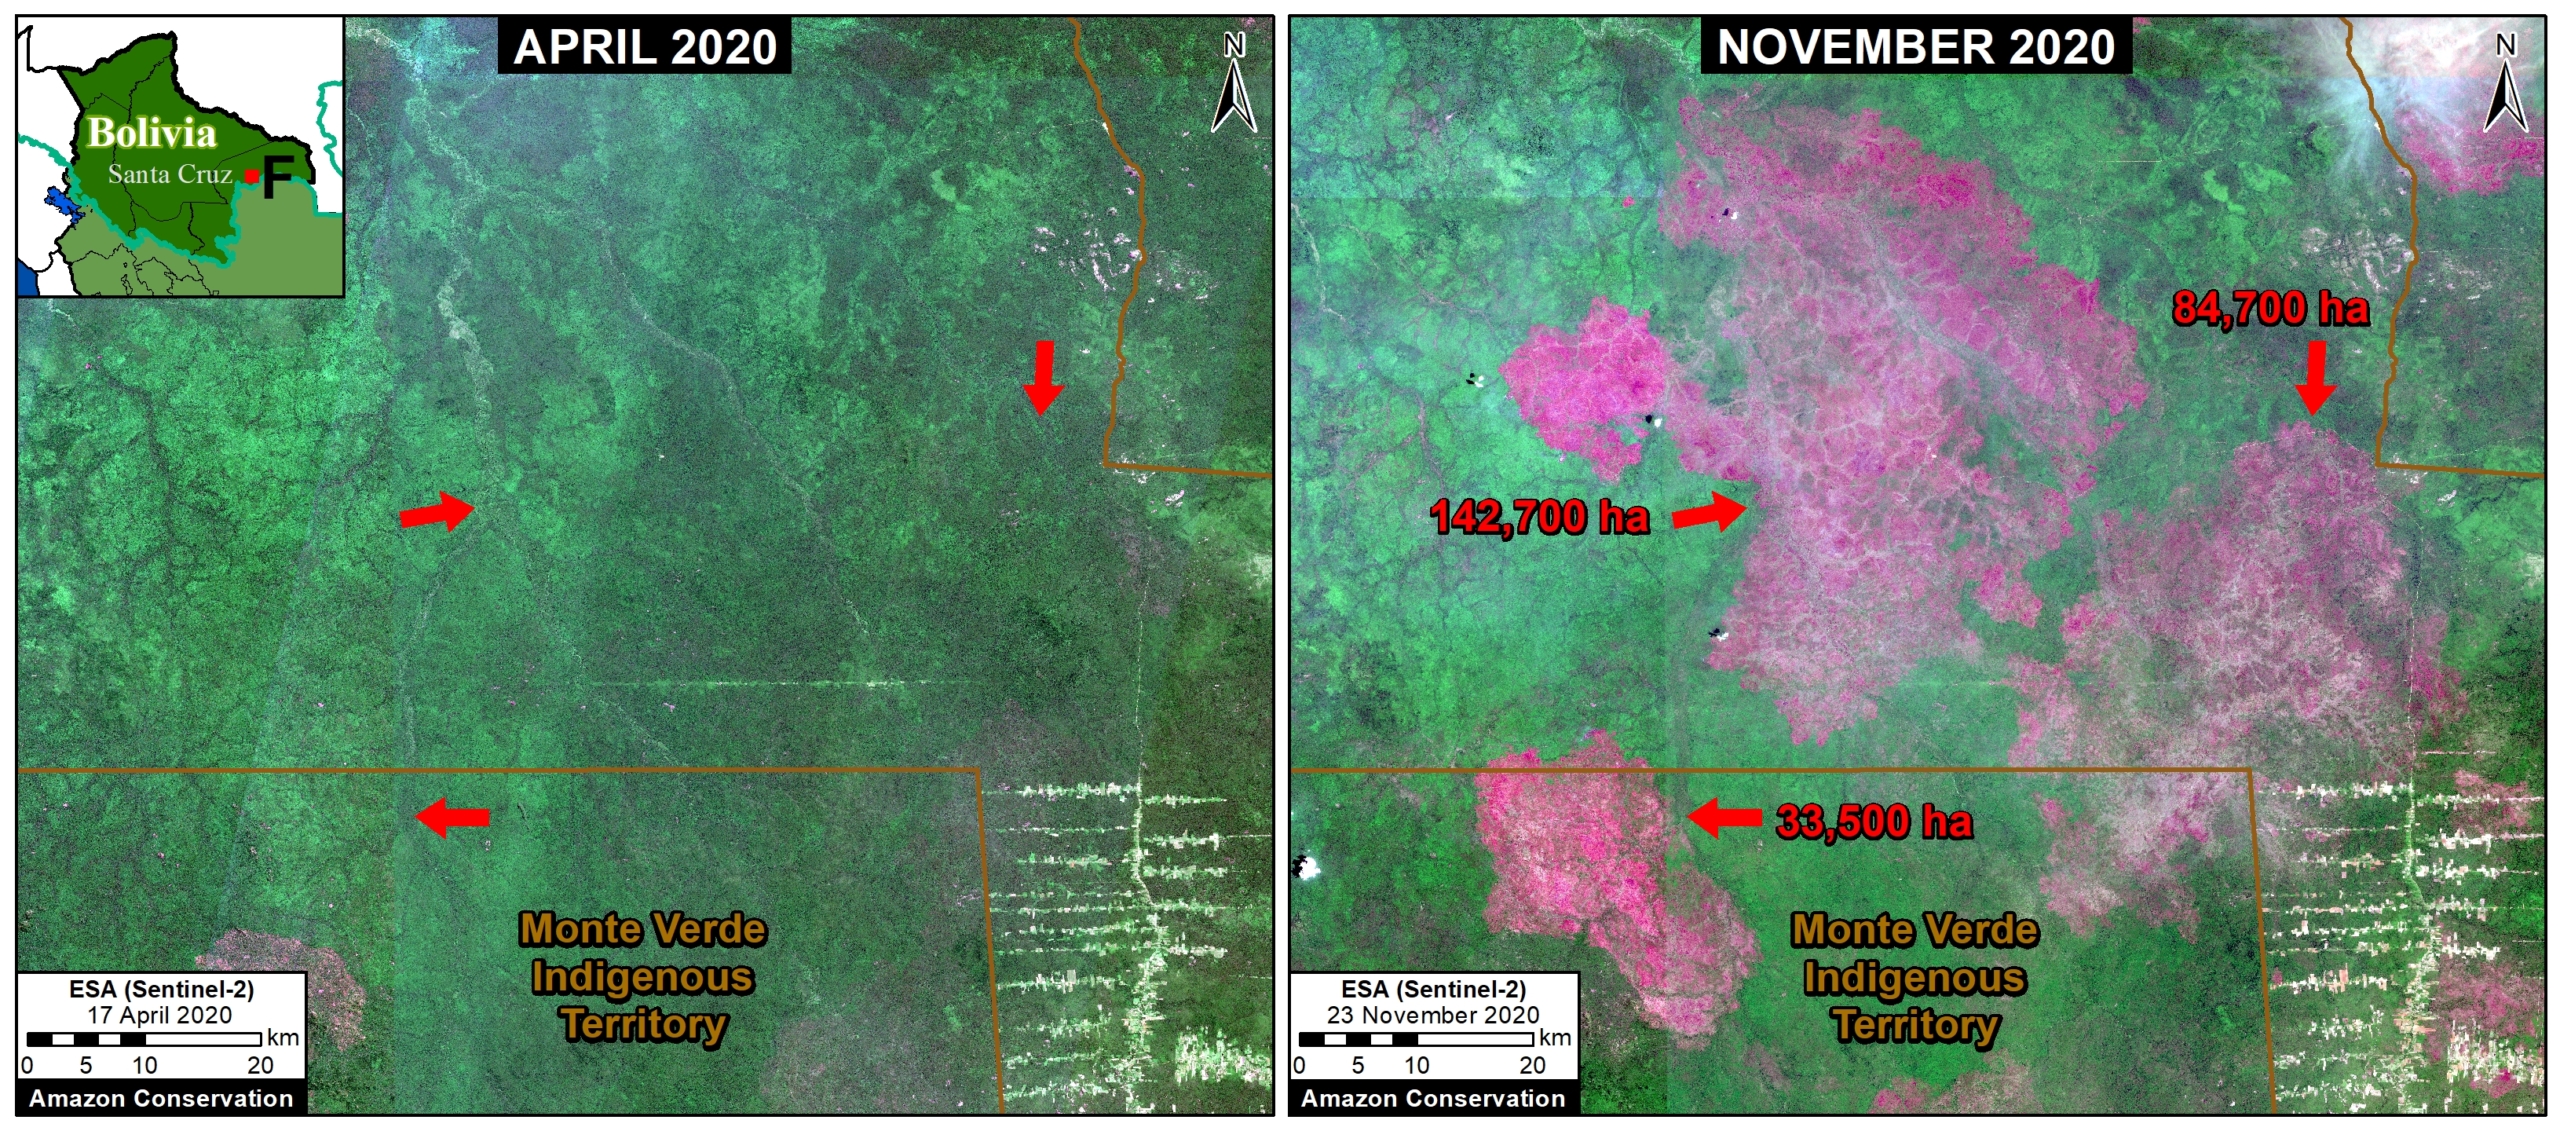
Image C. Forest fire in Bolivian Amazon (Santa Cruz) that burned over 260,000 hectares between April (left panel) and November (right panel) 2020. Data: ESA.
Peruvian Amazon
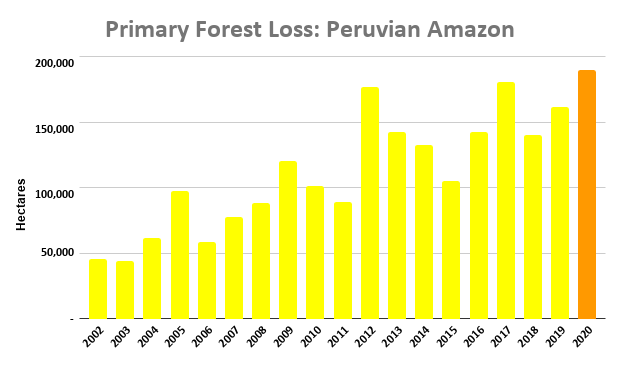
2020 also had the highest primary forest loss on record in the Peruvian Amazon, surpassing 190,000 hectares.
This deforestation is concentrated in the central region. On the positive, the illegal gold mining that plagued the southern region has decreased thanks to effective government action (see MAAP #130).
Image D shows expanding deforestation (over 110 hectares), and logging road construction (3.6 km), in an indigenous territory south of Sierra del Divisor National Park in the central Peruvian Amazon (Ucayali region). The deforestation appears to be associated with an expanding small-scale agriculture or cattle pasture frontier.
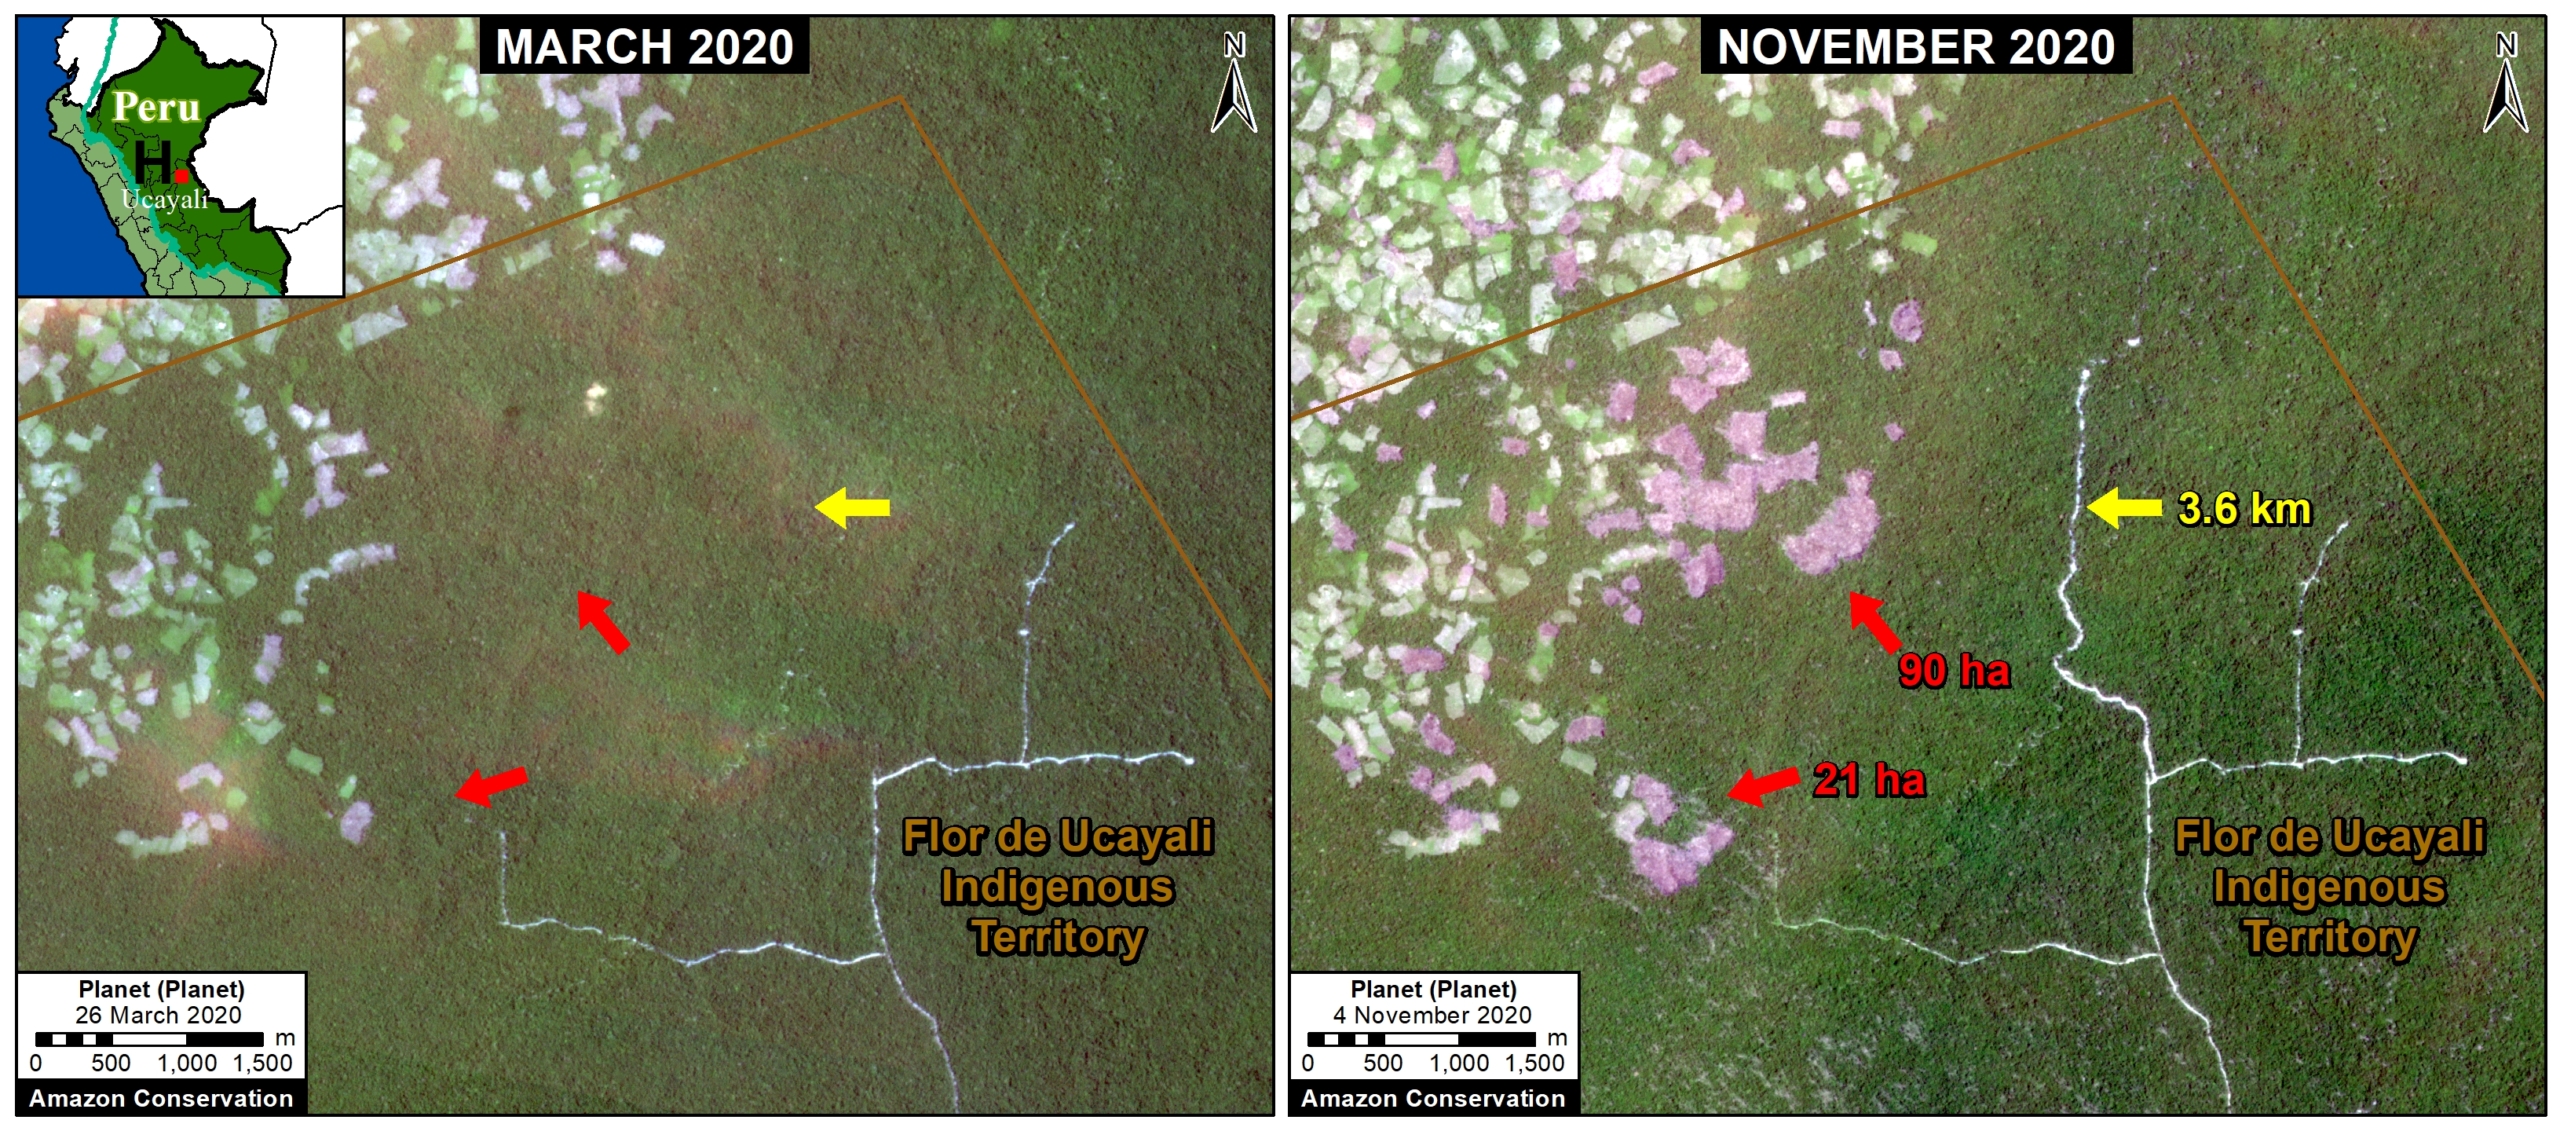
Image D. Deforestation and logging road construction in Peruvian Amazon (Ucayali region) between March (left panel) and November (right panel) 2020. Data: Planet.
 Colombian Amazon

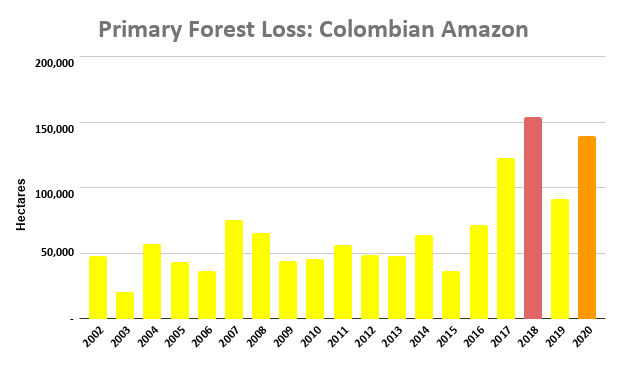
2020 had the second-highest primary forest loss on record in the Colombian Amazon, nearly 140,000 hectares.
As described in previous reports (see MAAP #120), there is an “arc of deforestation” concentrated in the northwest Colombian Amazon. This arc impacts numerous protected areas (including national parks) and Indigenous Reserves.
For example, Image E shows the recent deforestation of over 500 hectares in Chiribiquete National Park. Similar deforestation in that sector of the park appears to be conversion to cattle pasture.
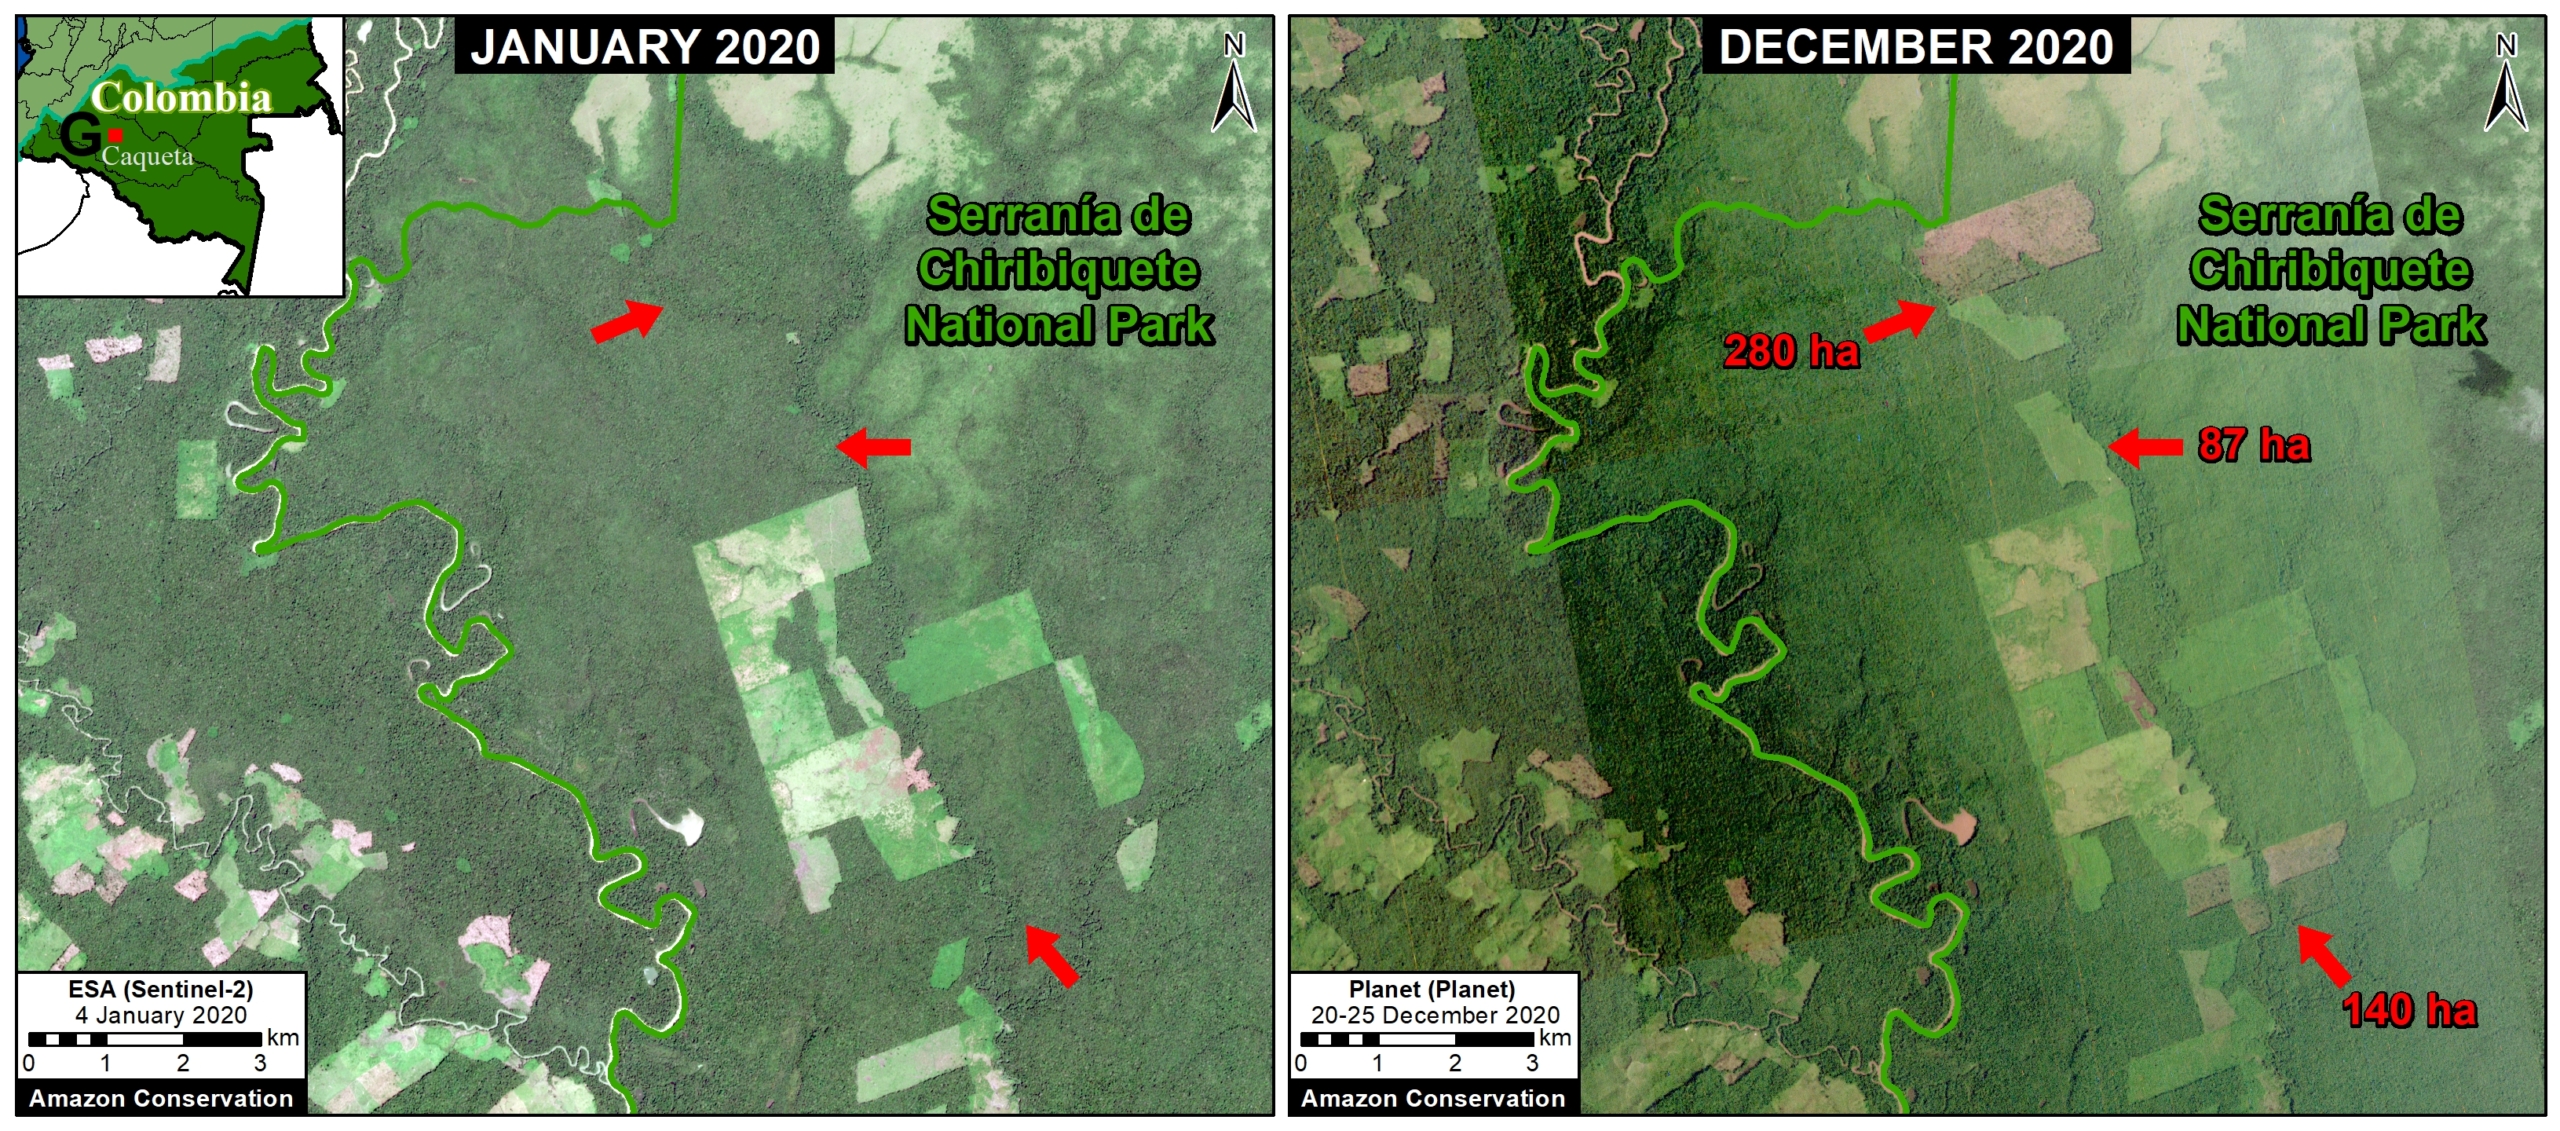
Image E. Deforestation in Colombian Amazon of over 500 hectares in Chiribiqete National Park between January (left panel) and December (right panel) 2020. Data: ESA, Planet.
*Notes and Methodology
To download the report, click “Print” instead of “Download PDF” at the top of the page.
The analysis was based on 30-meter resolution annual data produced by the University of Maryland (Hansen et al 2013), obtained from the “Global Forest Change 2000–2020” data download page. It is also possible to visualize and interact with the data on the main Global Forest Change portal.
Importantly, this data detects and classifies burned areas as forest loss. Nearly all Amazon fires are human-caused. Also, this data does include some forest loss caused by natural forces (landslides, wind storms, etc…).
Note that when comparing 2020 to early years, there are several methodological differences from the University of Maryland introduced to data after 2011. For more details, see “User Notes for Version 1.8 Update.”
It is worth noting that we found the early warning (GLAD) alerts to be a good (and often conservative) indicator of the final annual data.
Our geographic range includes nine countries and consists of a combintion of the Amazon watershed limit (most notably in Bolivia) and Amazon biogeographic limit (most notably in Colombia) as defined by RAISG. See Base Map above for delineation of this hybrid Amazon limit, designed for maximum inclusion. Inclusion of the watershed limit in Bolivia is a recent change incorporated to better include impact to the Amazon dry forests of the Chaco.
We applied a filter to calculate only primary forest loss. For our estimate of primary forest loss, we intersected the forest cover loss data with the additional dataset “primary humid tropical forests” as of 2001 (Turubanova et al 2018). For more details on this part of the methodology, see the Technical Blog from Global Forest Watch (Goldman and Weisse 2019).
To identify the deforestation hotspots, we conducted a kernel density estimate. This type of analysis calculates the magnitude per unit area of a particular phenomenon, in this case forest cover loss. We conducted this analysis using the Kernel Density tool from Spatial Analyst Tool Box of ArcGIS. We used the following parameters:
Search Radius: 15000 layer units (meters)
Kernel Density Function: Quartic kernel function
Cell Size in the map: 200 x 200 meters (4 hectares)
Everything else was left to the default setting.
For the Base Map, we used the following concentration percentages: Medium: 7-10%; High: 11-20%; Very High: >20%.
Hansen, M. C., P. V. Potapov, R. Moore, M. Hancher, S. A. Turubanova, A. Tyukavina, D. Thau, S. V. Stehman, S. J. Goetz, T. R. Loveland, A. Kommareddy, A. Egorov, L. Chini, C. O. Justice, and J. R. G. Townshend. 2013. “High-Resolution Global Maps of 21st-Century Forest Cover Change.” Science 342 (15 November): 850–53.
Acknowledgements
We thank E. Ortiz (AAF), M. Silman (WFU), M. Weisse (WRI/GFW) for their helpful comments on this report.
This work was supported by NORAD (Norwegian Agency for Development Cooperation) and ICFC (International Conservation Fund of Canada).

Citation
Finer M, Mamani N (2020) Amazon Deforestation Hotspots 2020 (Final). MAAP: 136.
Download PDF of this article