MAAP #144: The Amazon & Climate Change: Carbon Sink vs Carbon Source
August 30, 2021
A pair of recent scientific studies revealed that parts of the Amazon now emit more carbon into the atmosphere than they absorb (Gatti et al 2021, Harris et al 2021).
Here, we dig deeper and highlight the key finding: the Brazilian Amazon has become a net carbon source over the past 20 years, whereas the total Amazon is still a net carbon sink.
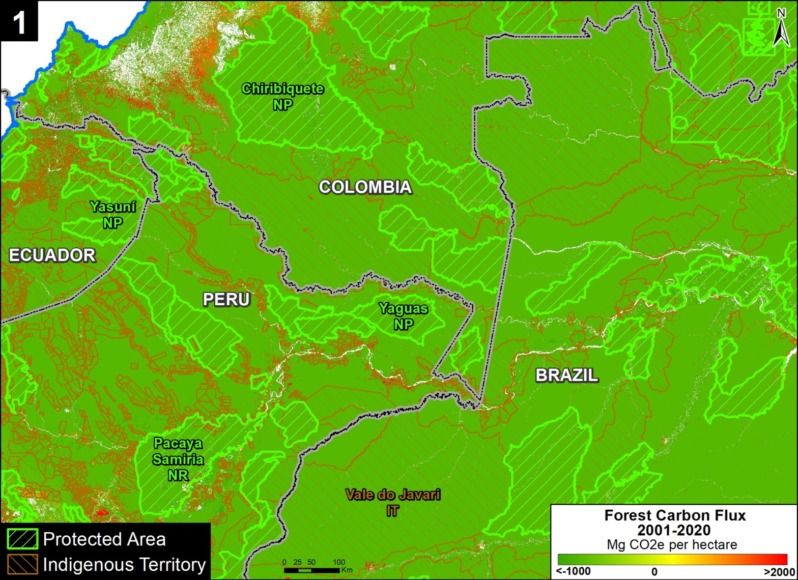
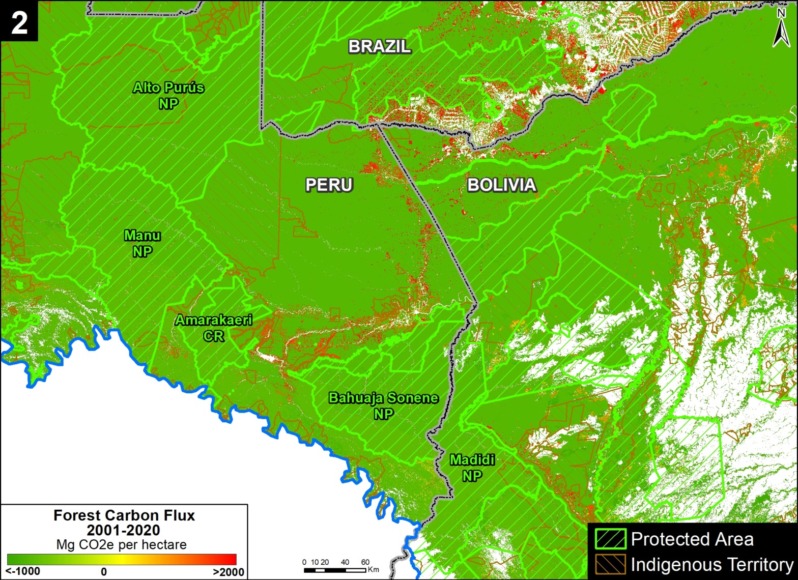
We also show that protected areas and indigenous territories are crucial carbon sinks, showing once again their importance and effectiveness for overall conservation across the Amazon (MAAP #141).
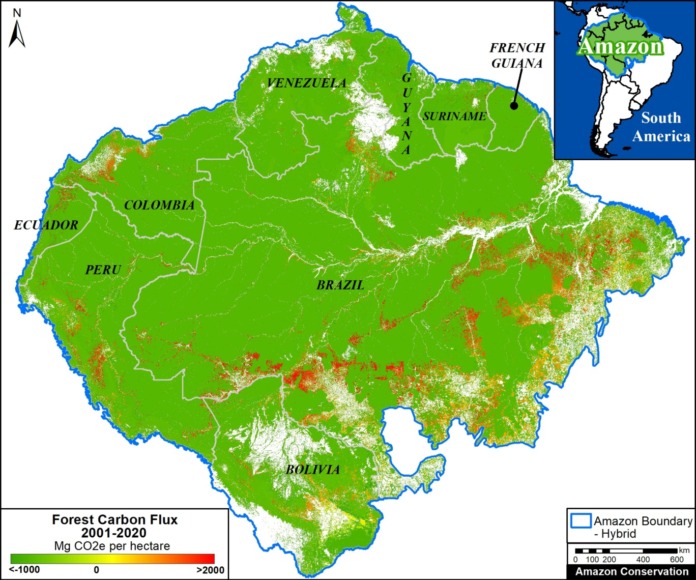
One of the noted studies (Harris et al 2021) presented a new global monitoring system for forest carbon flux based on satellite data.
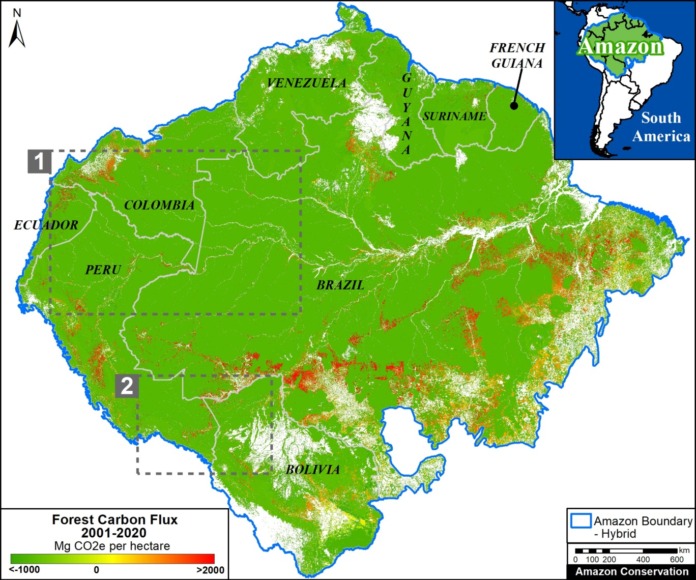
Here, we independently analyze this data with a focus on the Amazon.*
The flux is the crucial difference between forest carbon emissions (such as deforestation) and removals from the atmosphere (such as intact forests and regrowth).
A negative flux indicates that removals exceed emissions and the area is a carbon sink, thus buffering climate change. The Base Map illustrates these sinks in green.
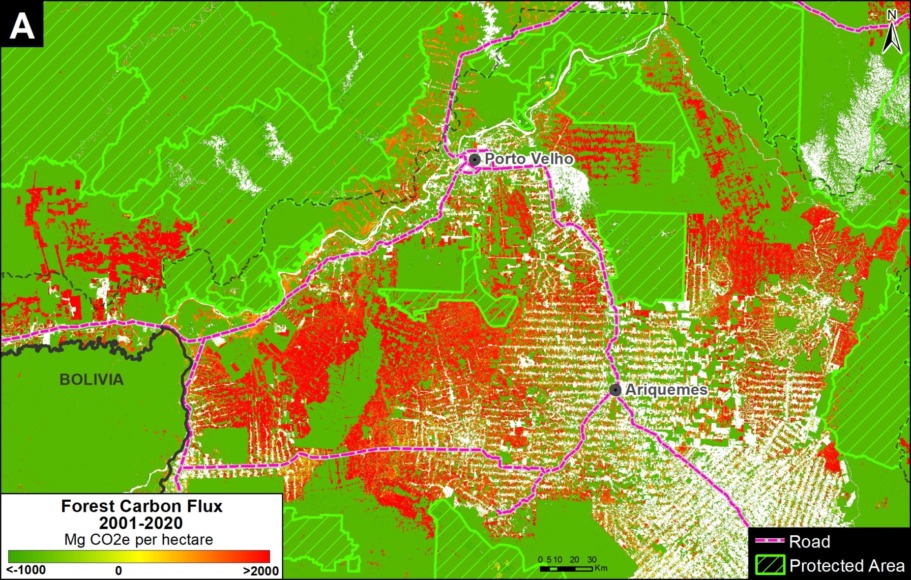
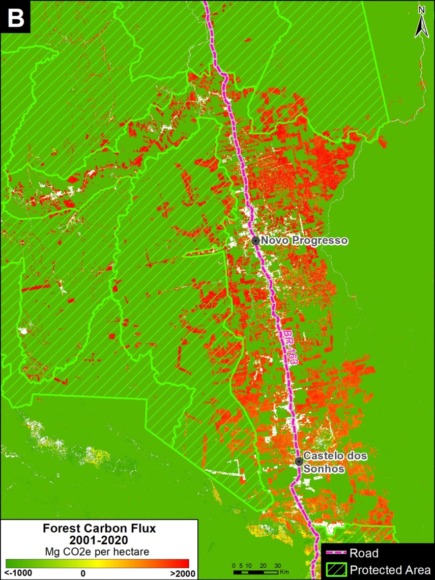
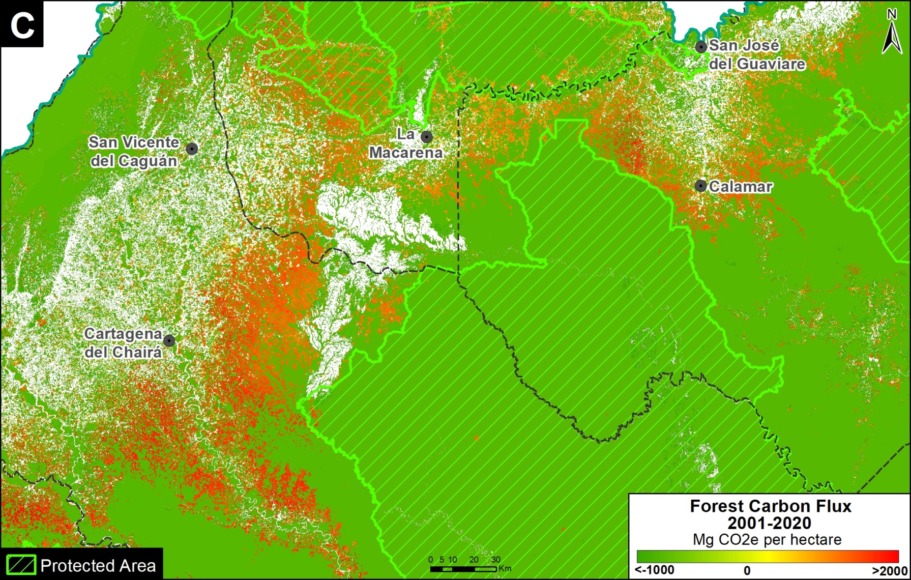
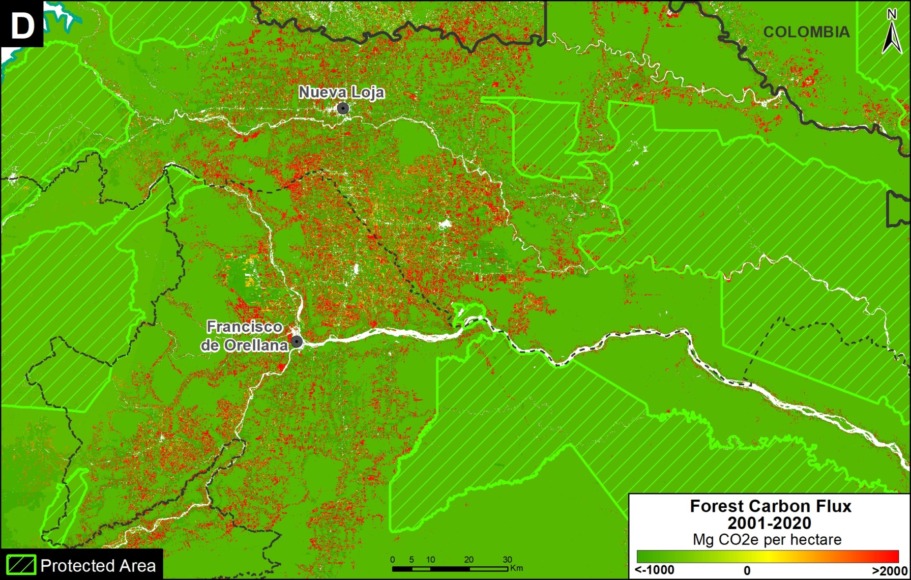
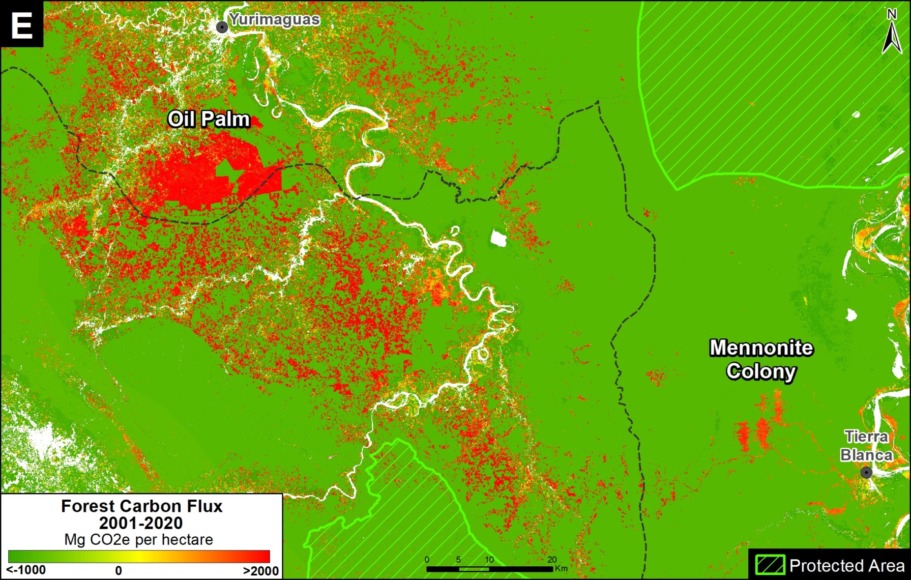
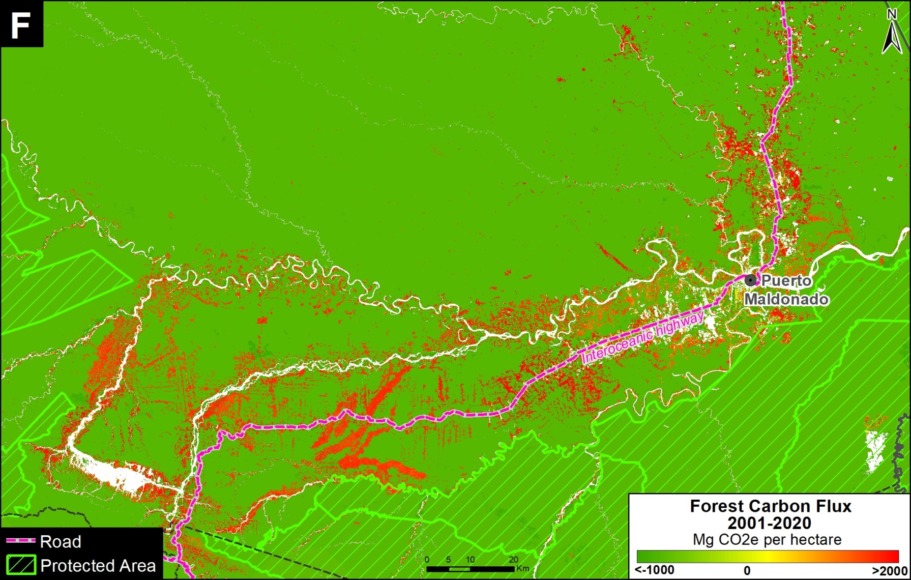
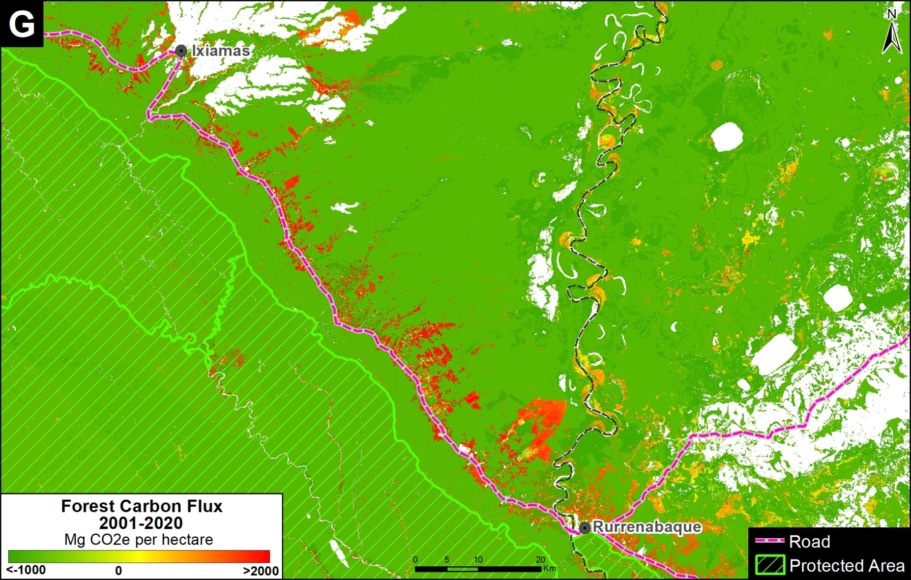
A positive flux indicates that emissions exceed removals and the area has become a carbon source, thus exacerbating climate change. The Base Map illustrates these sources in red.
Below, we illustrate the carbon flux results and then zoom in on some of the key carbon sinks (such as protected areas and indigenous territories) and carbon sources (high deforestation areas) across the Amazon.
Amazon Carbon Flux
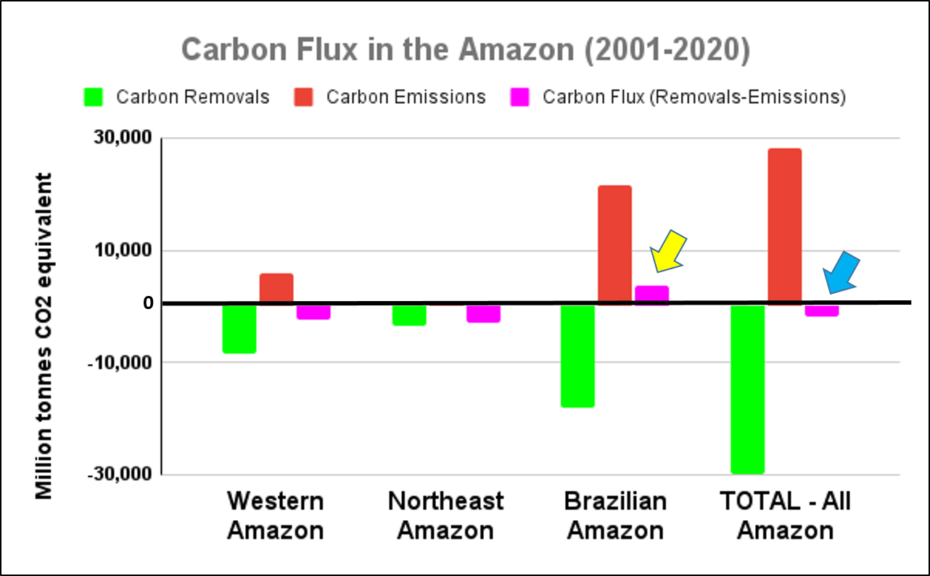
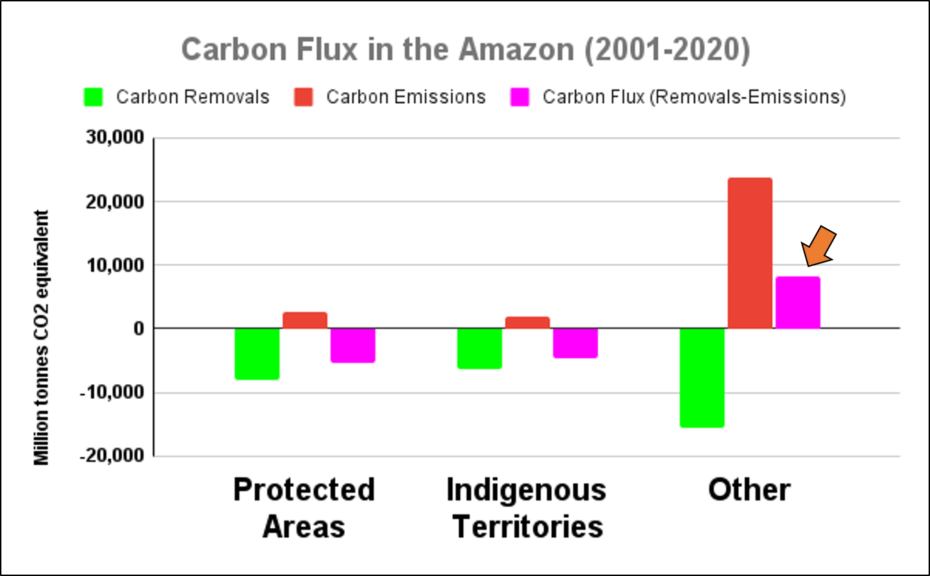
The two graphs below show levels of carbon removals in green and carbon emissions in red across the western Amazon (Bolivia, Colombia, Ecuador, and Peru), northeastern Amazon (French Guiana, Guyana, Suriname, and Venezuela), Brazilian Amazon, and total Amazon. The resulting carbon flux is highlighted in pink.
The arrows highlight three critical results:
- The Brazilian Amazon has become a net carbon source (positive flux indicated by yellow arrow in Graph 1). That is, emissions now exceed removals (3,600 million tonnes of carbon dioxide equivalent over the past 20 years), exacerbating climate change.
l - The total Amazon is still a net carbon sink (negative flux indicated by blue arrow in Graph 1). That is, removals still exceed emissions (-1,700 million tonnes of carbon dioxide equivalent over the past 20 years), helping mitigate climate change, mainly thanks to the role of the western and northeastern Amazon.
j - Protected areas and indigenous territories are effective carbon sinks, while other areas outside these key designations are the major carbon source (positive flux indicated by orange arrow in Graph 2).
Key Amazon Carbon Sinks: Protected Areas & Indigenous Territories
Zooms 1 and 2 show two major carbon sinks in the western Amazon.
Zoom 1 focuses in on the northwestern Amazon, stretching across four countries (Brazil, Peru, Colombia, and Ecuador). This region includes large protected areas (such as Yasuni National Park in Ecuador, Chiribiquete National Park in Colombia, and Yaguas National Park in Peru) and indigenous territories (such as Vale do Javari in Brazil).
Zoom 2 focuses in on the southwestern Amazon, stretching across three countries (Brazil, Peru, and Bolivia). This region also includes large protected areas (such as Alto Purus, Manu, and Bahuaja Sonene National Parks in Peru and Madidi National Park in Bolivia).
Key Amazon Carbon Sources: High Deforestation Areas
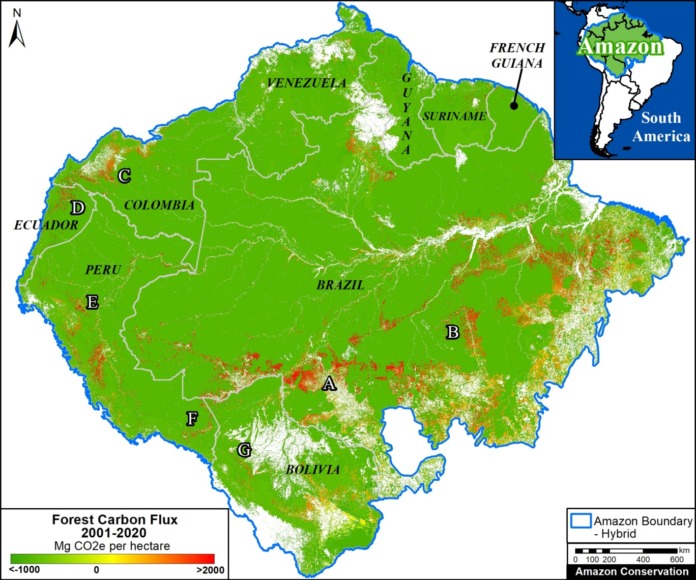
Zooms A-H show eight major carbon sources in the western Amazon.
Zooms A and B show two of the major deforestation fronts in the Brazilian Amazon. Zoom A shows the massive deforestation around the city of Porto Velho, in the state of Rondônia and near the border with the state of Amazonas. Zoom B shows the massive deforestation along the BR-163 highway in the state of Pará.
Moving to the western Amazon, Zoom C shows the arc of deforestation in the northwestern Colombian Amazon and Zoom D shows the major deforestation front in the northern Ecuadorian Amazon.
Zooms E and F show two of the major deforestation fronts in the Peruvian Amazon. Zoom E shows large-scale deforestation from oil palm plantations and a new Mennonite colony in the north. Zoom F shows the major deforestation front in the south, along the Interoceanic Highway, surrounded by gold mining and small-scale agriculture.
Finally, Zoom G shows the deforestation along the road connecting Rurrenabaque and Ixiamas, including the new large-scale sugar cane plantation.
*Methodology & Notes
Base Map, Figure 1, and Zoom maps are based on 30-meter, satellite-based data obtained from Harris et al (2021). Our geographic range included nine countries and consists of a combination of the Amazon biogeographic limit (as defined by RAISG) plus the Amazon watershed limit in Bolivia. See Base Map above for delineation of this hybrid Amazon limit, designed for maximum inclusion.
References
Gatti, LV et al (2021) Amazonia as a carbon source linked to deforestation and climate change. Nature 595, 388–393.
Harris NL et al (2021) Global maps of twenty-first century forest carbon fluxes. Nature Climate Change 11, 234-240.
Acknowledgements
We thank M. Silman (Wake Forest University), D. Gibbs (WRI), M.E. Gutierrez (ACCA), D. Larrea (ACEAA), J. Beavers (ACA), and A. Folhadella (ACA) for their helpful comments on this report.
This work was supported by the Norwegian Agency for Development Cooperation (NORAD), and International Conservation Fund of Canada (ICFC).

Citation
Finer M, Mamani N (2021) The Amazon & Climate Change: Carbon Sink vs Carbon Source. MAAP: 144.
