MAAP #66: Satellite Images of Belo Monte Dam Project (Brazil)
August 29, 2017
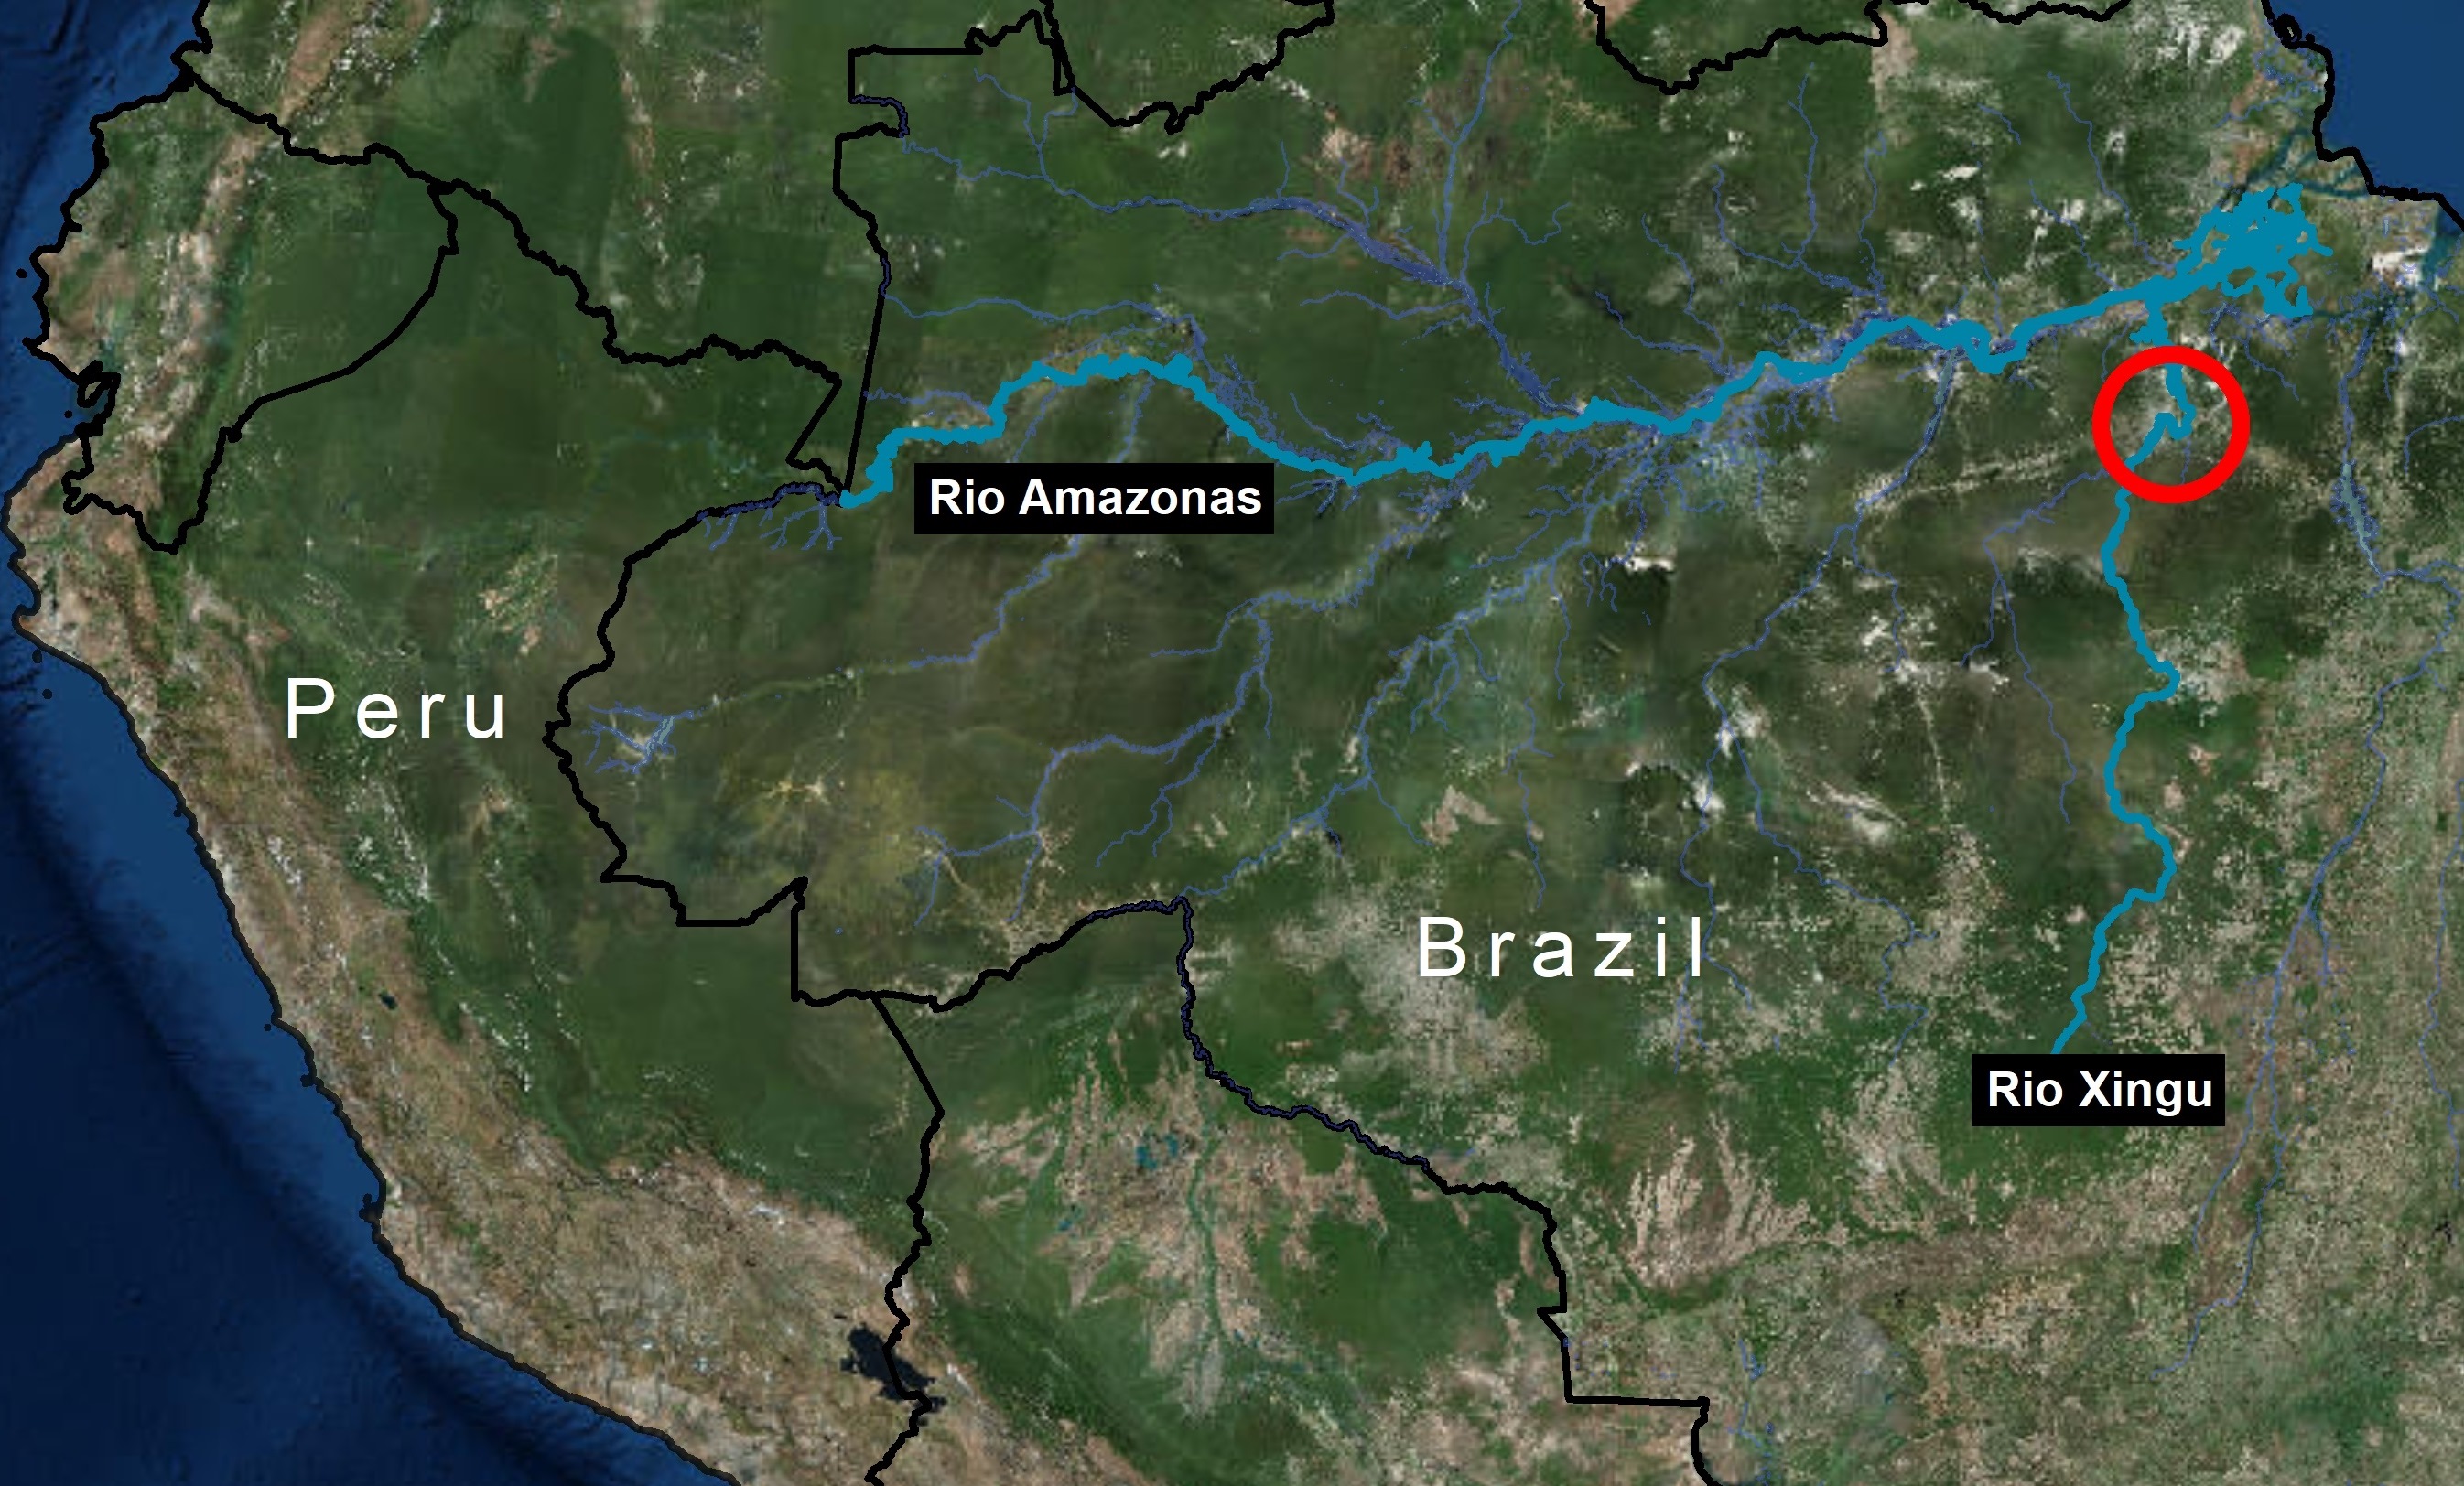
The Belo Monte hydroelectric dam complex, located on the Xingu River in the state of Para in the eastern Brazilian Amazon (see Image 66a), has been controversial since its inception over 15 years ago, due to both environmental and social concerns related to building and operating one of the largest dams in the world in a sensitive environment.
The dam has recently become operational, providing an opportunity to evaluate initial impacts.
The objective of this article is to present satellite imagery, including a time series from 2011 to 2017, that provides insight into major ecological impacts of the hydroelectric dam project.
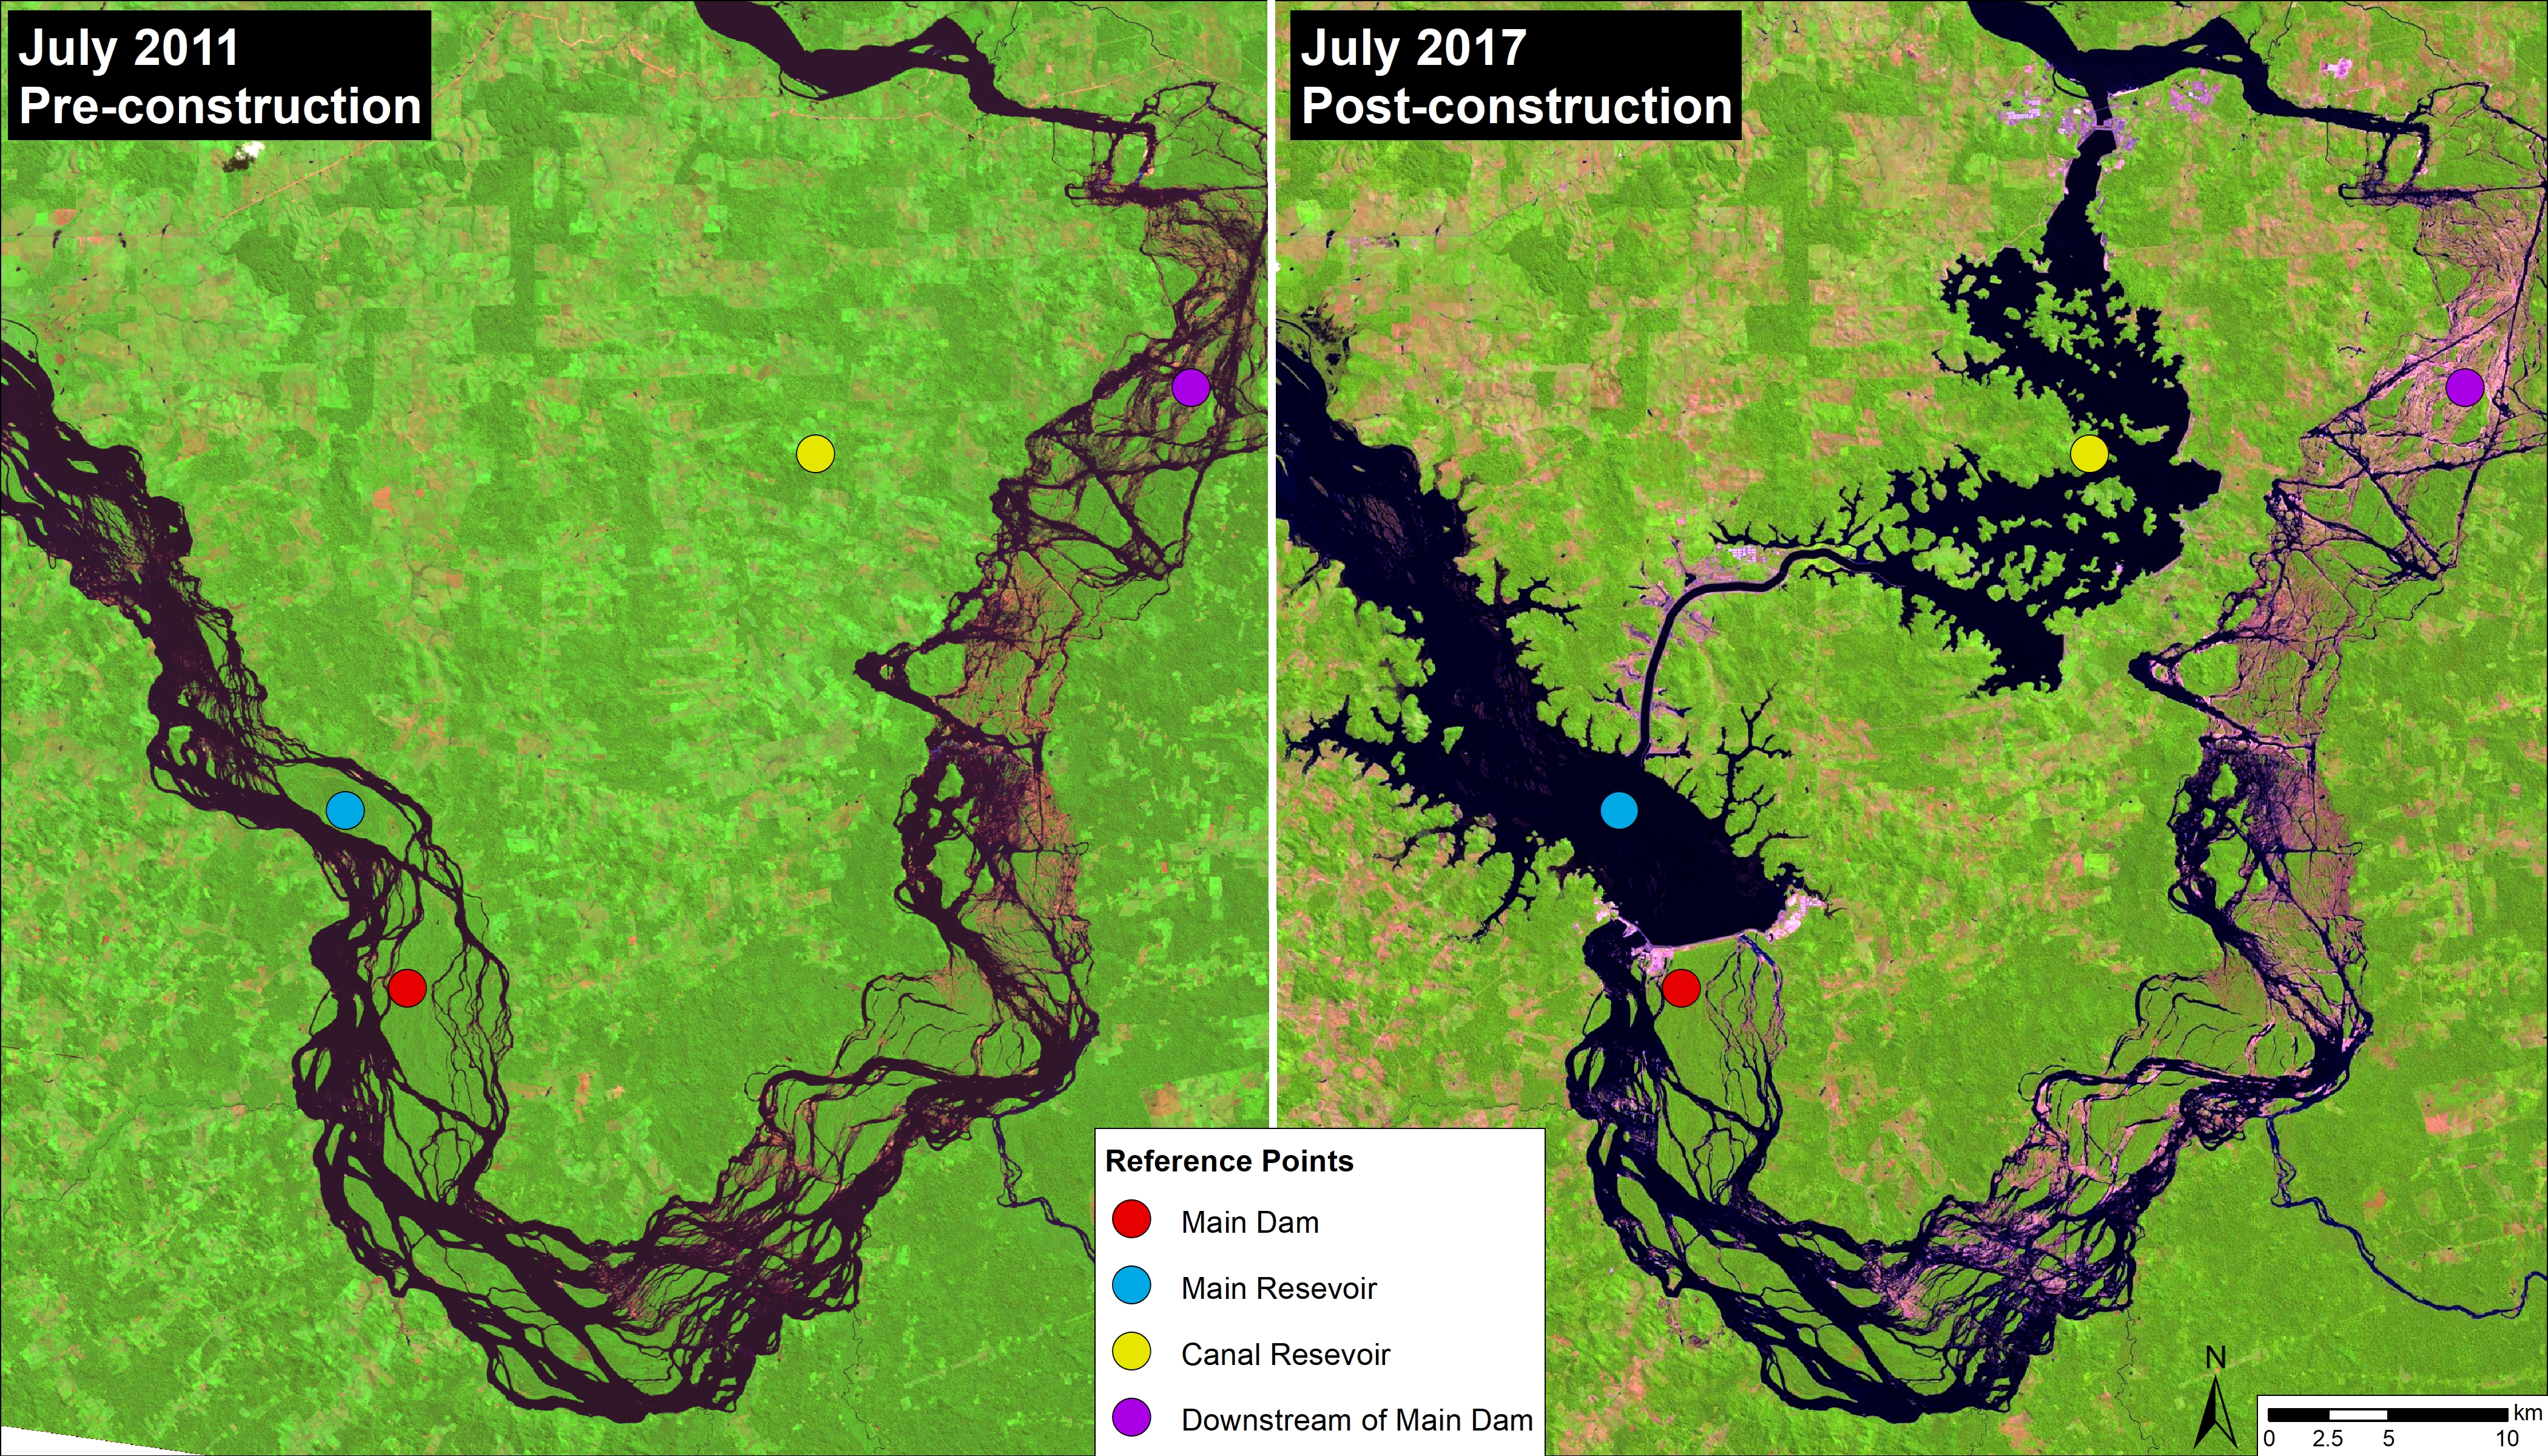
Despite legal challenges and strong opposition from impacted indigenous groups, construction of Belo Monte began in 2011 and the first turbines became operational in early 2017. Image 66b shows a direct comparison of before (left panel, July 2011) and after (right panel, July 2017) dam construction.
The dam is in fact a complex: the main dam (red circle) on the Xingu River creates a main reservoir (blue circle); a canal diverts much (up to 80%) of the river’s flow from the main reservoir to the canal reservoir (yellow circle), which feeds the turbines generating the electricity. As a result, downstream of the main dam is left with a much reduced flow (20%) for a stretch of 100 km. This reduced flow stretch, known as the Xingu River’s “Big Bend,” is home to two indigenous peoples (Arara and Juruna). The reference points in the images show these four areas of the complex across time, including before construction.
Satellite Image Time Series
Image 66c is a GIF showing a satellite (Landsat) imagery time series of the project impact area from July 2011 through May 2017. July 2011 serves as the pre-project baseline before the start of construction. By July 2015, construction of the main dam and canal is well under way. By January 2016, the main dam has closed, forming both the main and canal reservoirs. August 2016 provides a nearly cloudless view of the dam complex, including how dry the downstream section becomes. July 2017 represents the most recent cloud-free Landsat image.
In the most recent images, note the negative impact on local fisheries: flooding of river islands, rock outcrops, and seasonally flooded forests in the Main Reservoir that were important fish habitat; and reduced water flow along the “Big Bend” below the Main Dam, also important fish habitat.
Flooding Estimate
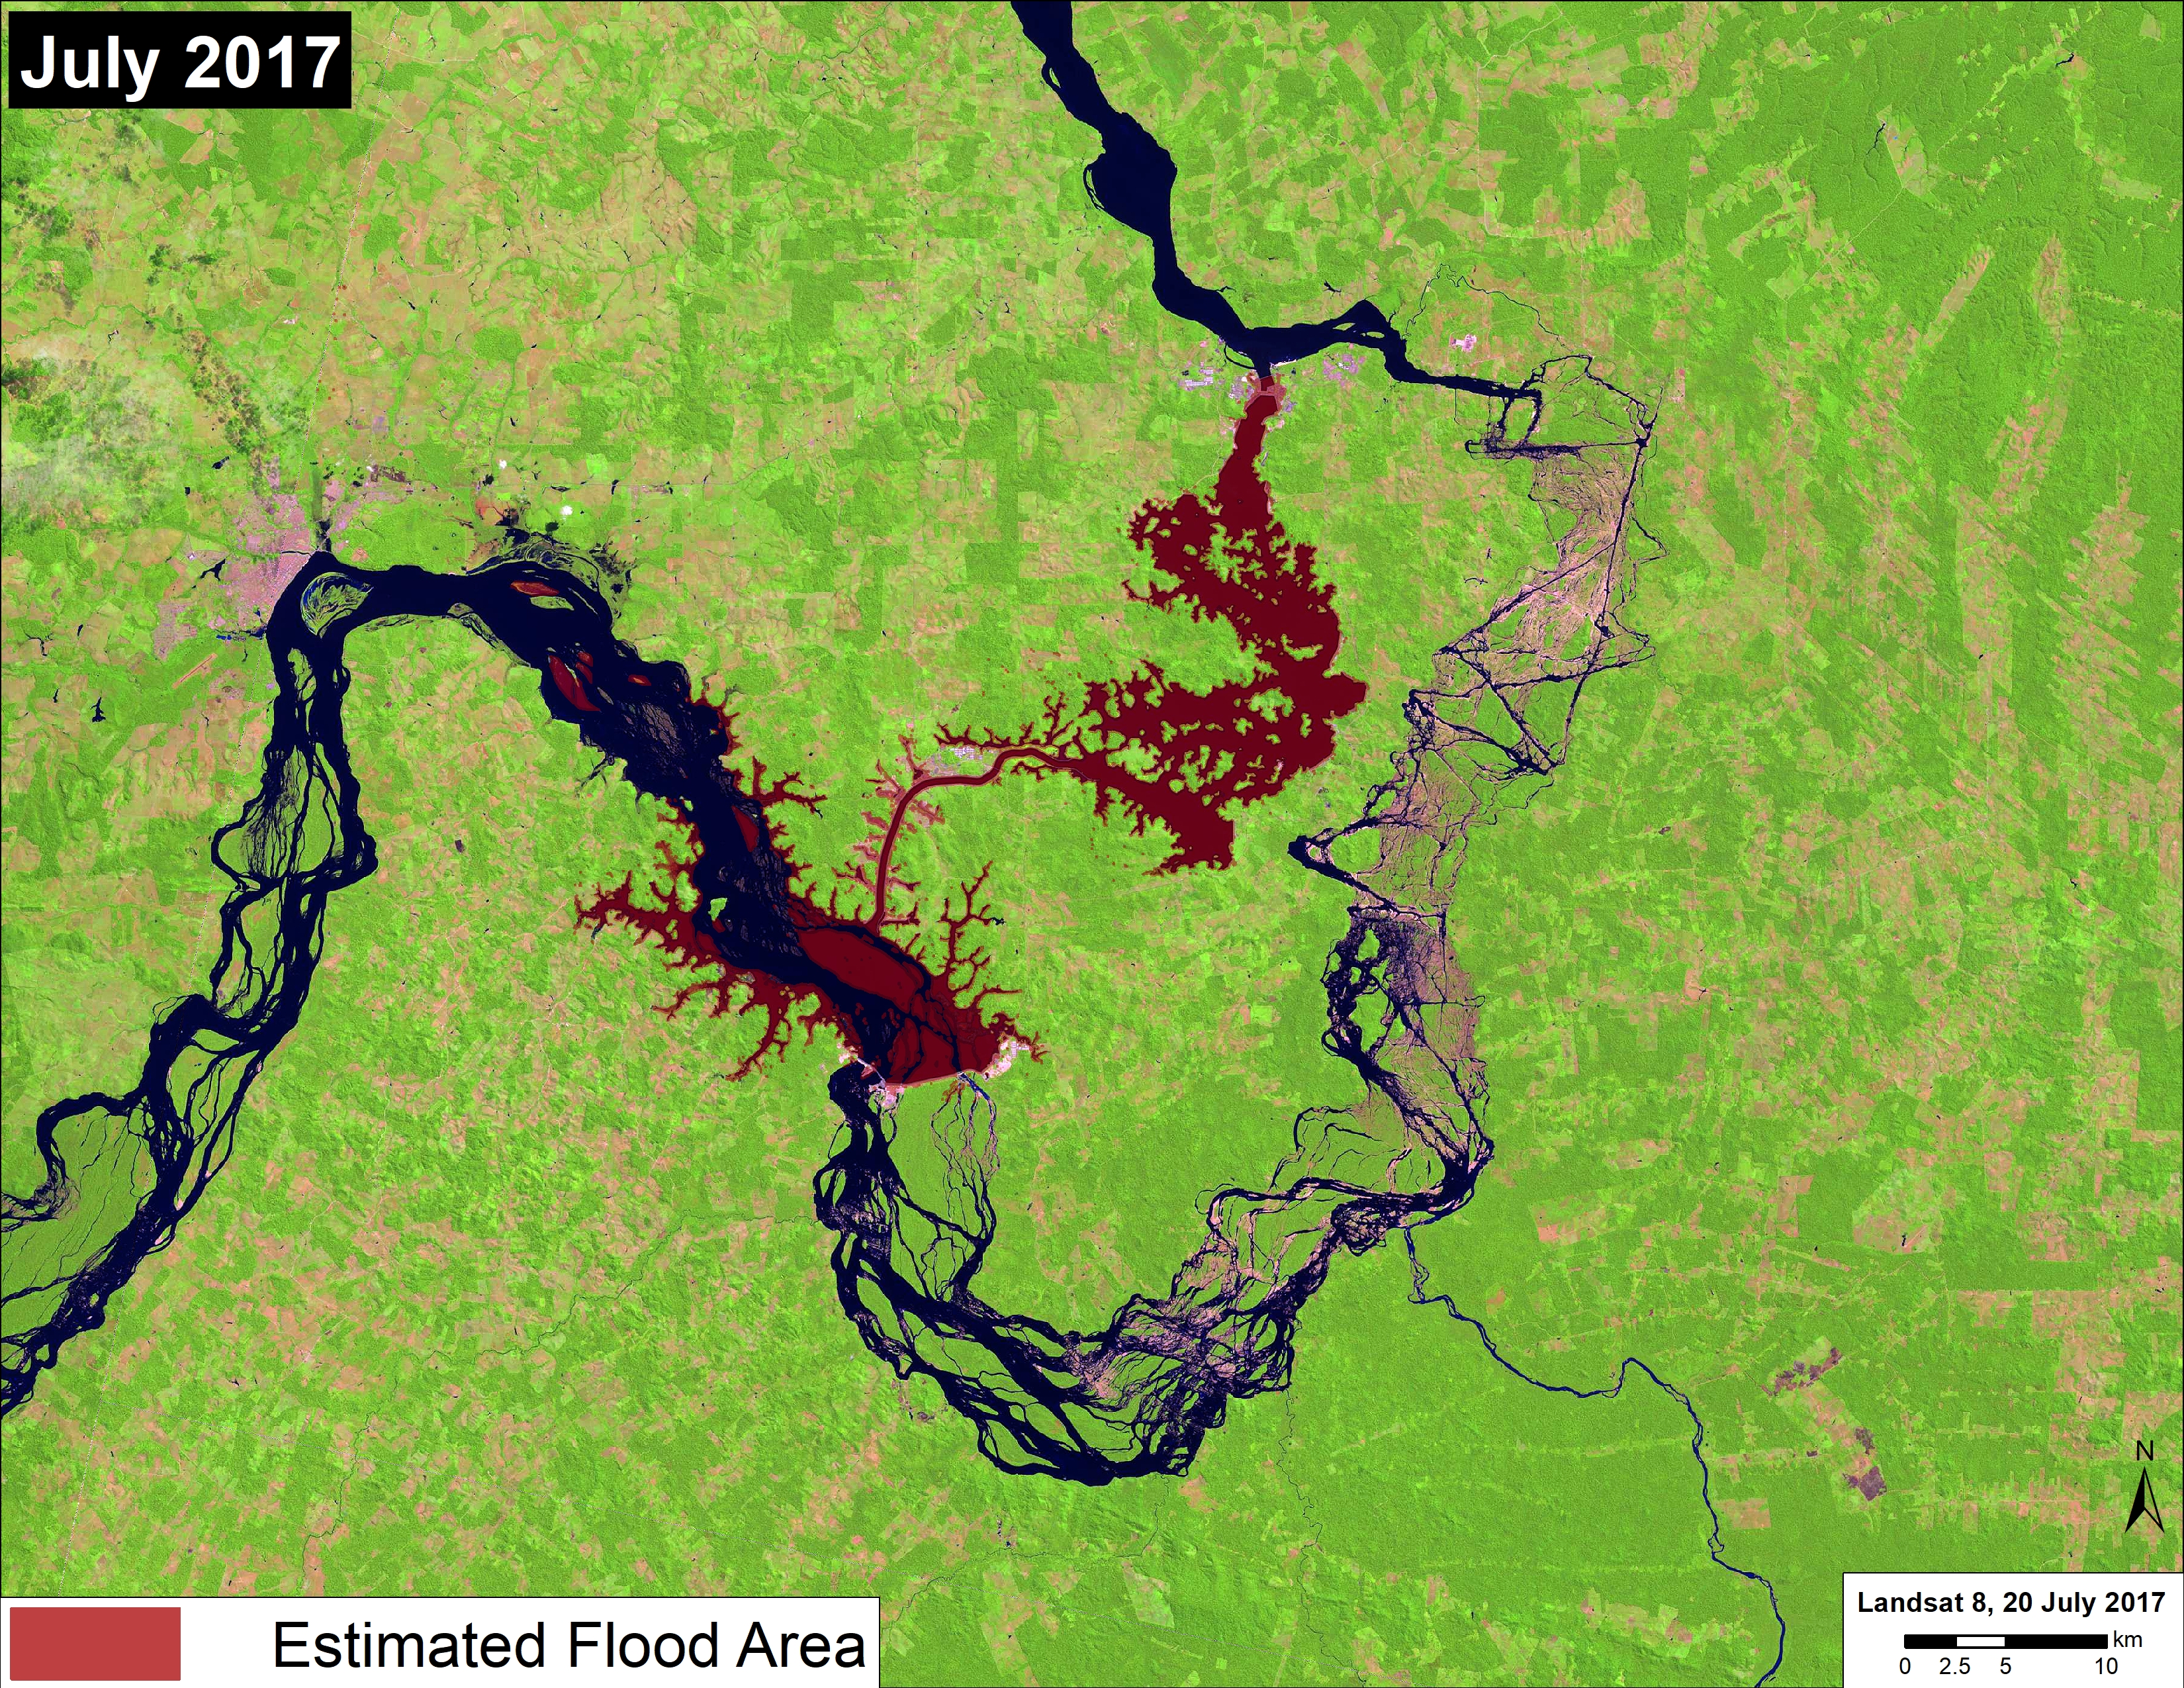
Based on an analysis of the Landsat images, we estimate the flooding of 48,960 acres (19,880 hectares) of land that, according to the imagery, appeared to be a mix of forest and agriculture (Image 66d). In other words, some of the flooded area was previously degraded.
Damming of the Xingu River
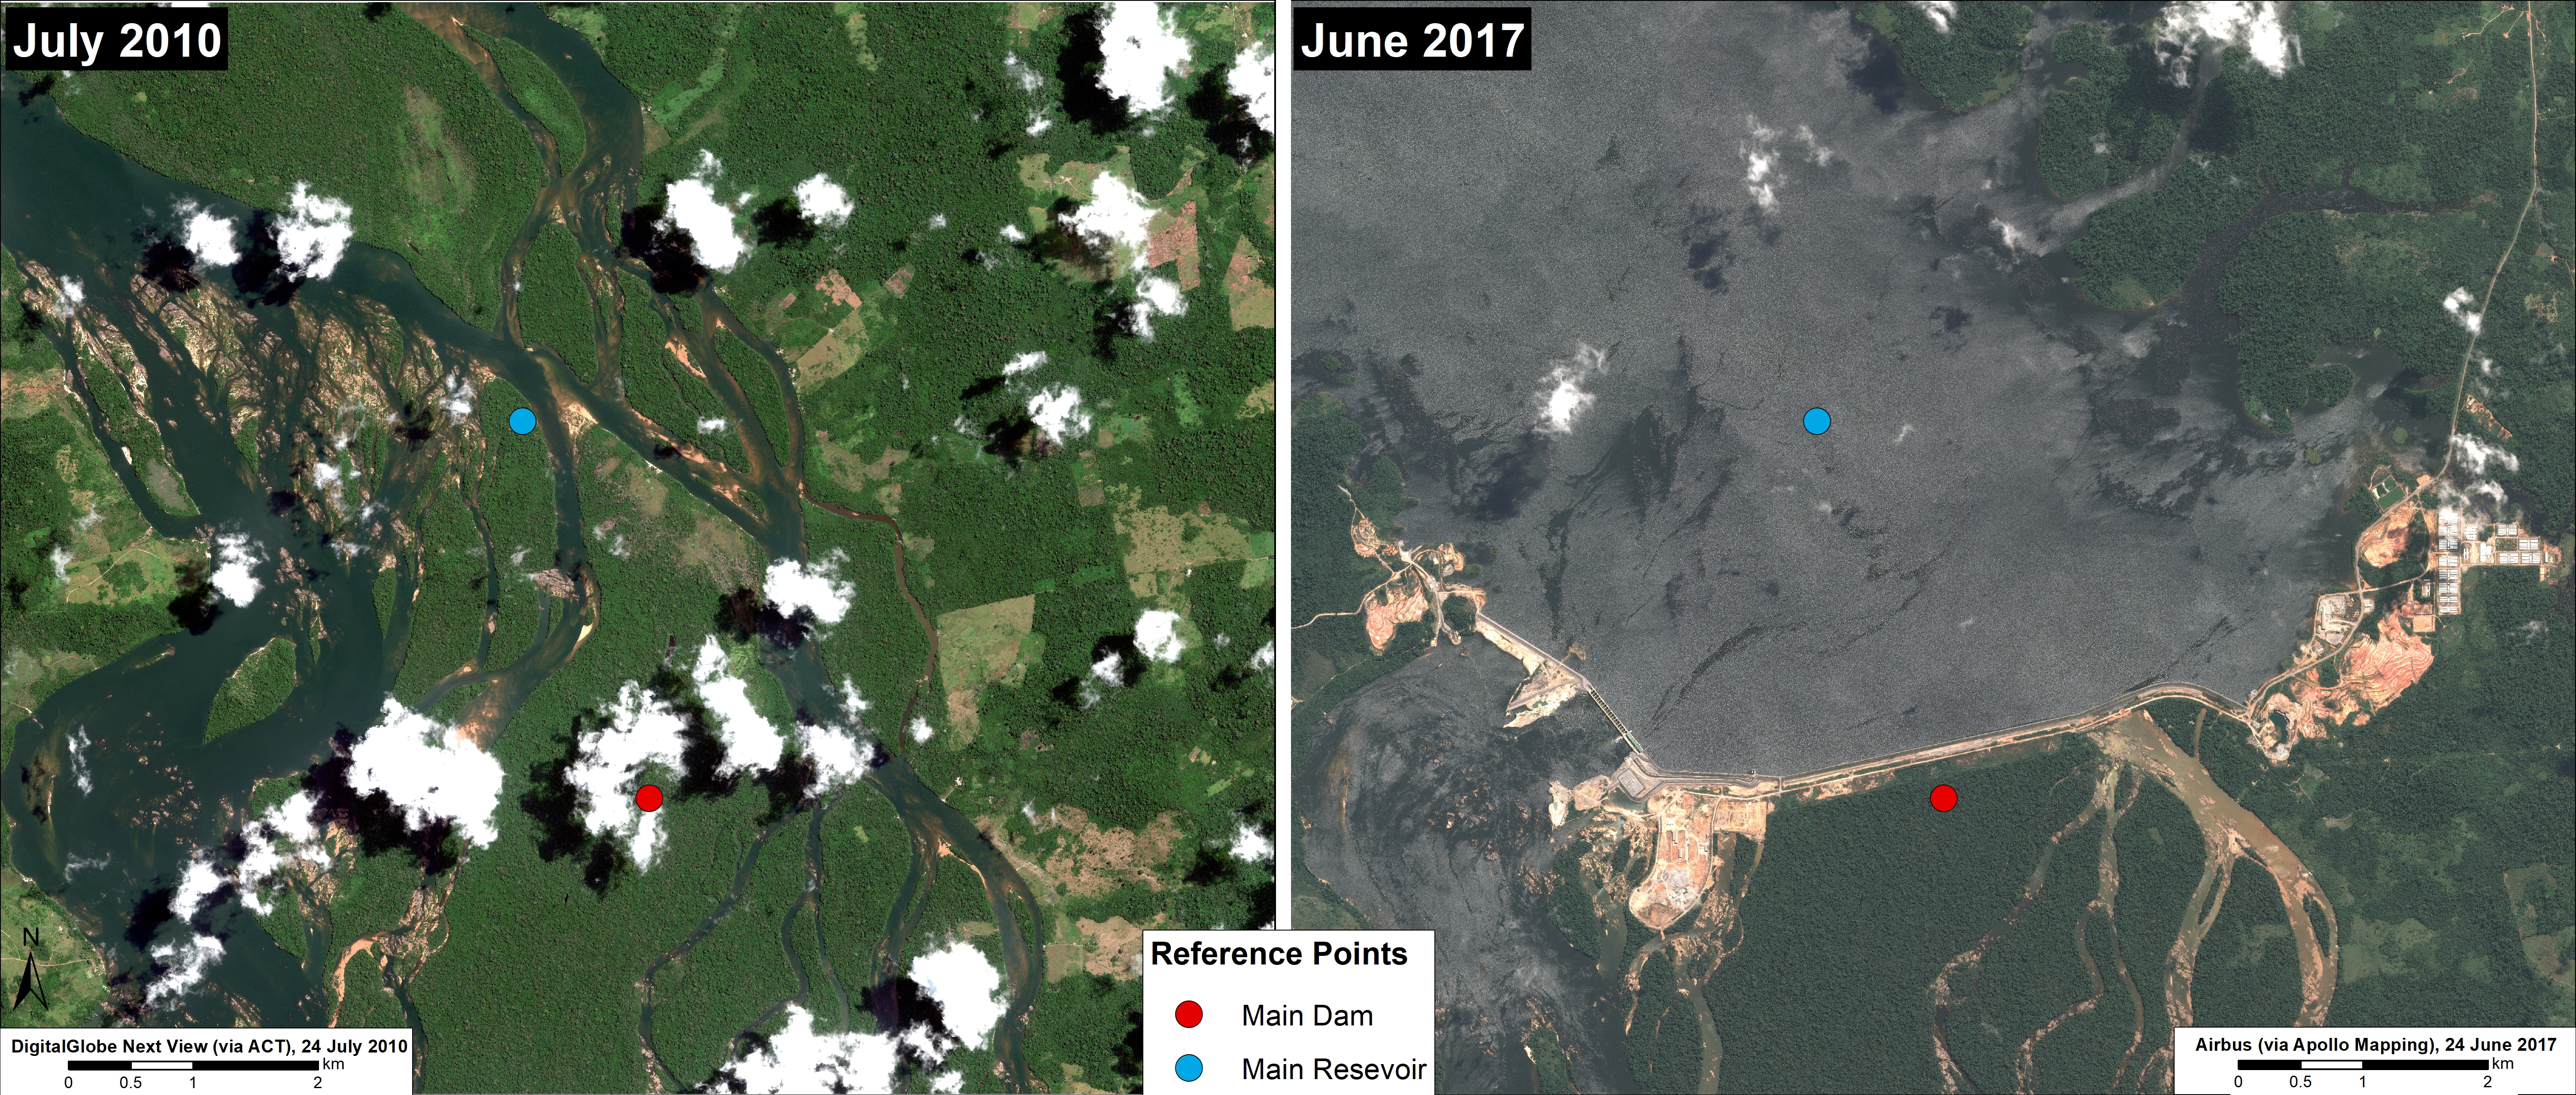
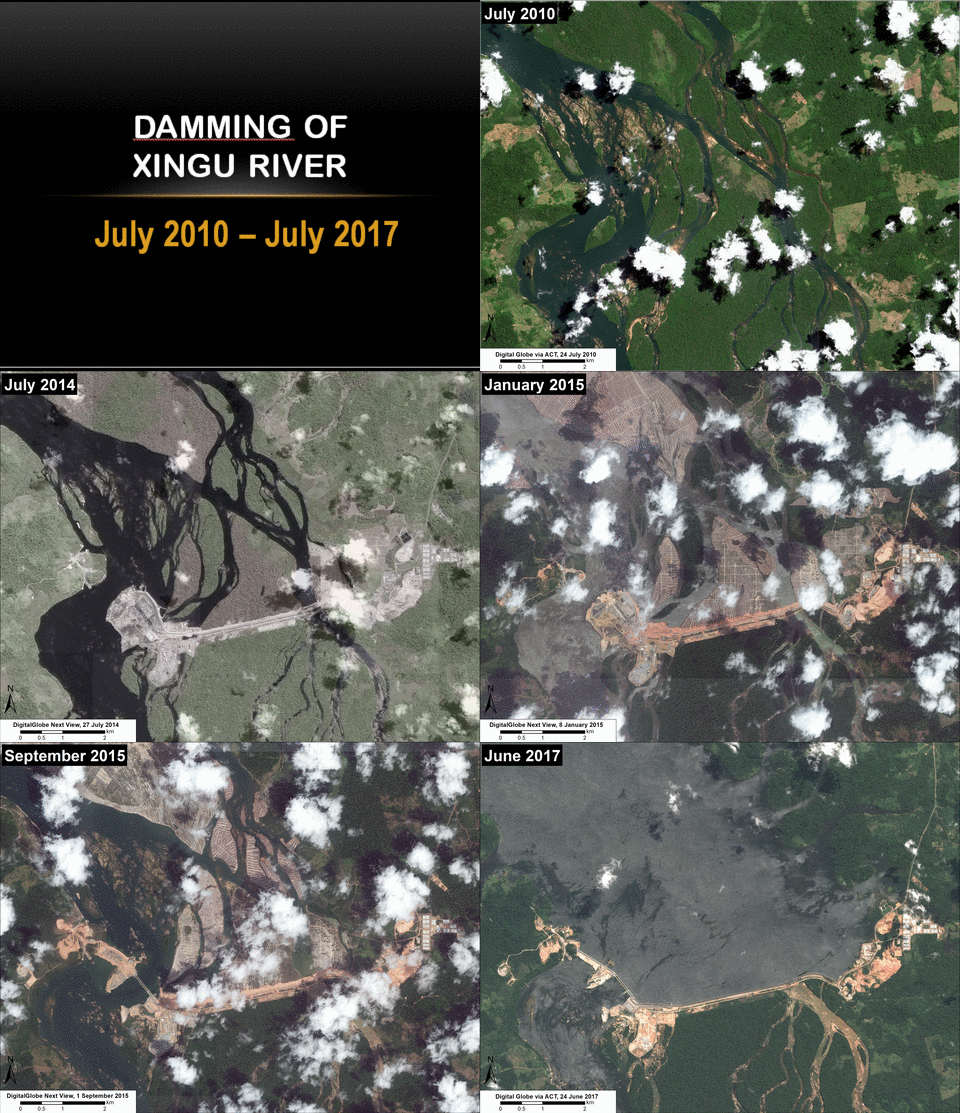
Image 66e shows, in high resolution (50 cm), the drastic change at the dam site between July 2010 (left panel) and June 2017 (right panel). The July 2010 image, which serves as the pre-construction baseline, shows the free-flowing Xingu River, whereas the June 2017 image shows the impact of the main dam and main reservoir. Image 66f is a GIF showing, in striking detail, the construction of the main dam and formation of the main reservoir between 2010 and 2017.
We thank International Rivers and Amazon Watch for reviewing earlier drafts of this article and providing crucial comments.
Finer M, Olexy T, Scott A (2017) Satellite Images of Controversial Belo Monte Dam Project. MAAP: 66.
