MAAP #90: Using Drones to monitor Deforestation and Illegal Logging

Drone types: helipcopter and fixed-wing (plane)

For the past three years, the organization Amazon Conservation has been working to establish a sustainable, local-based drones program for environmental monitoring in the southern Peruvian Amazon (Madre de Dios region).

This program is based on two types of drones, multi-rotor (helicopter style) and fixed-wing (airplane style).

One of the main objectives is to improve the near real-time monitoring of deforestation and illegal logging.

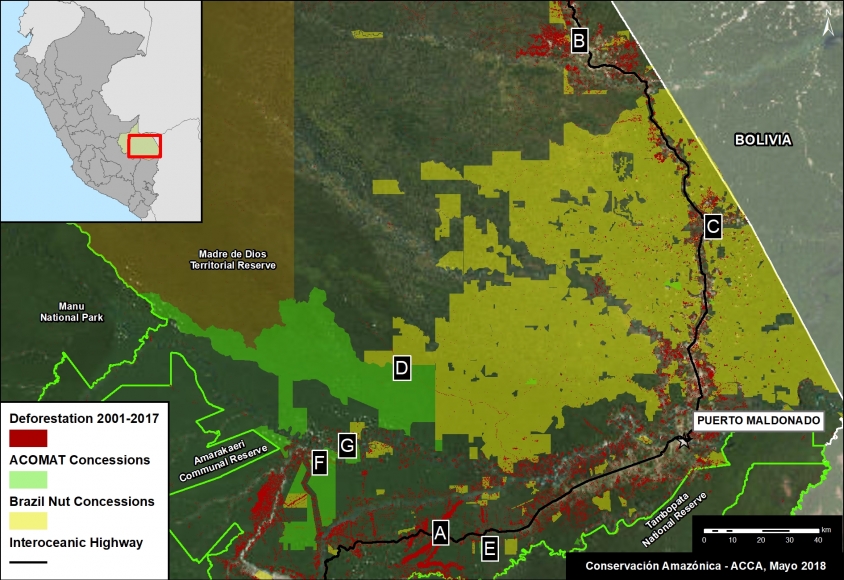
The monitoring is currently focused on three priority areas: 1) Brazil nut concessions, 2) forestry concessions of the local association ACOMAT, and 3) along the Interoceanic Highway (see Base Map).

Below, we show a series of drone images that we have used to identify the drivers of recent deforestation events. These drivers include gold mining, agriculture, illegal logging, cattle pasture, and natural forest loss.

Base Map. Priority areas of the Amazon Conservation drones initiative.

Interoceanic Highway

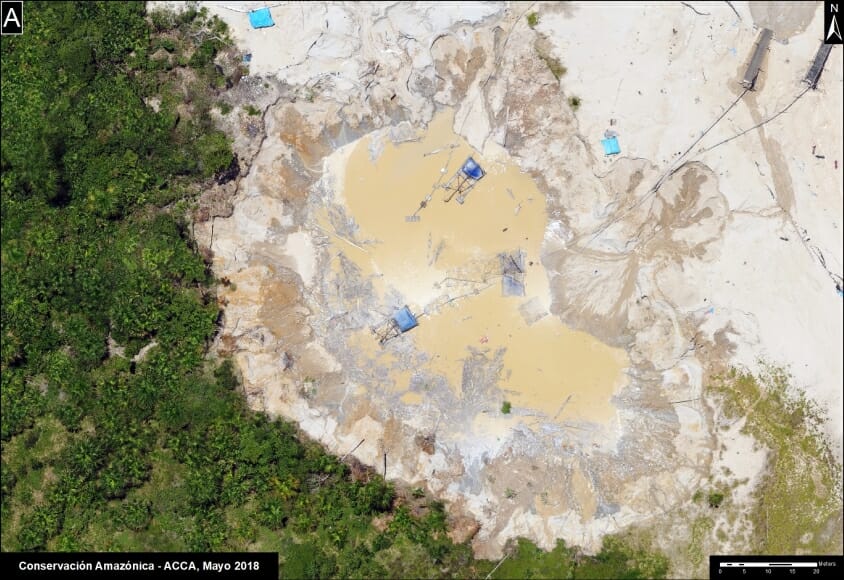
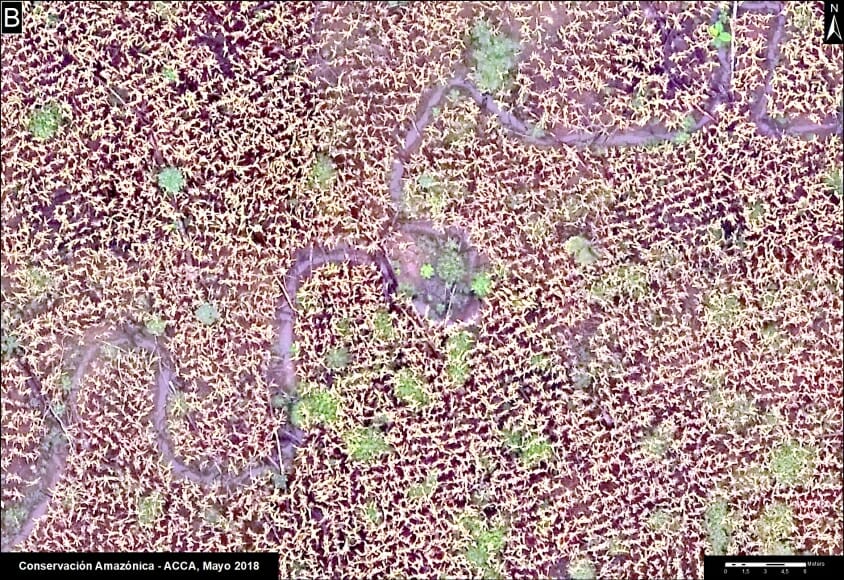
In March 2018, in collaboration with the organization ProPurús, we realized drone flights along the Interoceanic Highway in an effort to demonstrate the possible threats of building a new road along the border with Brazil (see MAAP #76). The following images show the two main threats to the area: gold mining and small/medium-scale agriculture (<50 hectares).

A. Drone image: gold mining.
B. Drone image: Deforestation from agriculture (corn)

Brazil Nut Concessions

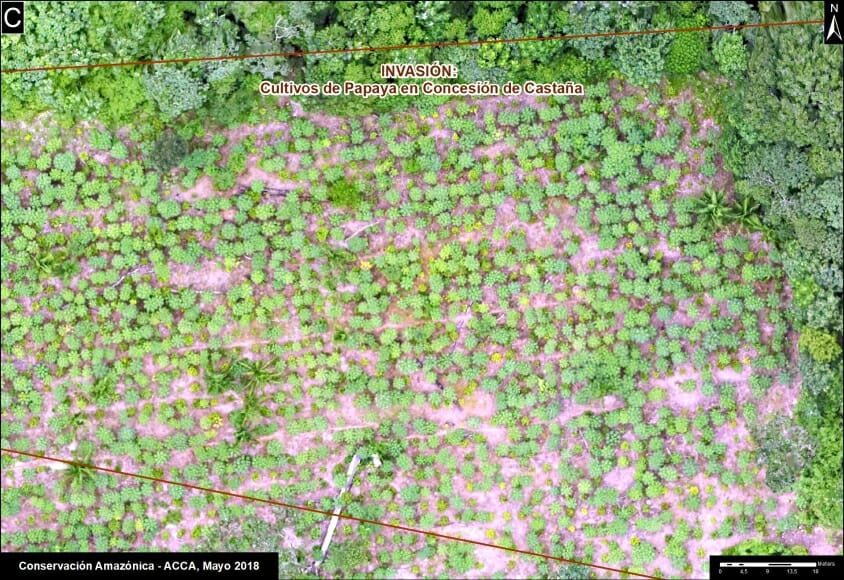
In 2018, Amazon Conservation launched a new project, funded by Google Challenge, to develop a monitoring program for Brazil nut concessions covering a million hectares (2.47 million acres) in southern Peru. For example, the following image shows the invasion of a papaya plantation that caused the recent deforestation of five acres inside a concession.

C. Drone image: Invasión of papaya in Brazil nut concession.

ACOMAT Forestry Concessions

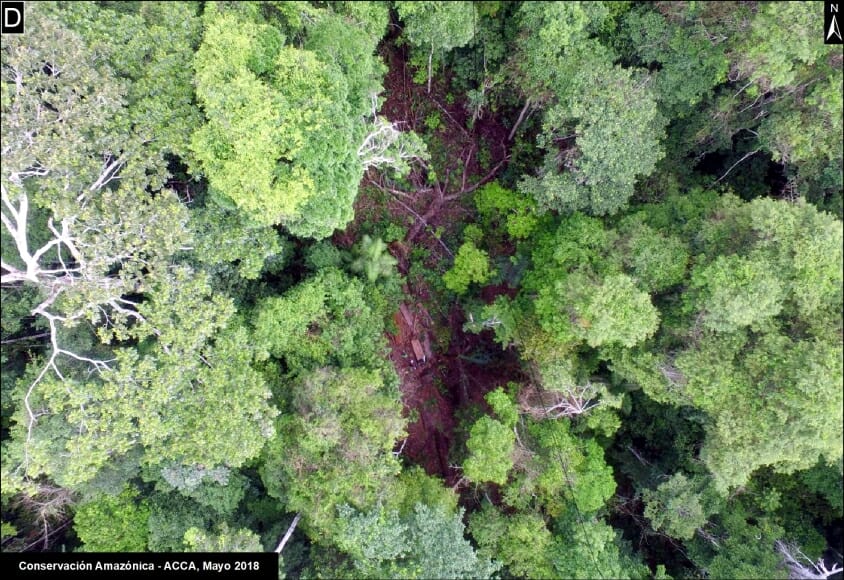
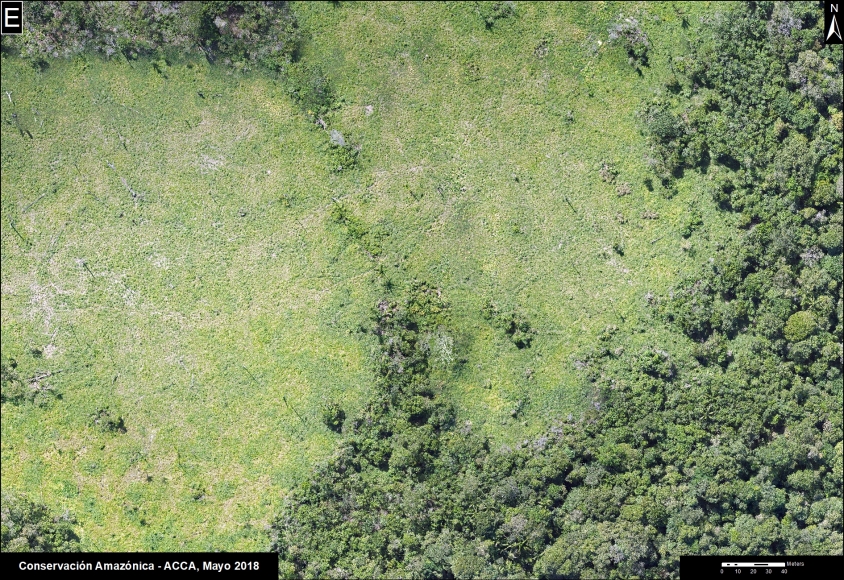
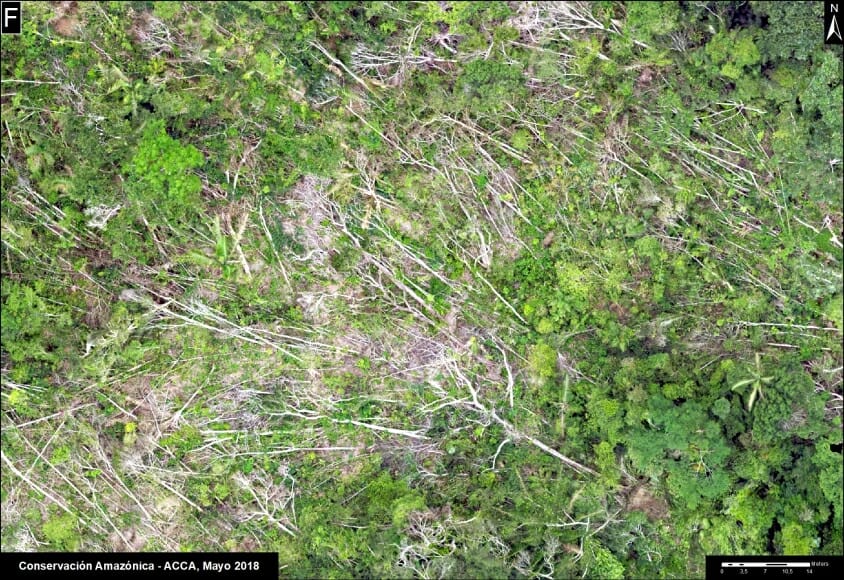
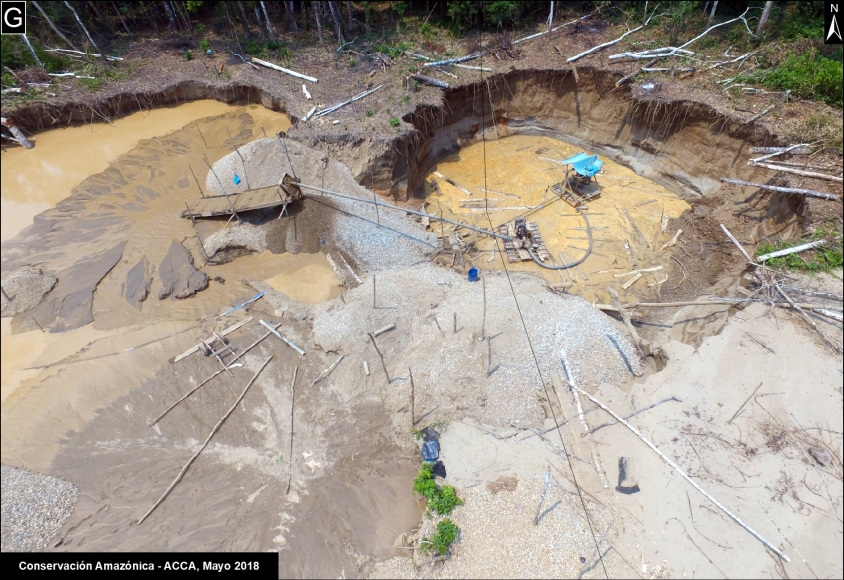
Since 2017, Amazon Conservation has been working on a project, financed by the Norwegian Agency for Development Cooperation (NORAD), to improve the monitoring of forest concessions of the local association ACOMAT (Association of Timber and Non-Timber Forest Concessionaires of the Provinces from Manu and Tambopata). The following images show examples of forest loss and degradation due to illegal logging, cattle grazing, natural loss (windstorm), and gold mining.

D. Drone image: illegal logging.
E. Drone image: cattle pasture.
F. Drone image: natural forest loss from windstorm.
G. Drone image: gold mining.

Citation

Garcia R, Novoa S, Castañeda C, Rengifo P, Jimenez M, Finer M (2018) Using Drones to monitor Deforestation and Illegal Logging. MAAP: 90.

MAAP Interactive: Deforestation Drivers in the Andean Amazon

Since its launch in April 2015, MAAP has published over 70 reports related to deforestation (and natural forest loss) in the Andean Amazon. We have thus far focused on Peru, with several reports in Colombia and Brazil as well.

These reports are meant to be case studies of the most important and urgent deforestation events. We often use forest loss alerts (known as GLAD) to guide us, and satellite imagery (from Planet and DigitalGlobe) to identify the deforestation driver.

Here we present an interactive map highlighting the drivers identified in all published MAAP reports. These drivers include gold mining, agriculture (e.g. oil palm and cacao), cattle pasture, roads, and dams (see icon legend below map). We also include natural causes such as floods and blowdowns (fire included under agriculture since most human caused). Furthermore, we highlight deforestation events within protected areas. Note that you can filter by driver by checking boxes of interest.

We hope the result is one of the most detailed and up-todate resources on patterns and drivers of deforestation in the Andean Amazon. Over the coming year we will continue to focus on Peru and Colombia, and begin to include Ecuador and Bolivia as well.

To view the interactive map, please visit:

MAAP Interactive: Deforestation Drivers in the Andean Amazon
https://www.maaproject.org/interactive/

For more information on patterns and drivers of deforestation in the Peruvian Amazon, see our latest Synthesis report 

MAAP #73: United States’ only National Tropical Rainforest ravaged by Hurricane Maria (Puerto Rico)

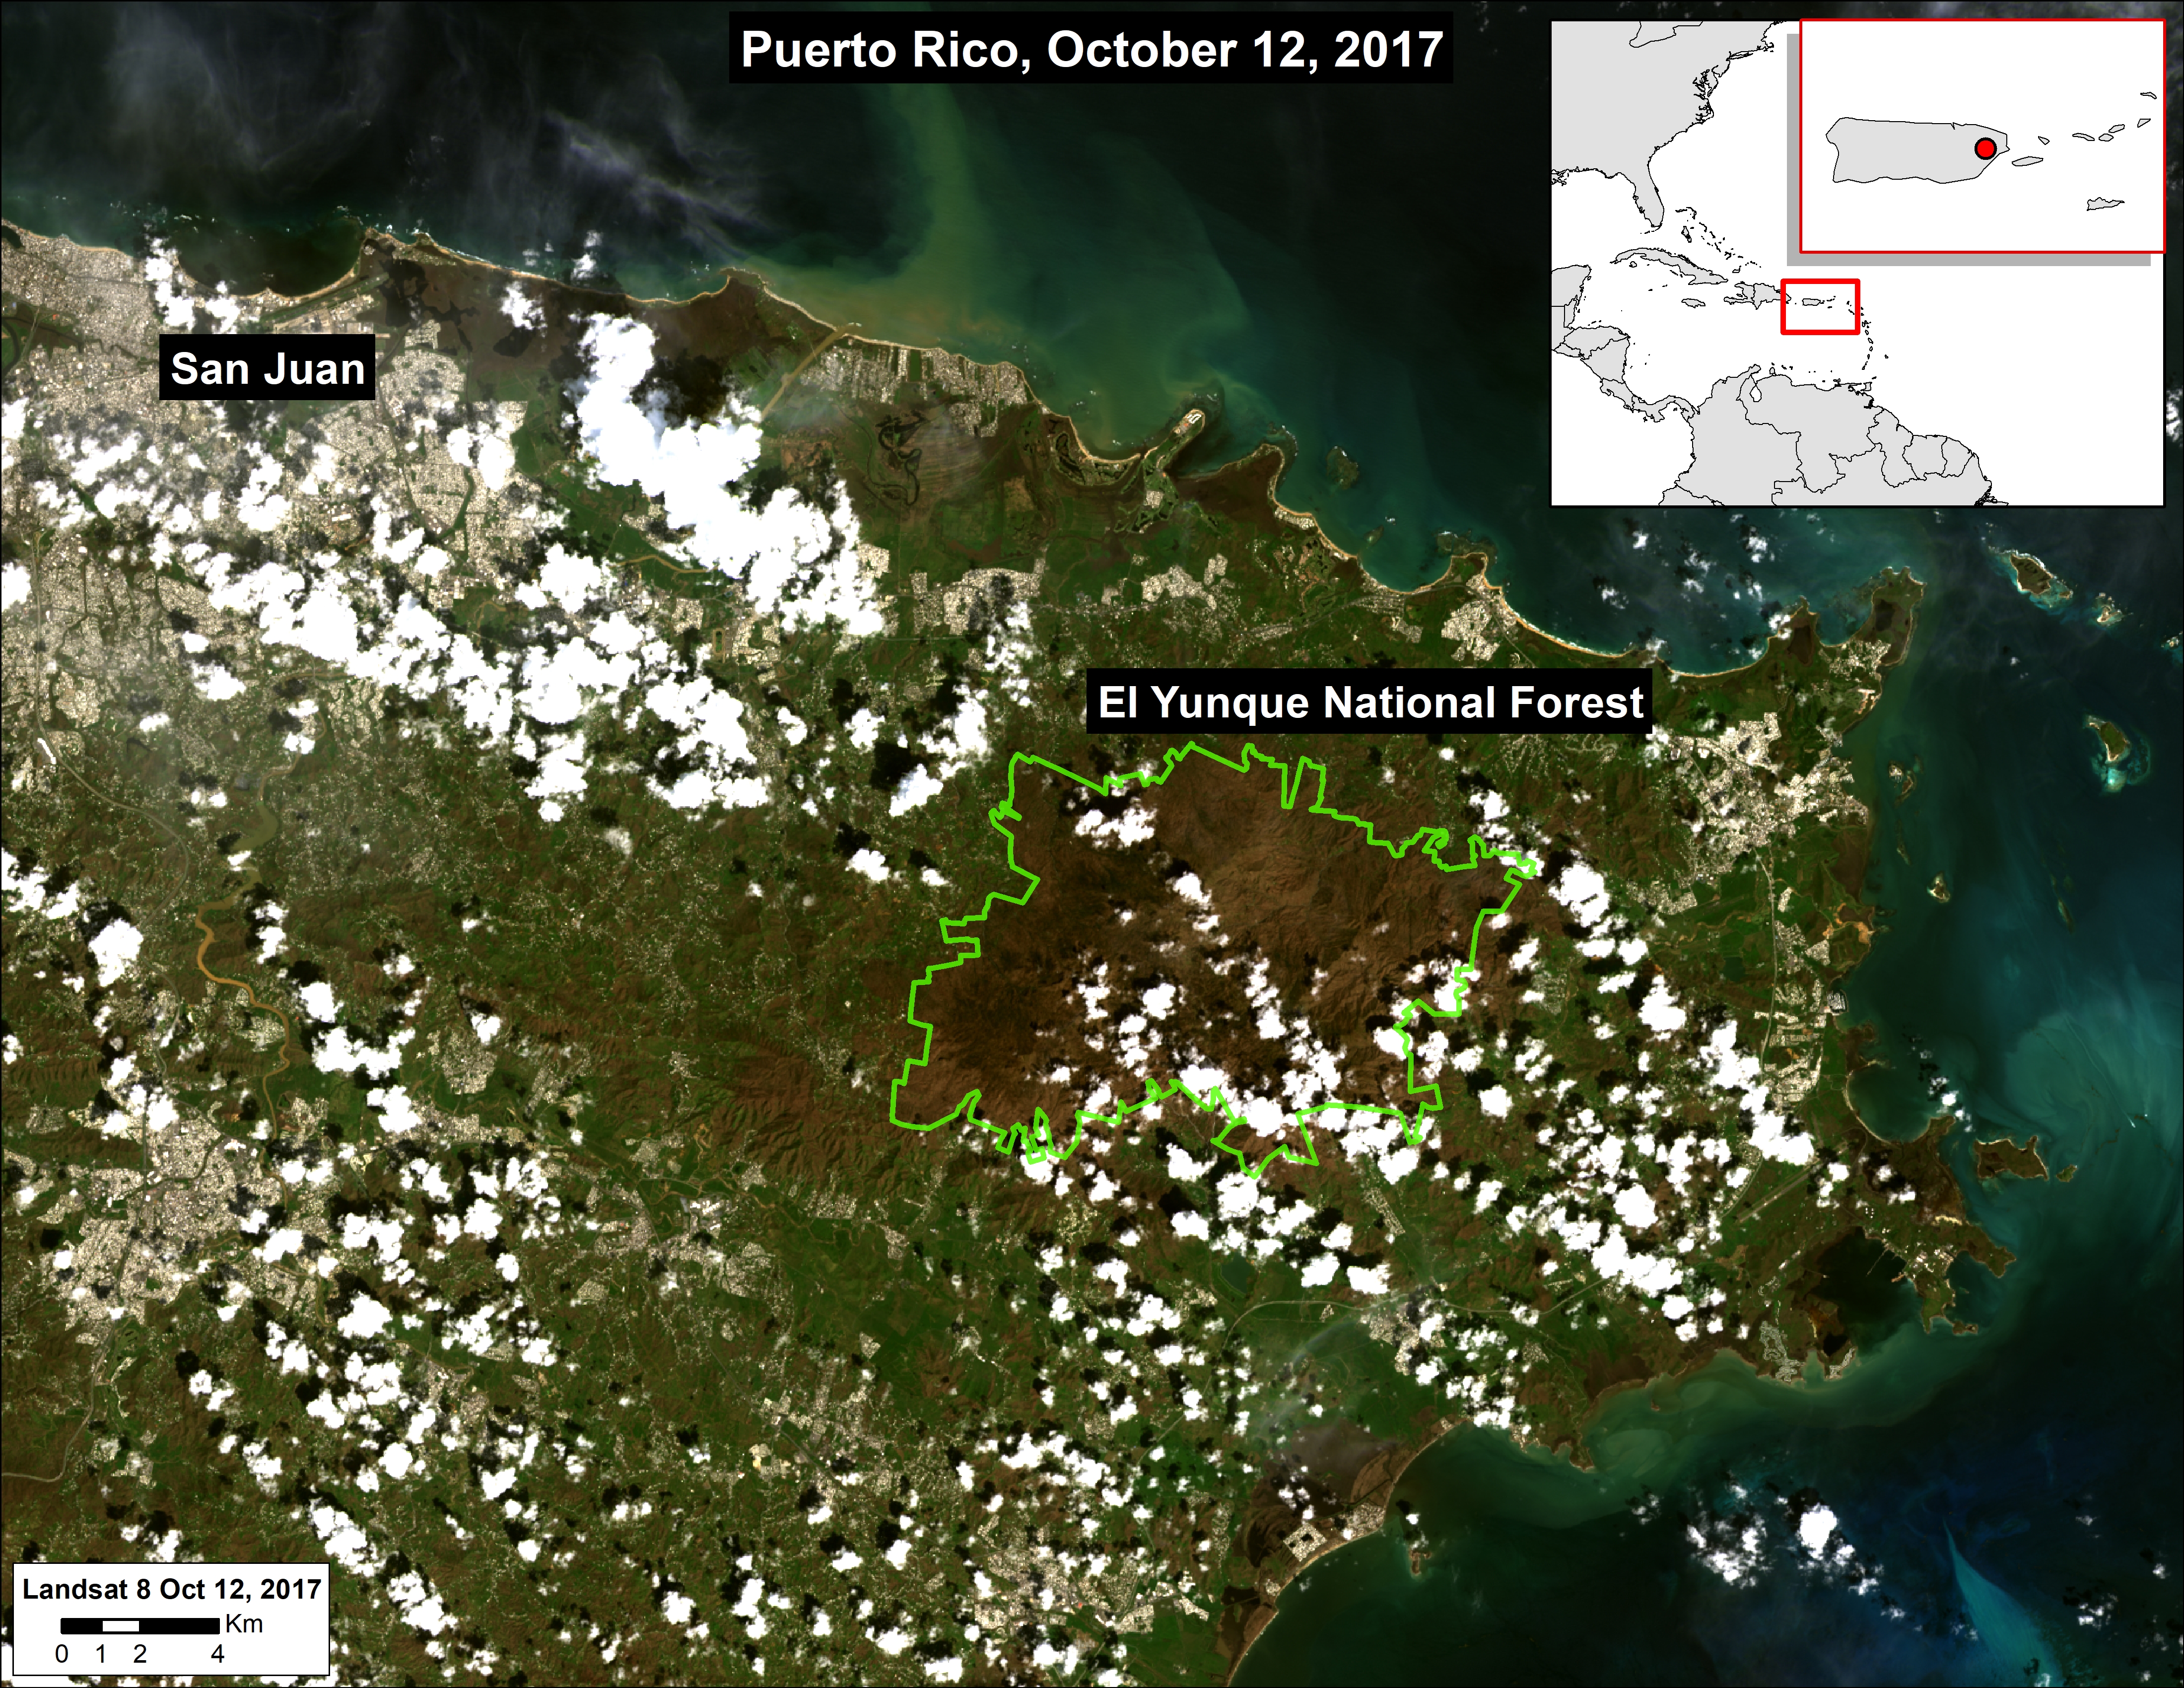
Image 73. Base Map. El Yunque National Forest is located in eastern Puerto Rico.

MAAP usually focuses on deforestation in the Andean Amazon region, but has a larger interest in tropical forests in general. Thus, we present this analysis in that larger framework.

The New York Times recently reported that Hurricane Maria “obliterated” the United States’ only national tropical rain forest as the powerful Category 4 hurricane (with 150 mph winds) passed over Puerto Rico on September 20.
Here, we present a series of fresh satellite images from October that indeed show the severe impact to nearly all 28,400 acres of El Yunque National Forest (see Base Map). El Yunque is managed by the United States Forest Service and is the only tropical rain forest in the US national forest system.
Throughout the article, click on each image to enlarge.

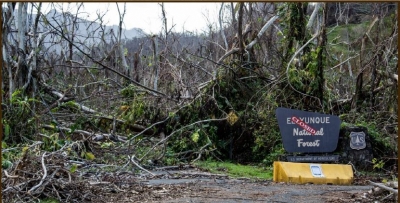
Photo from ” The Naked Landscape Presentation”, US Forest Service,


Before and After Hurricane Maria

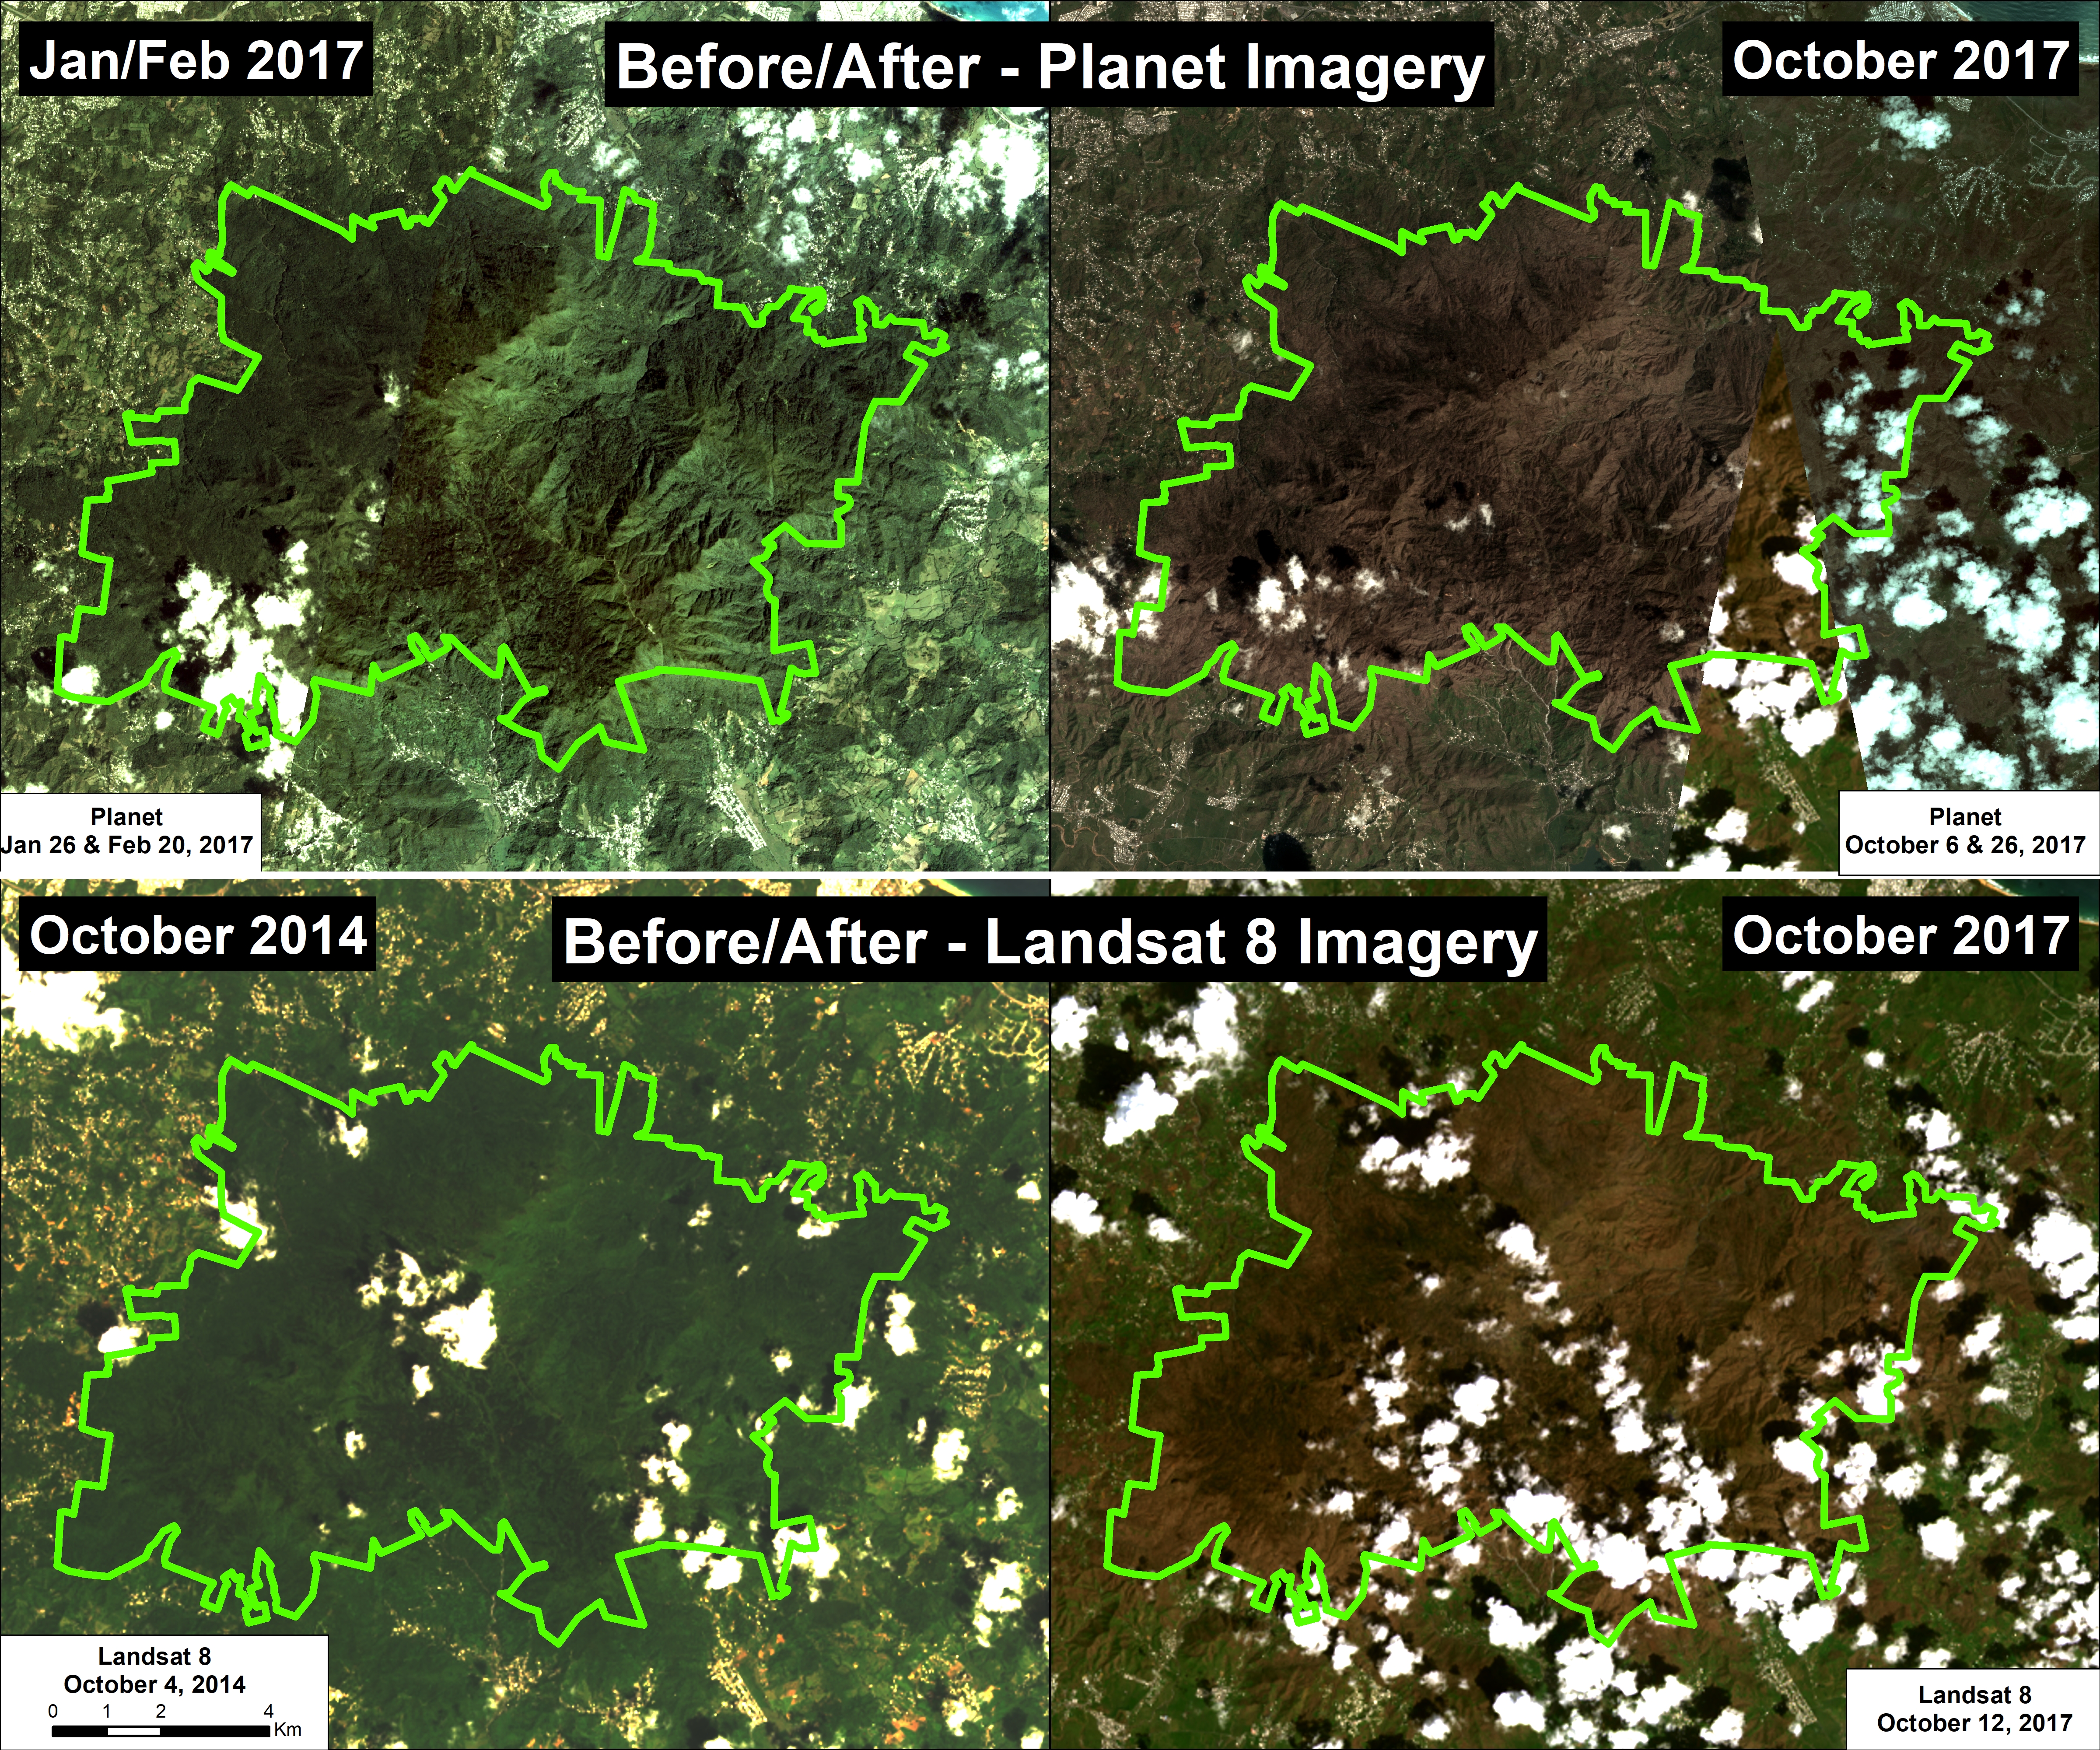
Image 73 shows the striking contrast within El Yunque National Forest before (left panels) and after (right panels) Hurricane Maria using two different satellite systems. The top row is high-resolution (3 meter) imagery from the company Planet, and the bottom row is medium-resolution (30 meter) from NASA/USGS. These images match reports in the New York Times and NPR that the rain forests of El Yunque have been largely “defoliated.”

Image 73. Data: Planet, NASA/USGS (Landsat 8)

Very High-Resolution Zooms

In addition, another satellite system, from the company DigitalGlobe, provides very high-resolution (0.5 meter) zooms of Hurricane Maria’s impact on the rain forests of El Yunque.

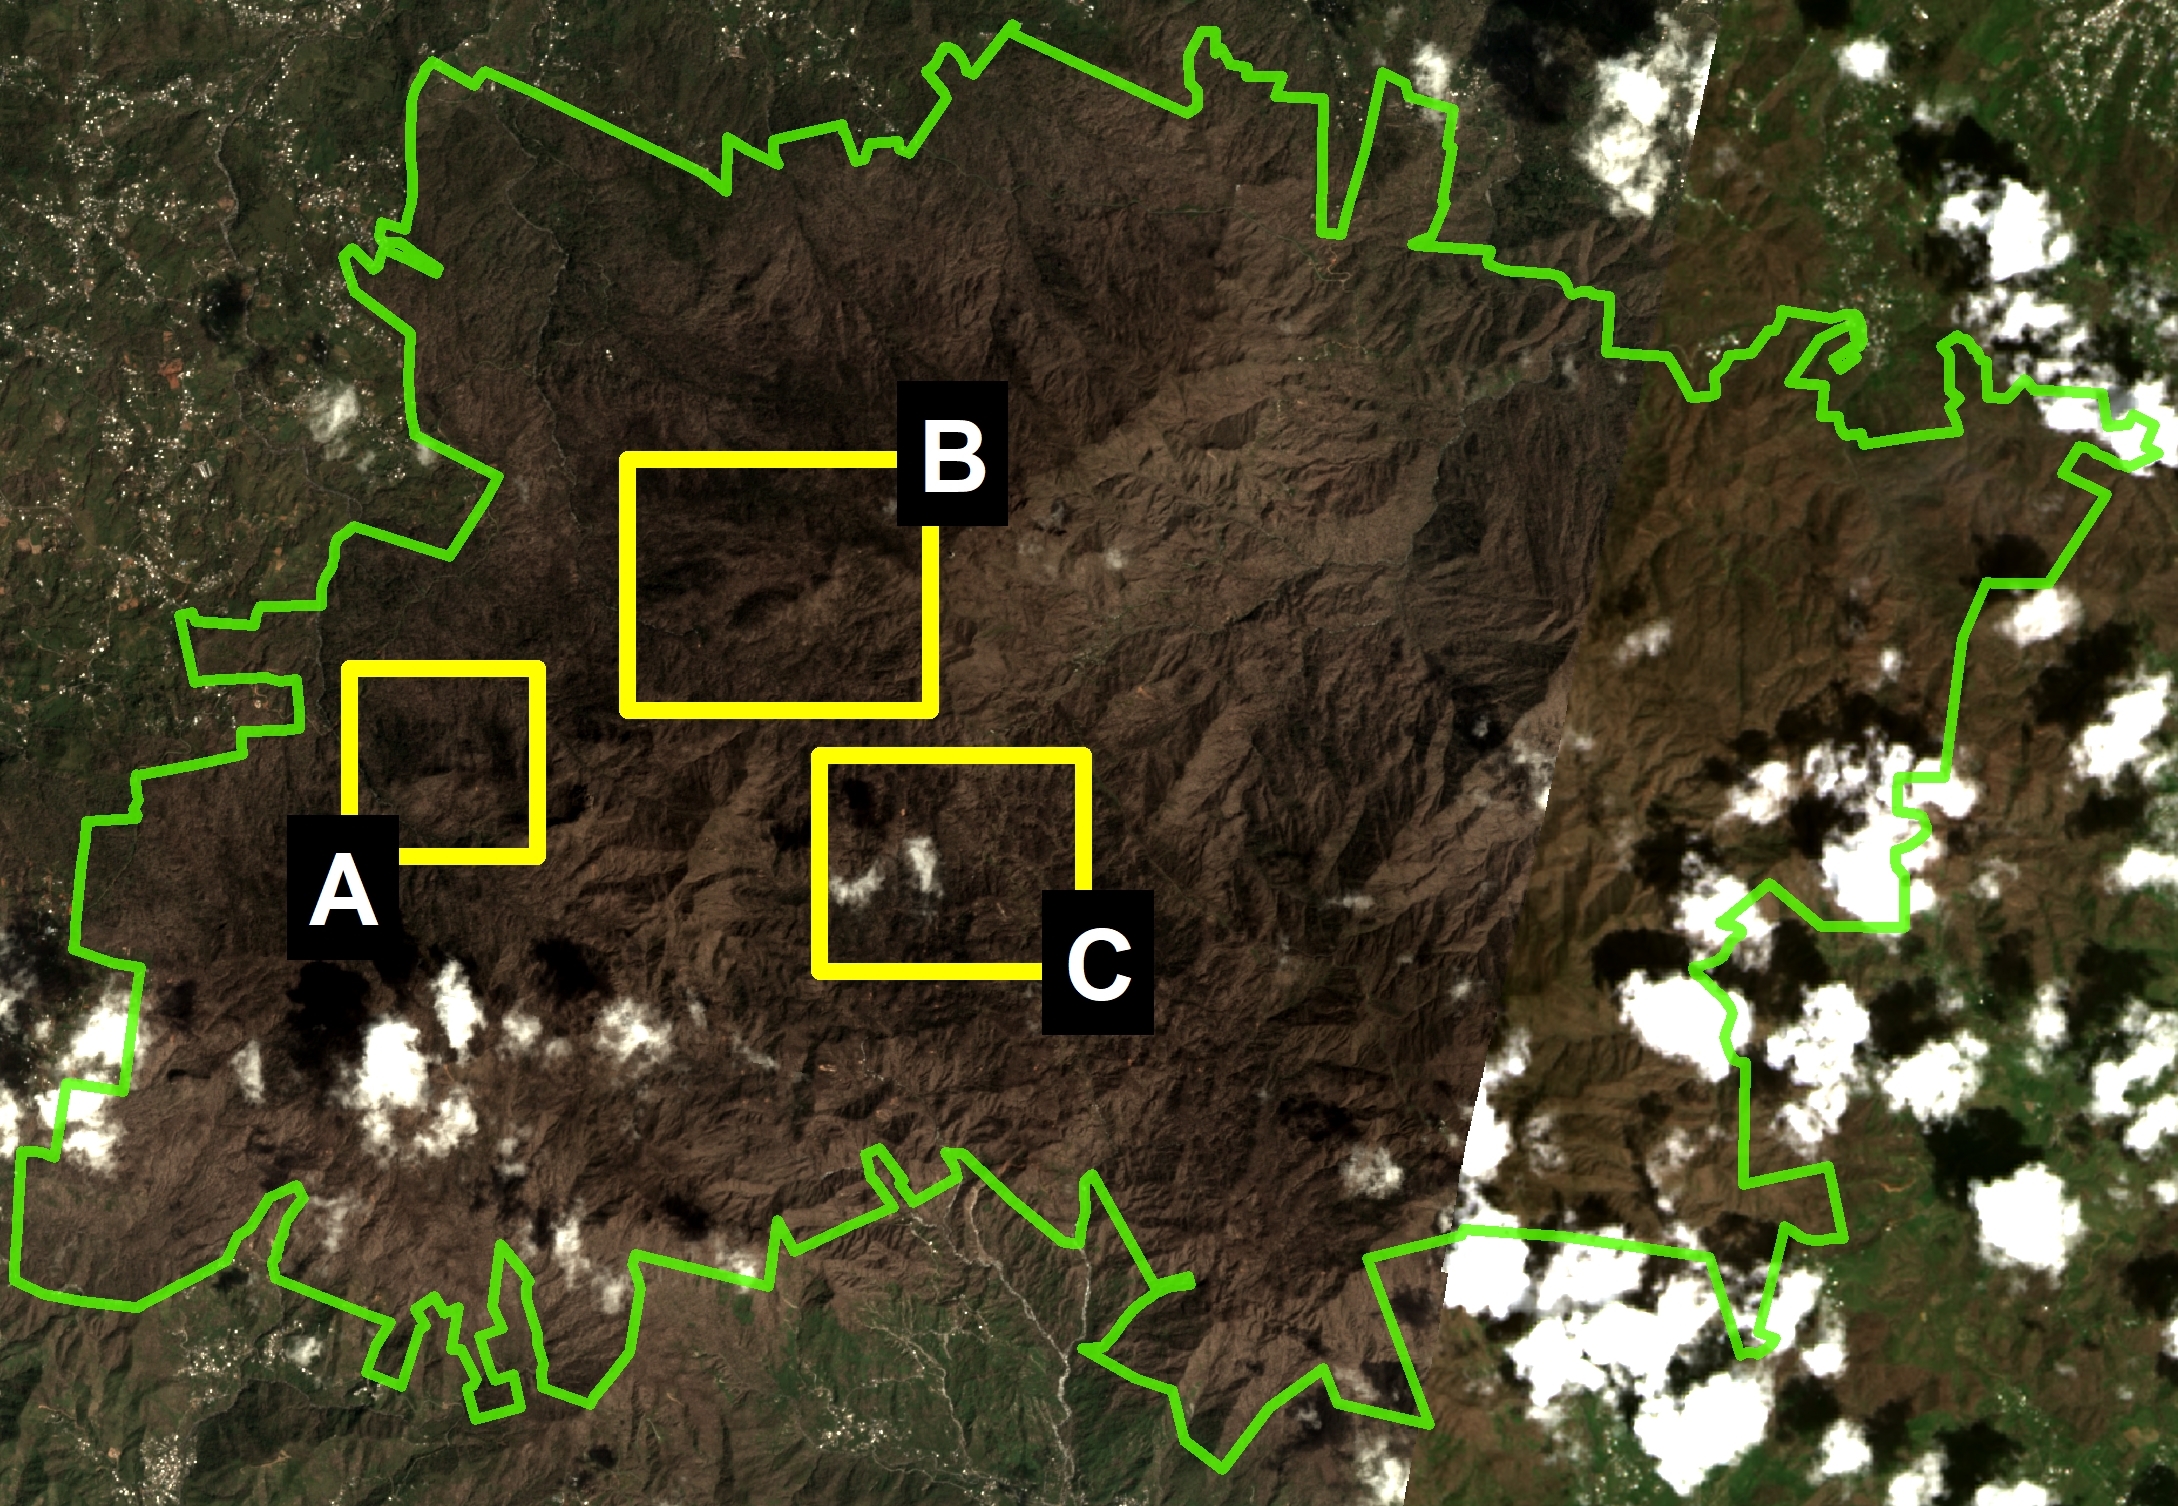
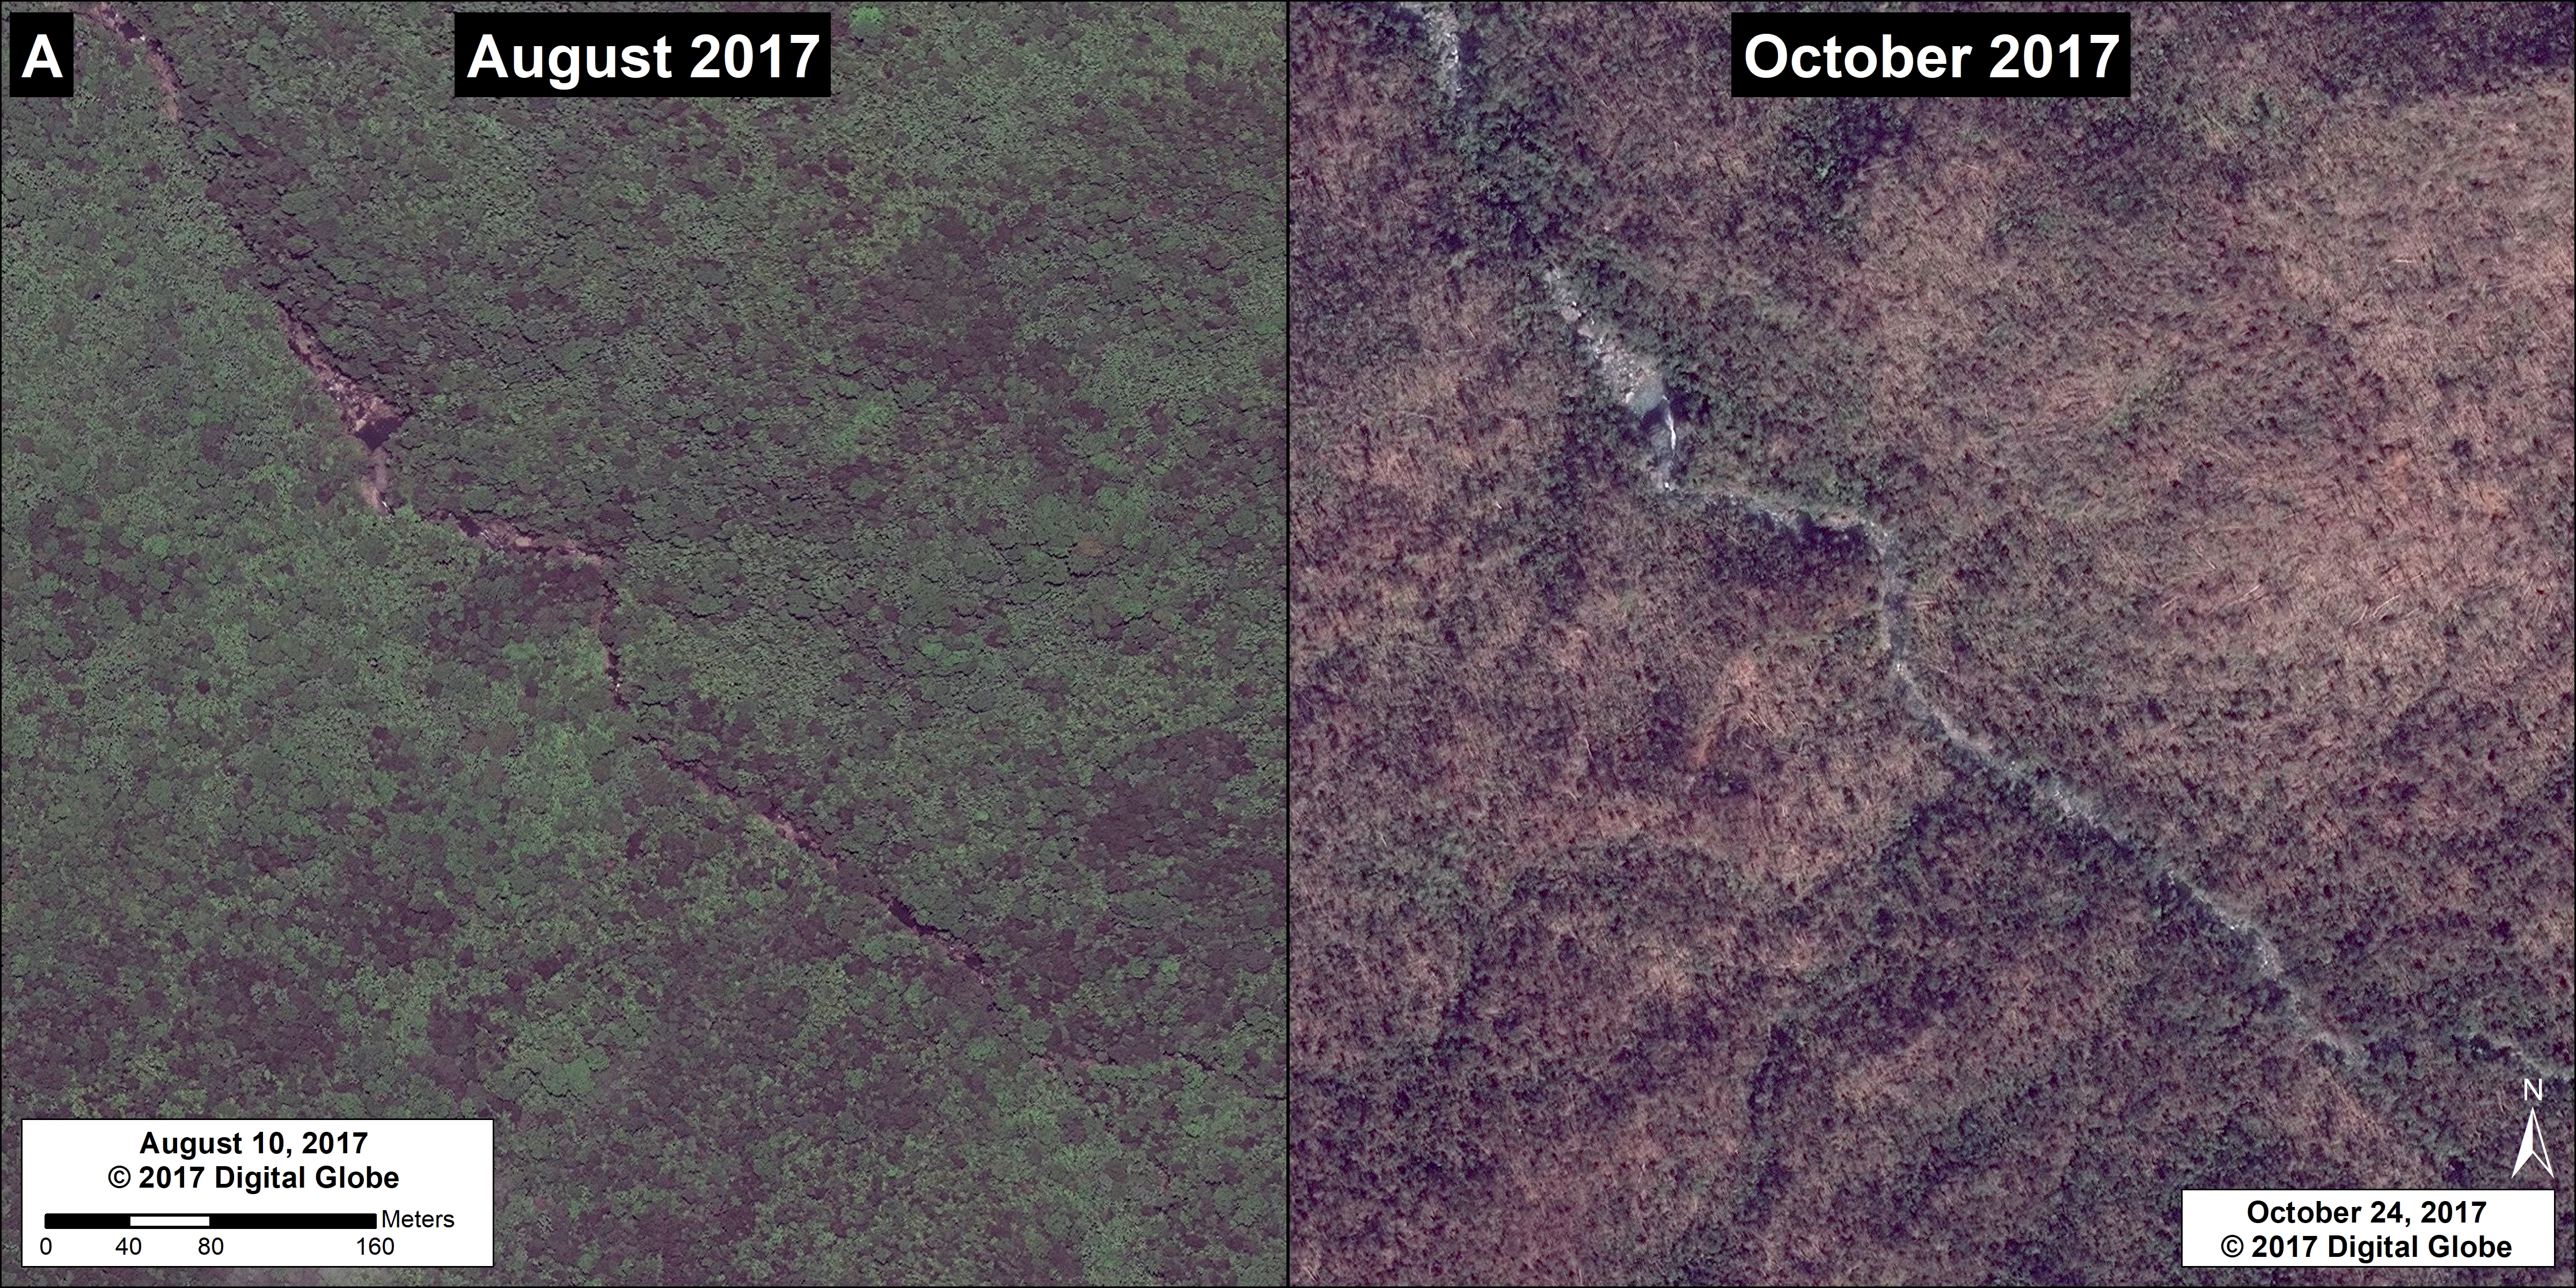
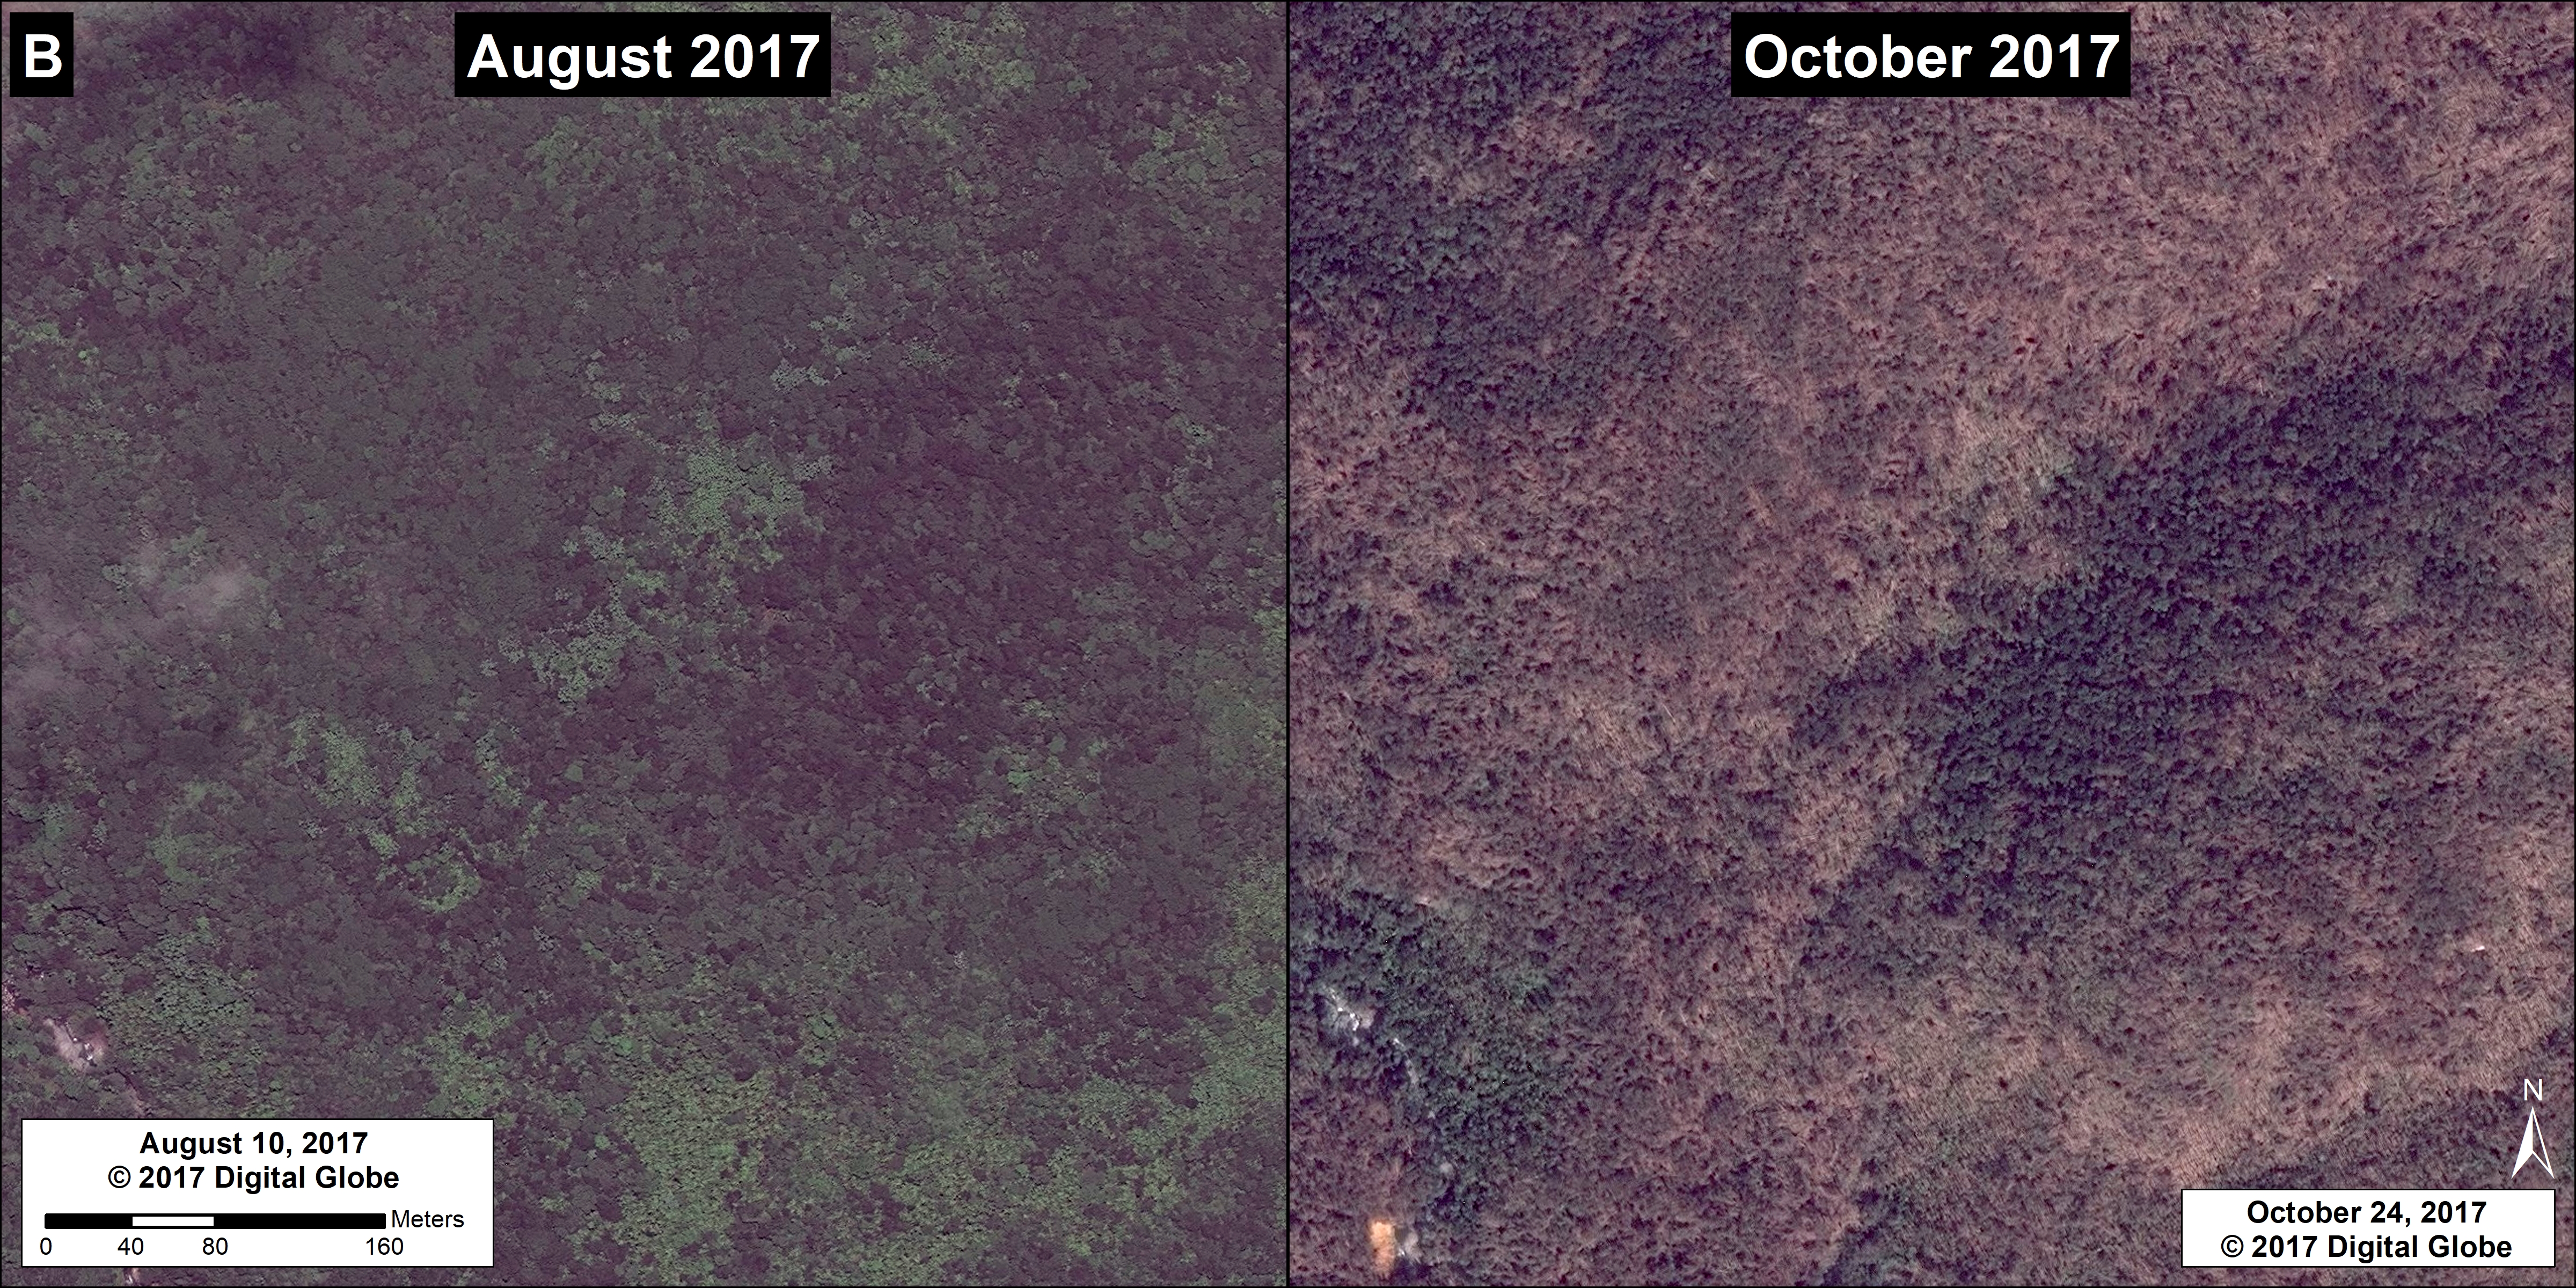
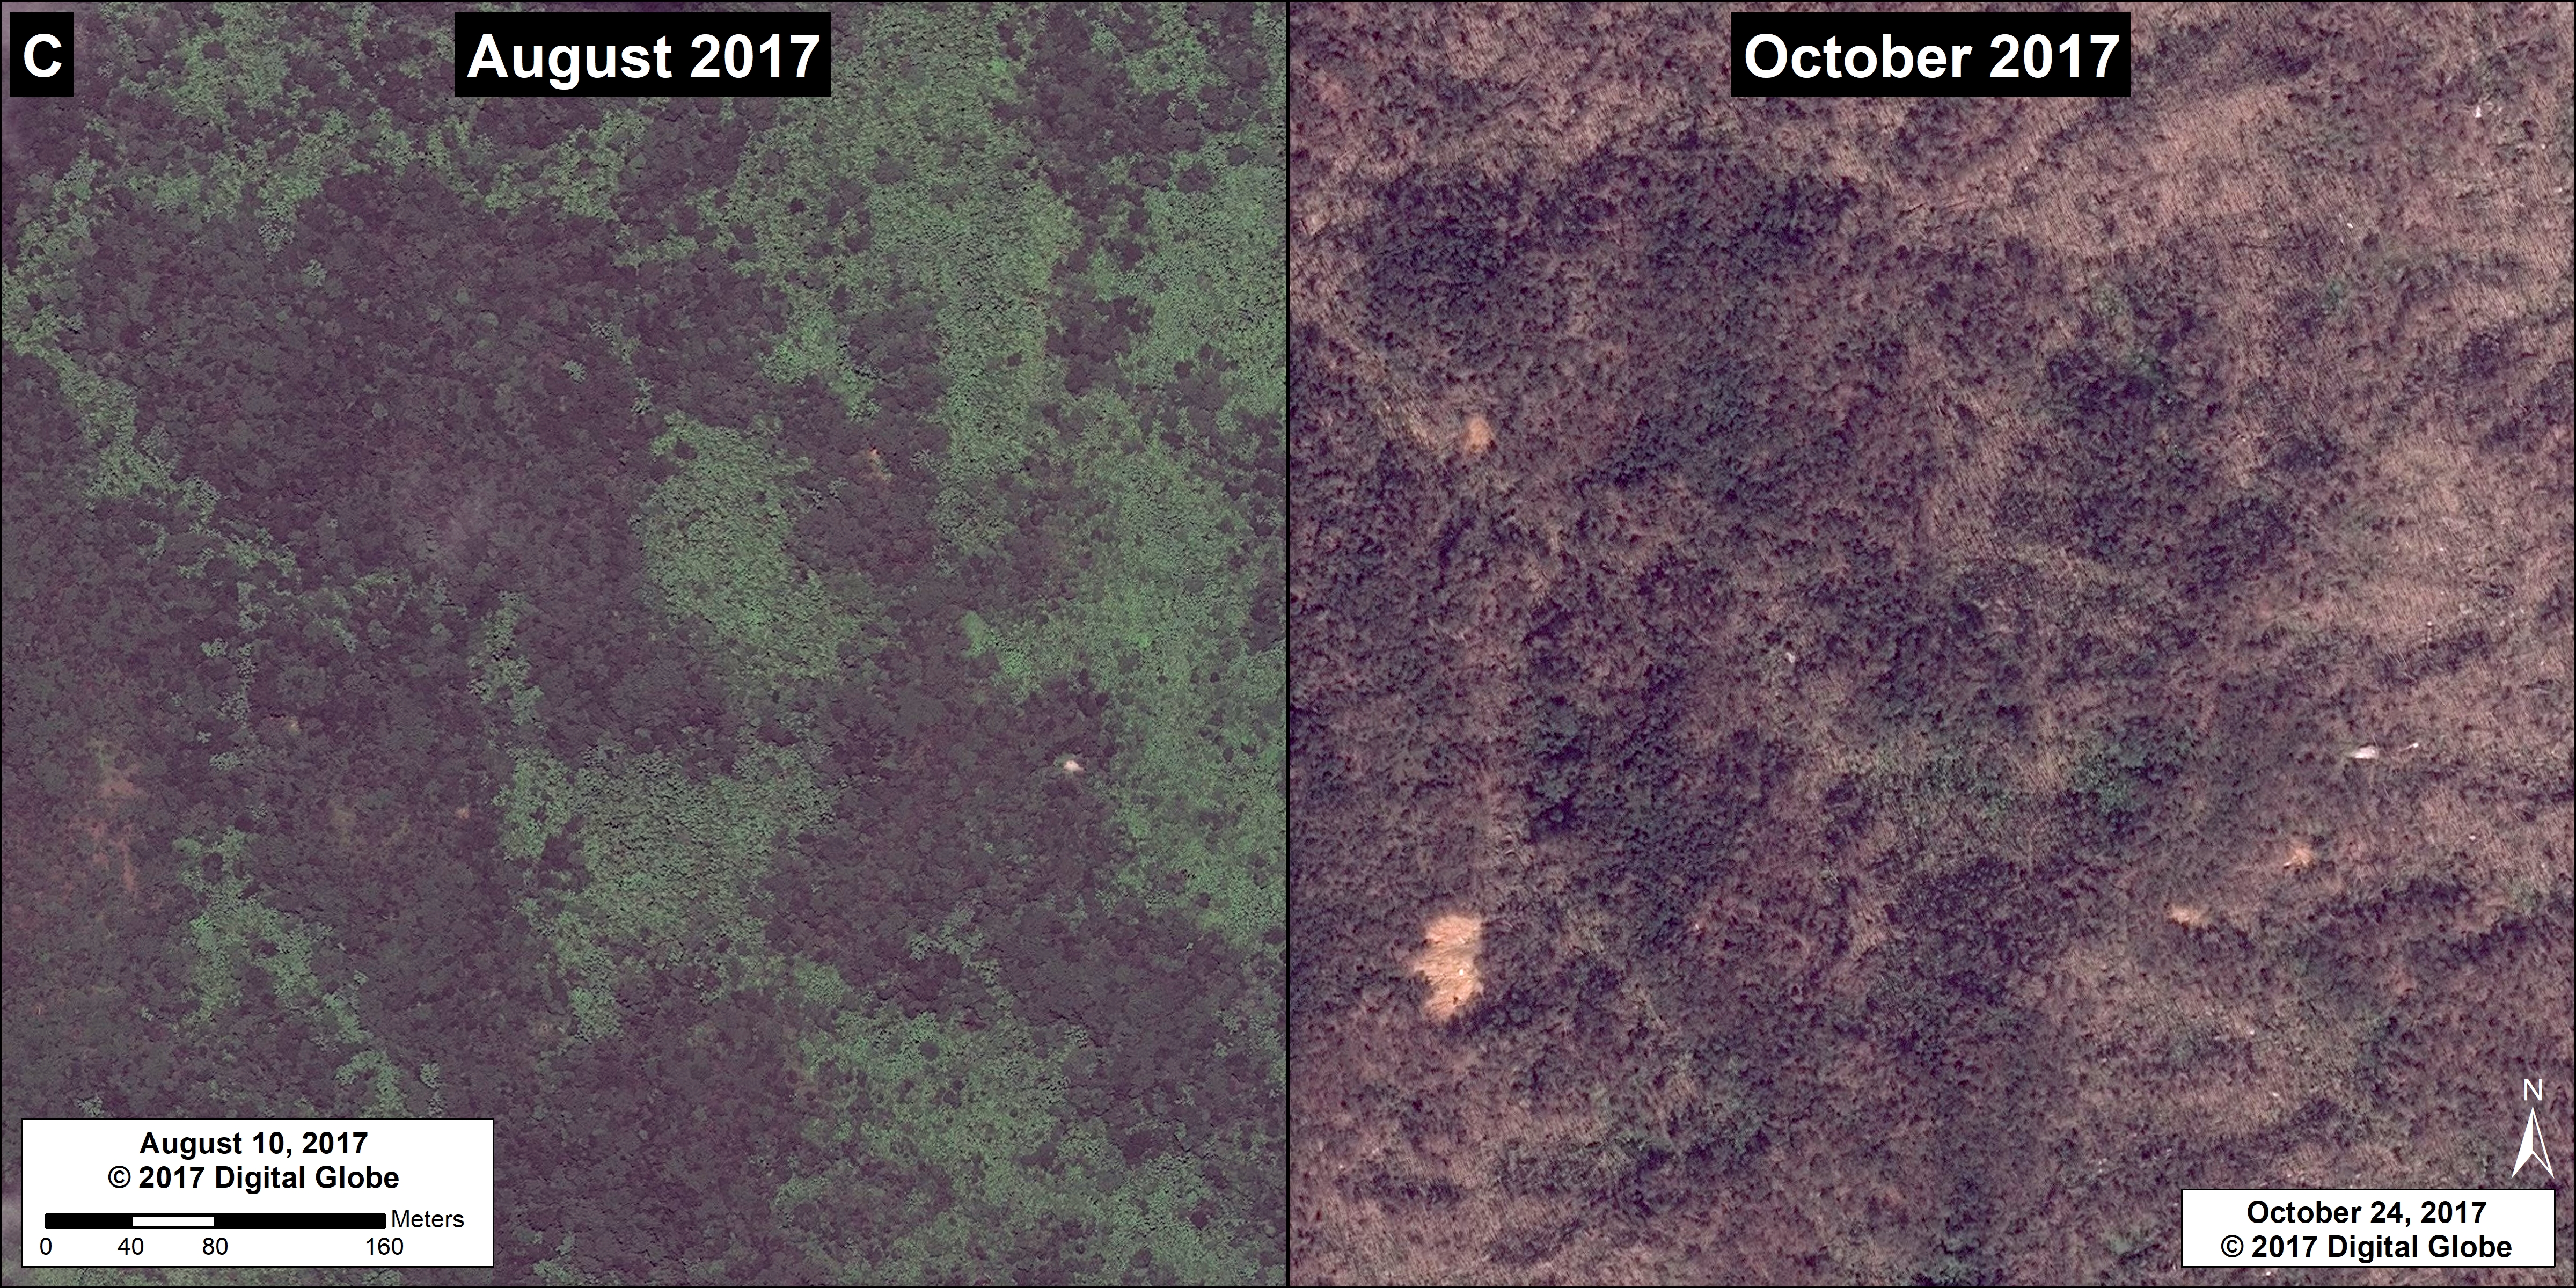
The following images show, in greater detail, the contrast before (left panels) and after (right panels) the hurricane event in three different locations within El Yunque National Forest (labelled A, B, and C).


Image 73a. Imagery source: © 2017 DigitalGlobe
Image 73b. Imagery source: © 2017 DigitalGlobe
Image 73c. Imagery source: © 2017 DigitalGlobe

Imagery Reference

Planet Team (2017). Planet Application Program Interface: In Space for Life on Earth. San Francisco, CA. https://api.planet.com

DigitalGlobe (Nextview)

Citation

Finer M, Olexy T (2017) United States’ only National Tropical Rainforest ravaged by Hurricane Maria (Puerto Rico). MAAP: 73.

MAAP #70: “Hurricane Winds” in the Peruvian Amazon, a 13 Year Analysis

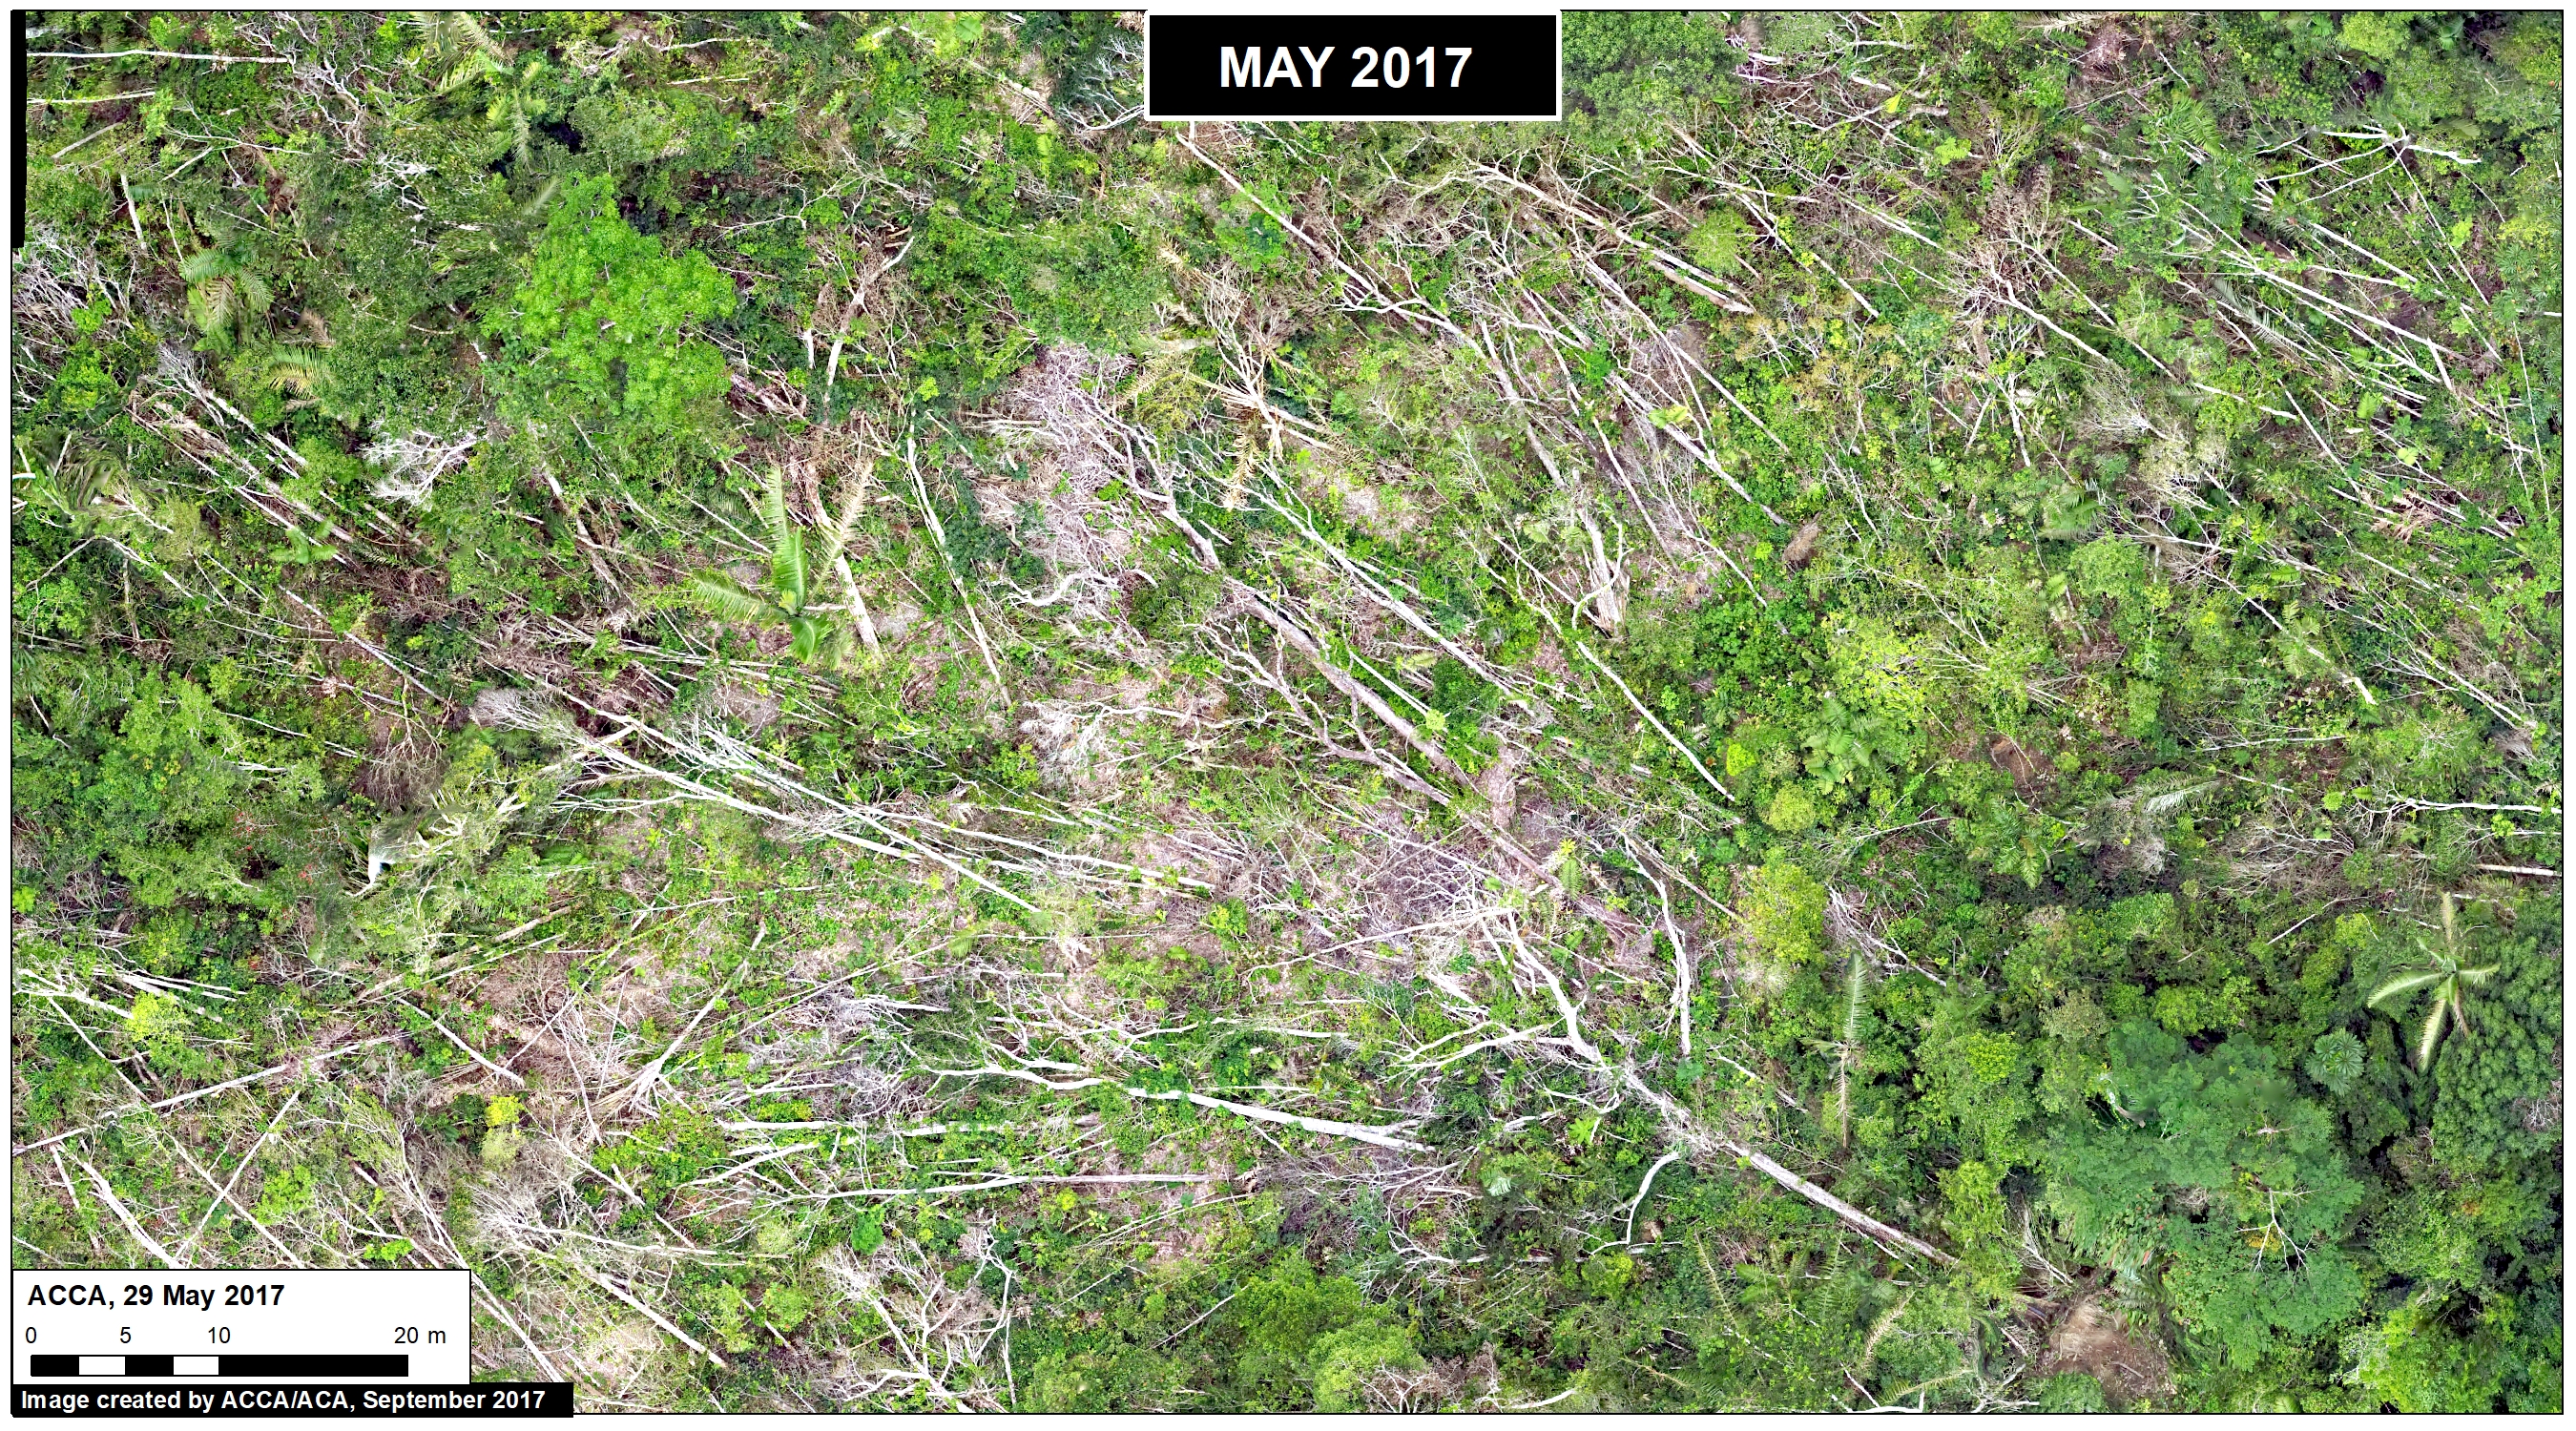
In an earlier report, MAAP #54, we described the natural phenomenon of “hurricane winds” in the Peruvian Amazon. These strong wind storms (not true hurricanes) cause a chain reaction of fallen trees and may blow down hundreds of acres of Amazonian forest (see Drone Image below).

This report presents an analysis of the frequency and intensity of hurricane winds in the Peruvian Amazon over the past 13 years (2005-17). The analysis is based on the annual forest loss data and early warning alerts data.

Drone Image. Source: ACCA

Temporal Patterns

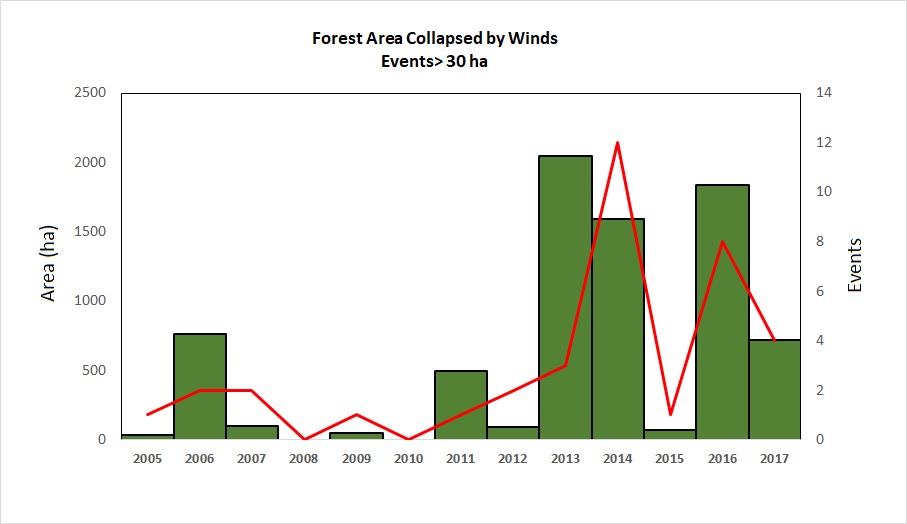
Graph 70 shows the temporal patterns for two important annual variables: Number of hurricane wind events (red line) and the total forest blowdown area (green bars). We found a total of 37 hurricane wind events resulting in the blowdown of 19,275 acres (7,800 hectares) between 2005 and 2017 in the Peruvian Amazon. Note the major increase in 2013, 2014, and 2016; these three years account for two-thirds of the total events and blowdown area.

Graph 70. Data: MAAP.

Spatial Patterns

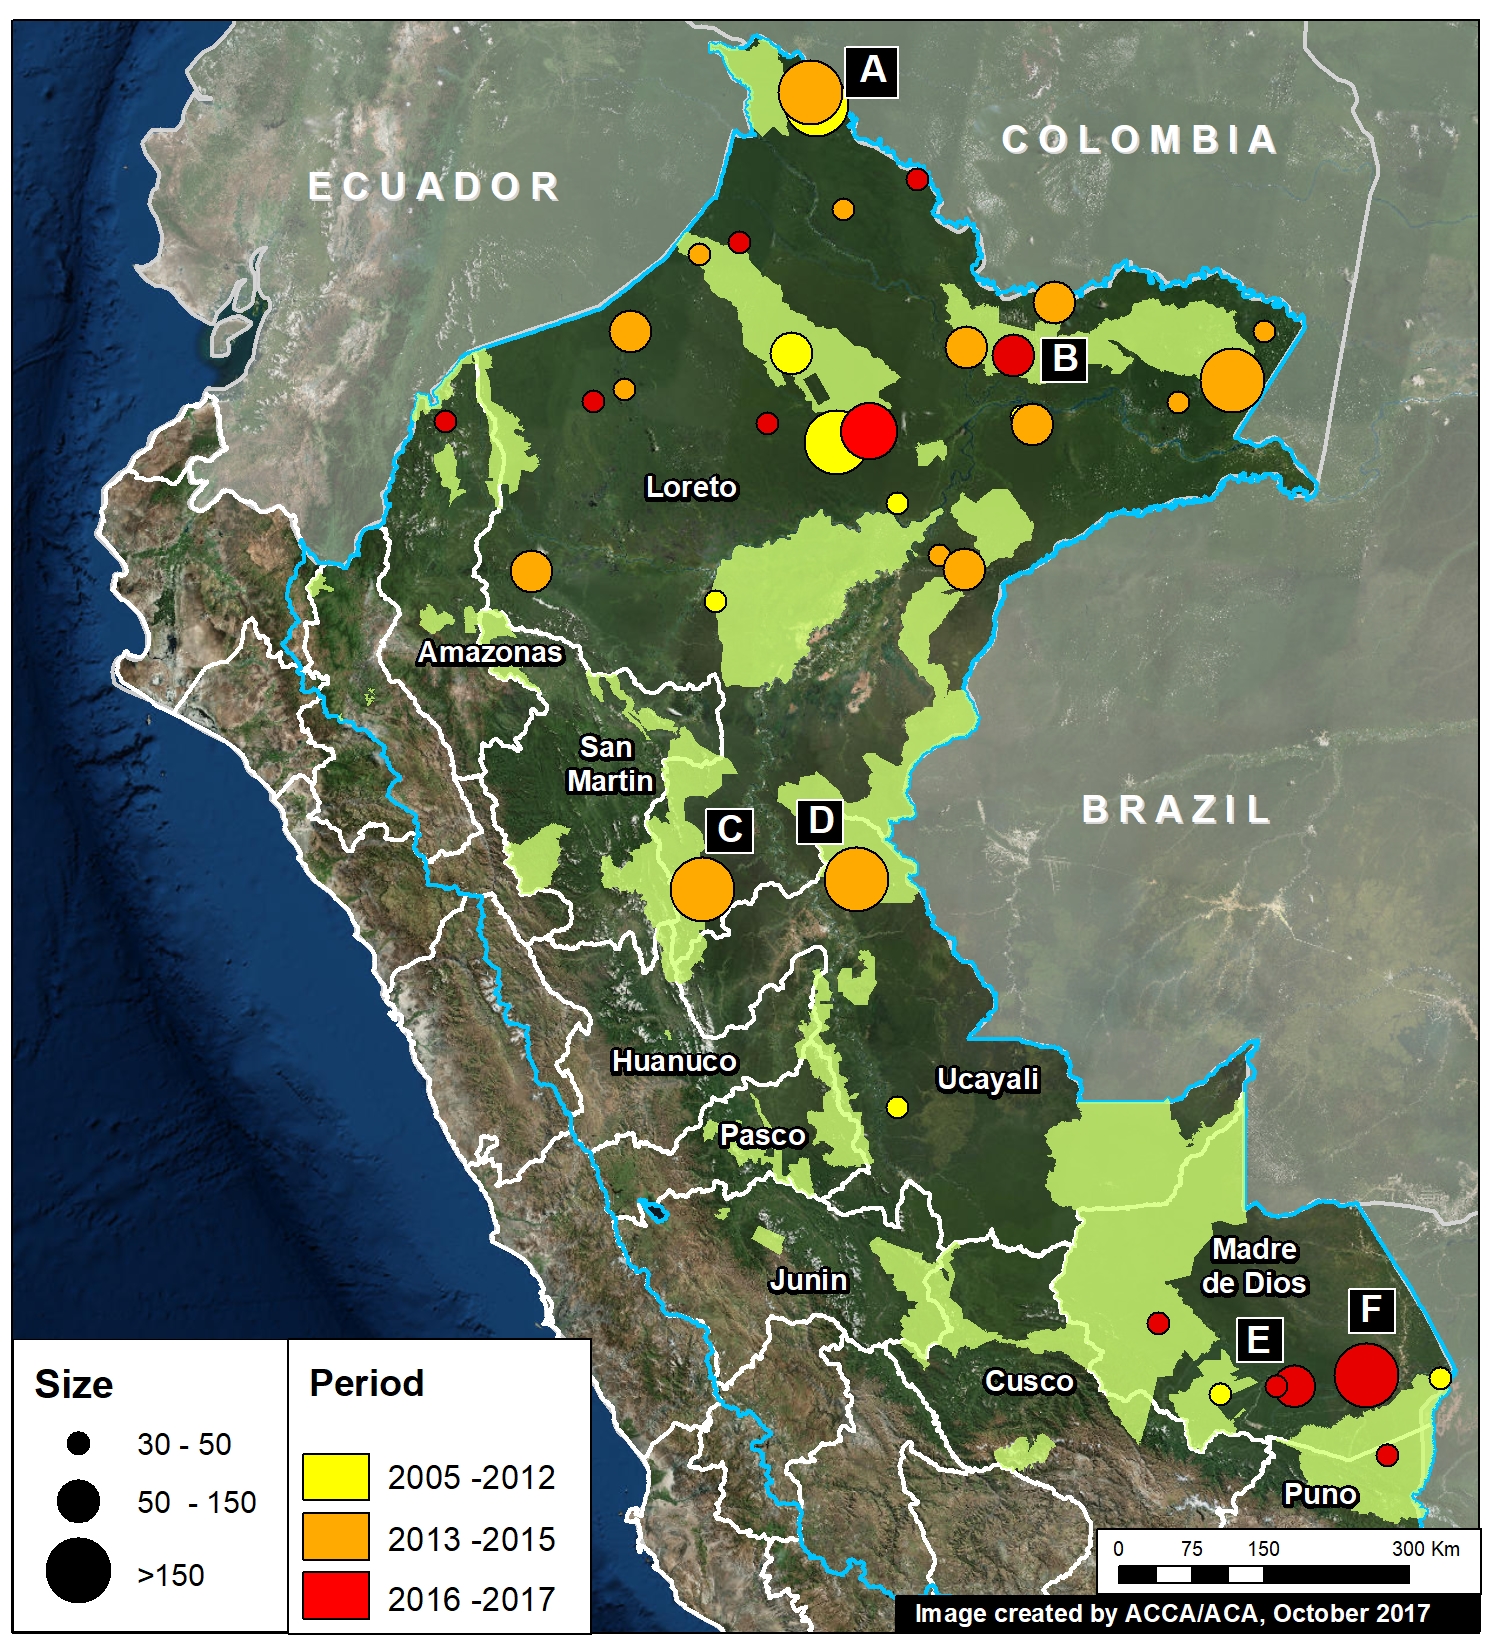
Image 70. Data: MAAP, SERNANP

Image 70 shows the spatial patterns of the hurricane winds. Note the following highlights:

– Most of the events occurred in the regions of Loreto and Madre de Dios.

– In Loreto, most of the events occurred since 2013; in Madre de Dios, most occurred since 2016.

– There were 7 major events over 150 hectares (370 acres) each. The largest of these events was 2,255 acres (912 hectares).


Satellite  Images

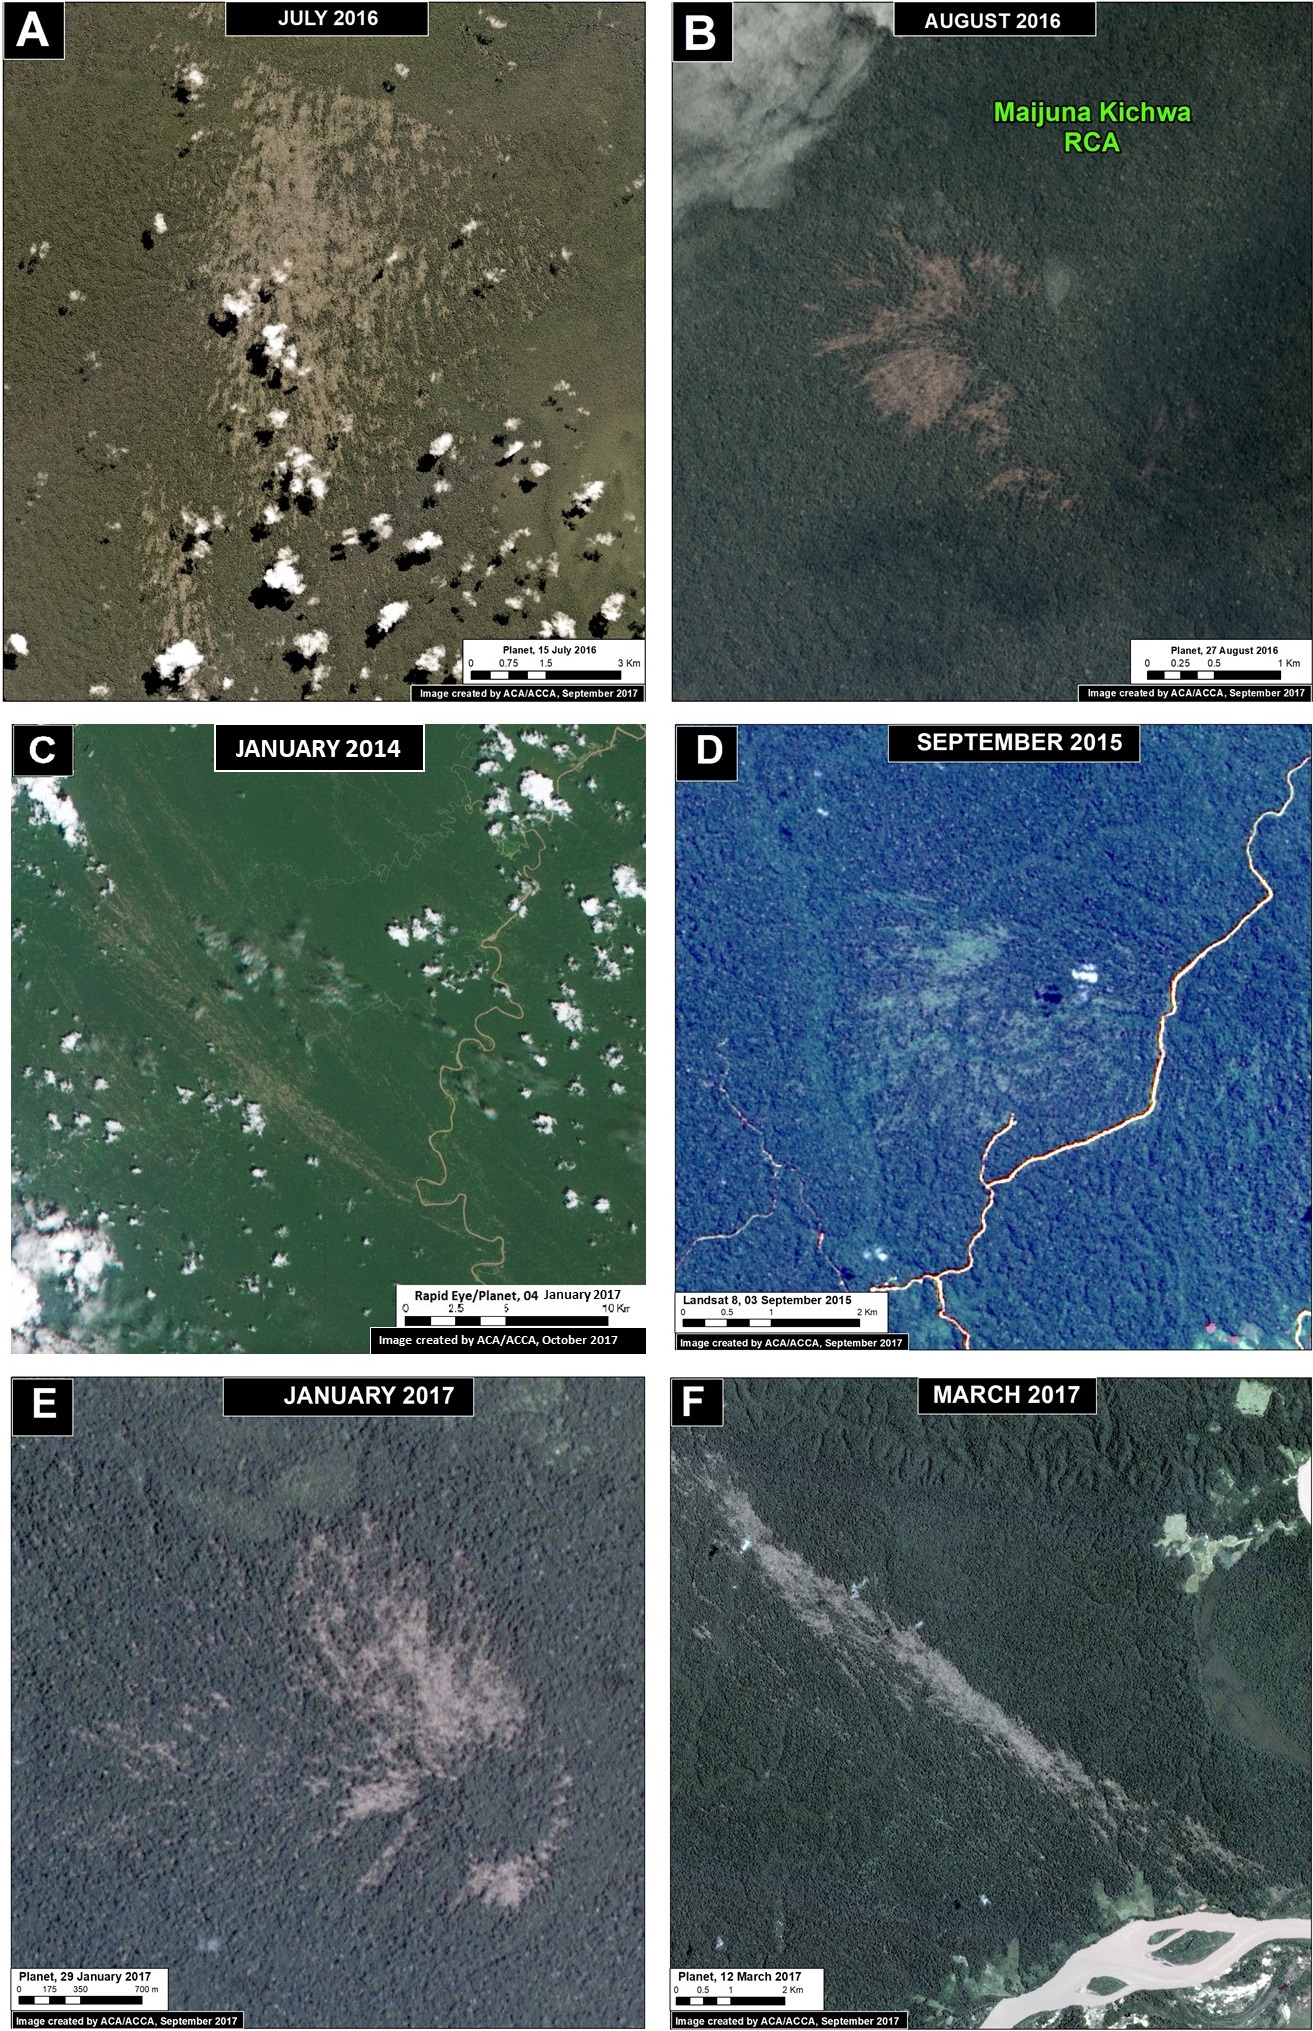
Below, we show satellite images of some of the major hurricane wind events. The letters (A-F) correspond the the locations in Image 70.

Data: Planet, NASA/USGS

Methodology

  1. To determine the natural forest loss areas, we utilized the forest loss data from the GEOBOSQUES’ portal of the PNCBCC – MINAM, as well as the forest loss data from the University of Maryland, through their Global Forest Change portal that provides data from 2001 – 2015. We decided to evaluate both database due to the different criteria for excluding areas in remote locations. For the analysis, it was only considered events resulting in forest loss of 30 hectares or higher.
  2. We determined the natural forest loss through the visual interpretation of the fan-shaped pattern of these natural phenomena. This pattern was then validated with the high and medium resolution images from the years where the loss were detected.
  3. Identifying the period in the year where these events happened, for the years 2015, 2016 and 2017 was determined initially under the Julian calendar that is compatible with the table of attributes of the forest loss database. Consequently, we utilized major series of continuous high resolution images to reduce the timeframe in which these event could have occurred.

References

Planet Team (2017). Planet Application Program Interface: In Space for Life on Earth. San Francisco, CA. https://api.planet.com.

Citation

Novoa S, Finer M (2017) Hurricane Winds in the Last 12 Years in Peru. MAAP: 70.

MAAP #65: Deforestation Hotspots of 2017 in the Peruvian Amazon

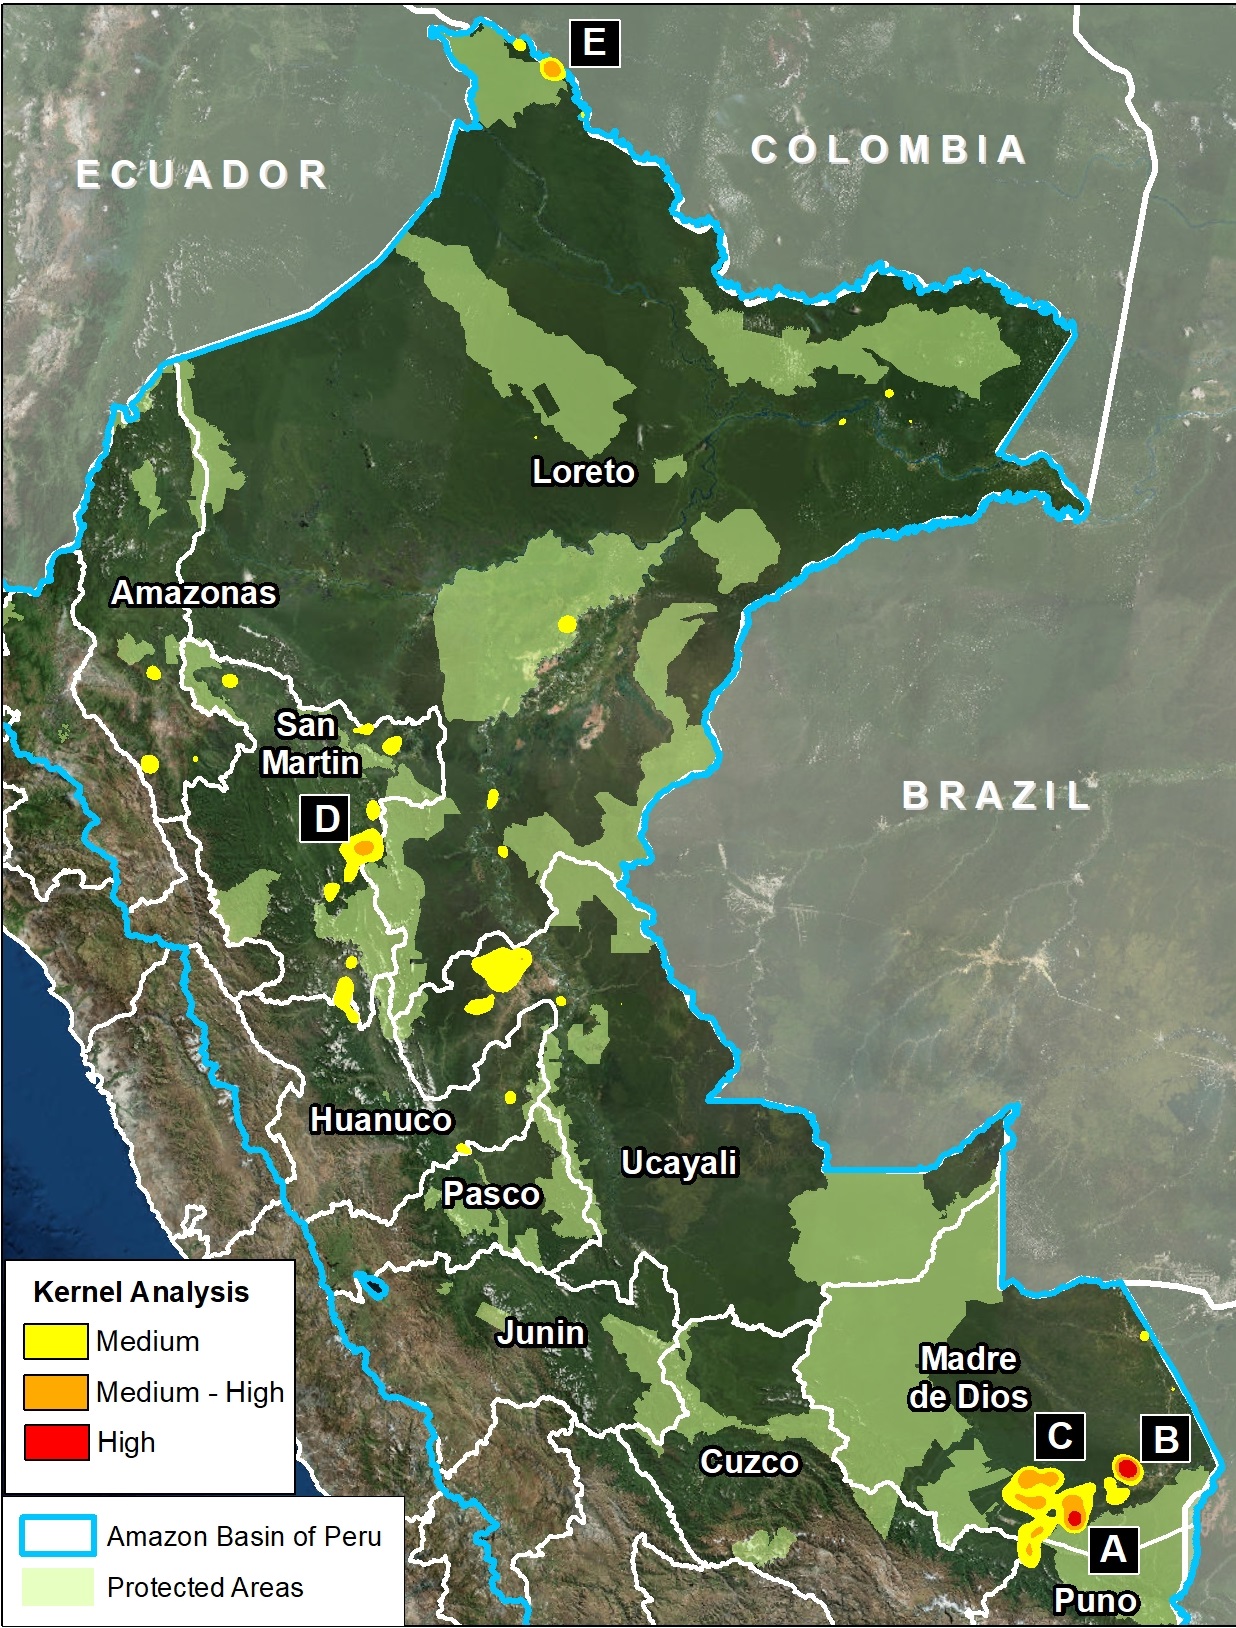
Image 65. Data: MINAM/PNCB, UMD/GLAD, SERNANP, MAAP

In an earlier report, MAAP #40, we highlighted the power of combining early warning GLAD* alerts with analysis of high-resolution satellite images (for example, from the company Planet), as part of a comprehensive near real-time deforestation monitoring system.

In the current report, we analyze the GLAD alerts for the first half of 2017 (through July 17) to identify current deforestation hotspots in the Peruvian Amazon.** These alerts indicate an estimated total forest loss of 37,000 acres (15,000 hectares) thus far during the year.

Image 65 (see right) highlights the 2017 deforestation hotspots, defined here as areas with medium to high density of forest loss.

Below, we describe and show images of the most intense hotspots, indicated in red and orange.

These areas include:

  • Buffer zones of Tambopata National Reserve and Cordillera Azul National Park
  • Natural loss due to blowdowns from “hurricane winds,” in the Madre de Dios region
  • Northwest border with Colombia


Buffer Zone of Tambopata National Reserve 

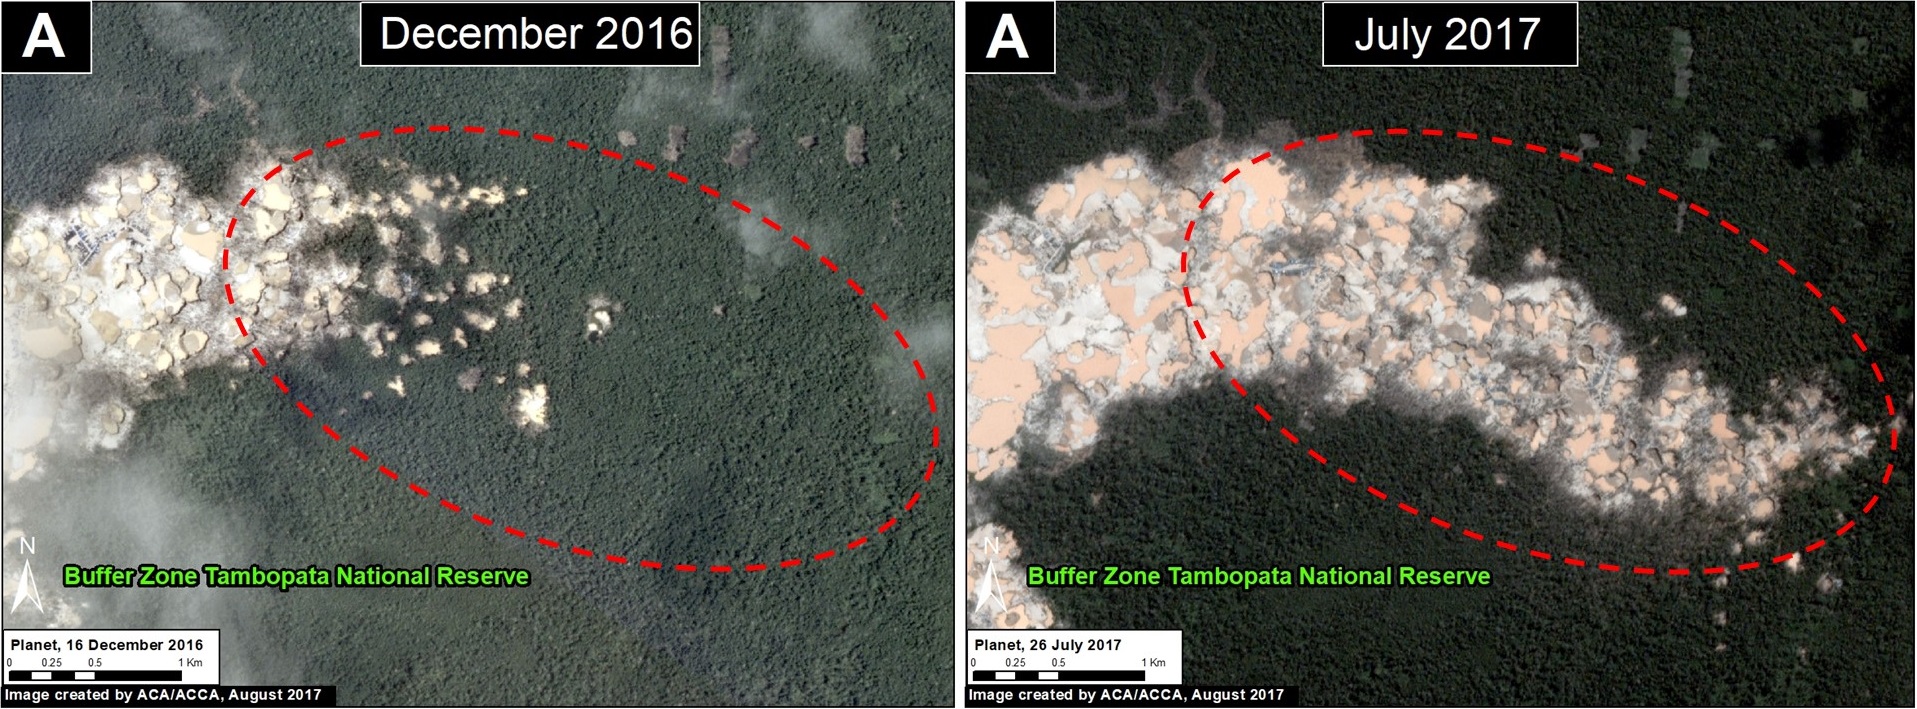
Inset A indicates an area of high intensity deforestation due to gold mining activity in the buffer zone of Tambopata National Reserve in the southern Peruvian Amazon (Madre de Dios region). Image 65a shows the deforestation of 1,210 acres (490 hectares) in this area in 2017. The Peruvian government recently (early July) led a major raid in this area. However, the most recent satellite images (late July – early August) indicate that mining camps are still present in the area.

Image 65a. Data: Planet

Hurricane Winds

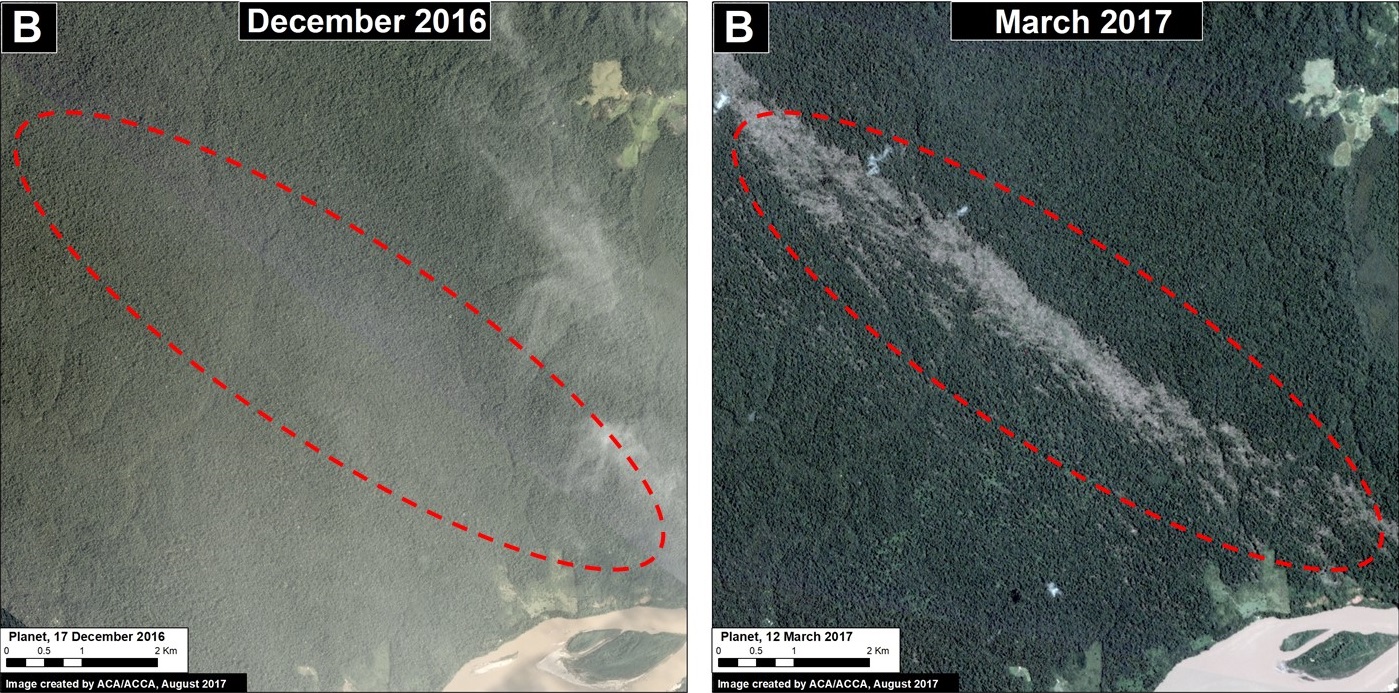
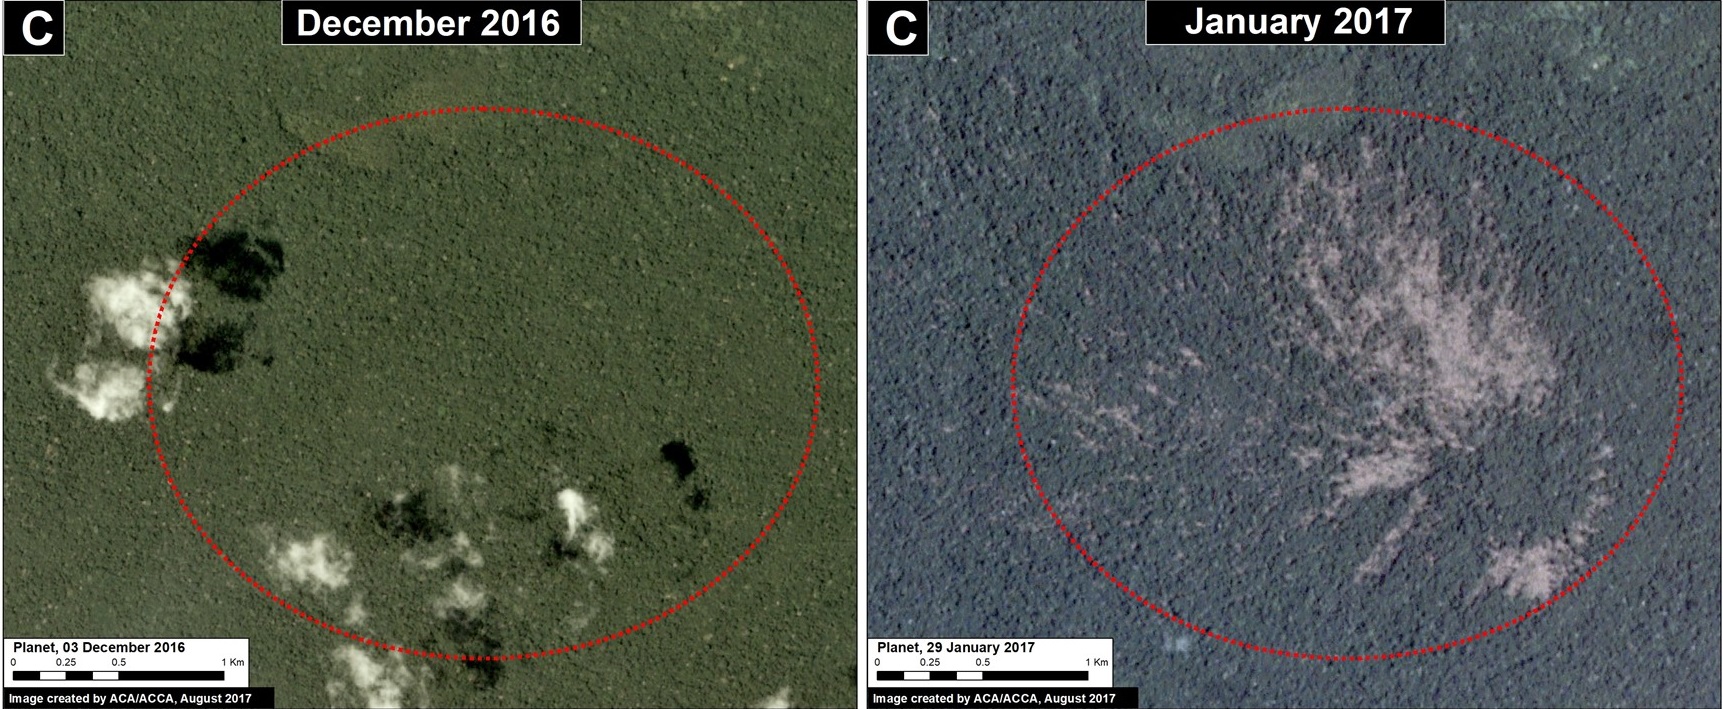
Insets B and C indicate two areas in the southern Peruvian Amazon (Madre de Dios region) that experienced the natural forest loss of 980 acres (400 hectares) caused by hurricane winds, localized thunderstorms with strong winds. Images 65b and 65c show the recent 2017 forest loss. See MAAP #54 and MAAP #55 for more details about hurricane winds.

Image 65b. Data: Planet
Image 65c. Data: Planet

Buffer Zone of Cordillera Azul National Park

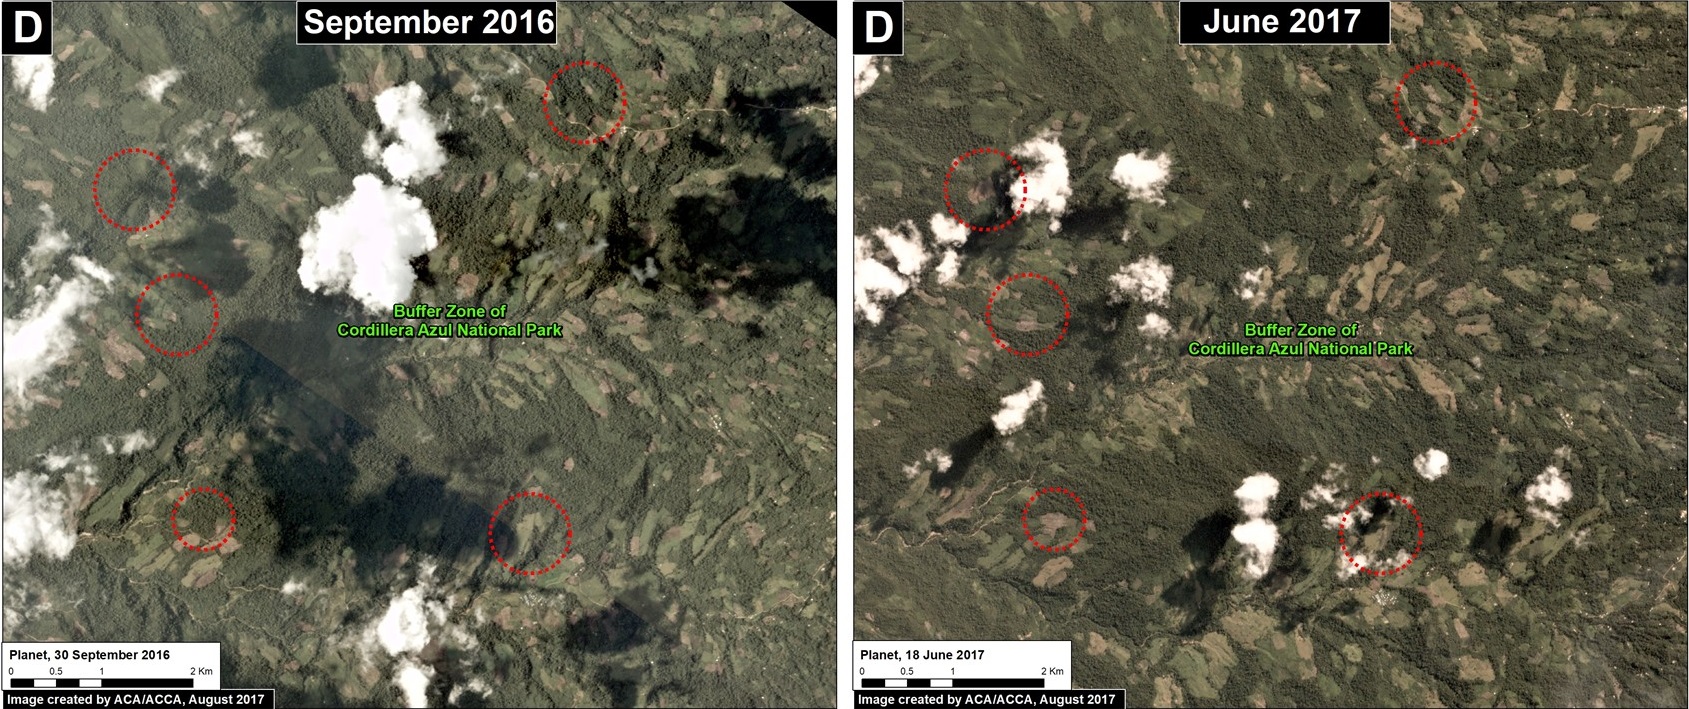
Inset D shows an area of medium intensity deforestation in the buffer zone of Cordillera Azul National Park, in the central Peruvian Amazon (San Martin region). Image 65d shows an example of the deforestation (138 acres) in this area in 2017. The main cause of the deforestation appears to be agricultural activity.

Image 65d. Data: Planet

Northwest Border with Colombia

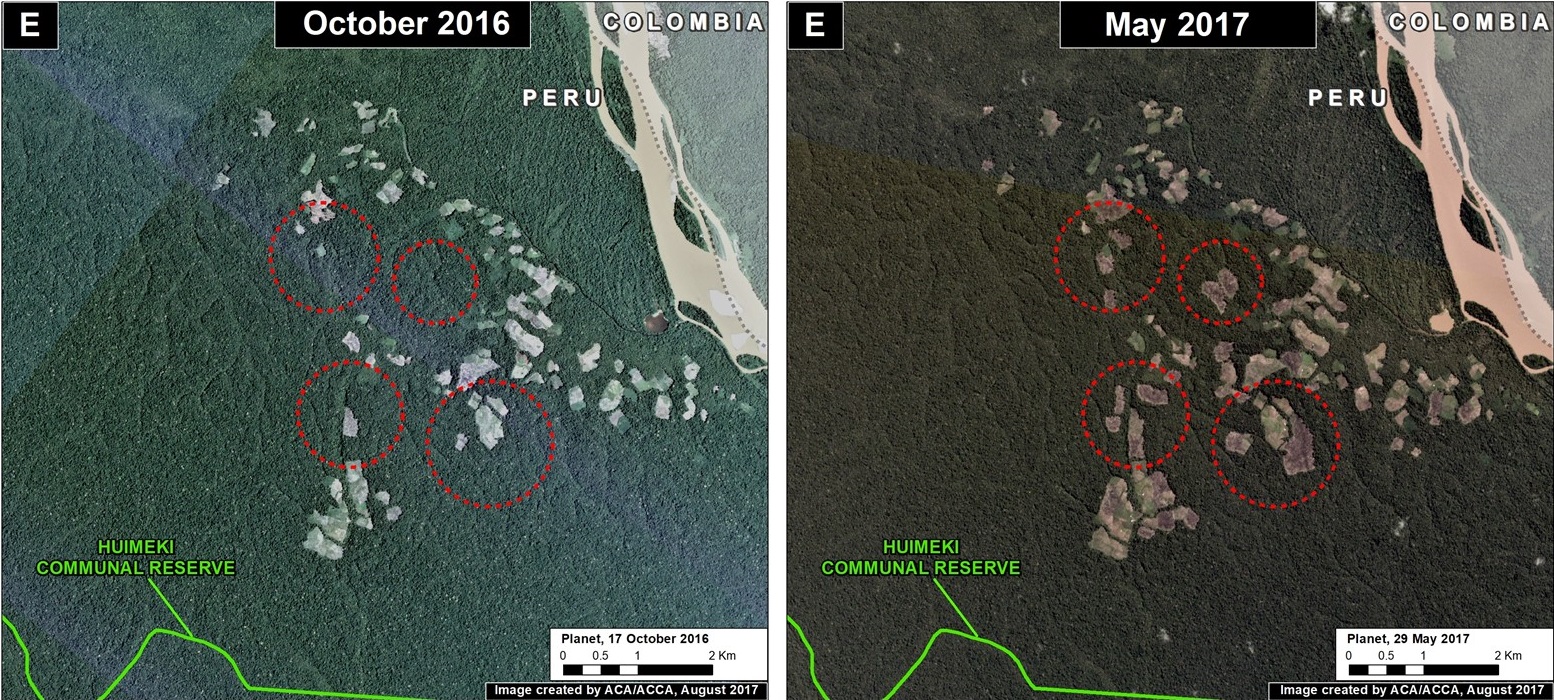
Inset E indicates a medium intensity hotspot in the extreme northern Peruvian Amazon (Loreto region), along the border with Colombia. The deforestation is approaching the limit of the Huimeki Communal Reserve. Image 65e shows the deforestation of 390 acres (158 hectares) in this area in 2017. The driver appears to be linked to agricultural activities and illicit crops (The United Nations has confirmed coca in this area).

Image 65e. Data: Planet

Notes

*GLAD alerts are a powerful new tool to monitor tropical forest loss in near real-time. This early warning system, created by the GLAD (Global Land Analysis and Discovery) laboratory at the University of Maryland and supported by Global Forest Watch, was launched in March 2016 as the first Landsat-based (30-meter resolution) forest loss alert system (previous systems were based on lower-resolution imagery). The alerts are updated weekly and can be accessed through Global Forest Watch.

**We performed a kernel density estimation, an analysis that calculates the magnitude per unit area of a particular phenomenon, in this case, forest loss.

Reference

Planet Team (2017). Planet Application Program Interface: In Space for Life on Earth. San Francisco, CA. https://api.planet.com.

Citation

Novoa S, Finer M (2017) Deforestation Hotspots in the Peruvian Amazon in 2017. MAAP: 65.


MAAP 59: Power of “Small Satellites” from Planet

Image 59a. Source: Planet

The company Planet is pioneering the use of high-resolution “small satellites” (Image 59a). They are a fraction of the size and cost of traditional satellites, making it possible to produce and launch many as a large fleet. Indeed, Planet now operates 149 small satellites, known as Doves, the largest fleet in history. The Doves capture color imagery at 3-5 meter resolution, and will line up (like a string of pearls) to cover everywhere on Earth’s land area every day.

Over the past year, MAAP* has demonstrated the power of Planet imagery to monitor deforestation and degradation in near real-time in the Amazon. A consistent flow of new, high-resolution imagery is needed for this type of work, making Planet’s fleet model ideal. Below, we provide a recap of key MAAP findings based on Planet imagery, for a diverse set of cases including gold mining, agriculture deforestation, logging roads, wildfire, blowdowns, landslides, and floods.**

*MAAP has been fortunate to have access to Planet imagery via the Ambassador program.
**Note: In the images below, the red dot () indicates the same location across time between panels.

Illegal Gold Mining

Image 59b. Data: Planet, SERNANP

We used Planet imagery to closely track the recent illegal gold mining invasion of Tambopata National Reserve, a mega-diverse protected area in the southern Peruvian Amazon. Image 59b is a GIF showing the full invasion: from the initial invasion in January 2016, to subsequent deforestation advances in July and November 2016, and the most recent image in March 2017. The total deforestation from the invasion is over 1,235 acres. These images were an important resource for authorities, civil society, and the media responding to the situation.

Illegal Agriculture Deforestation

Image 59c. Data: Planet, SERNANP

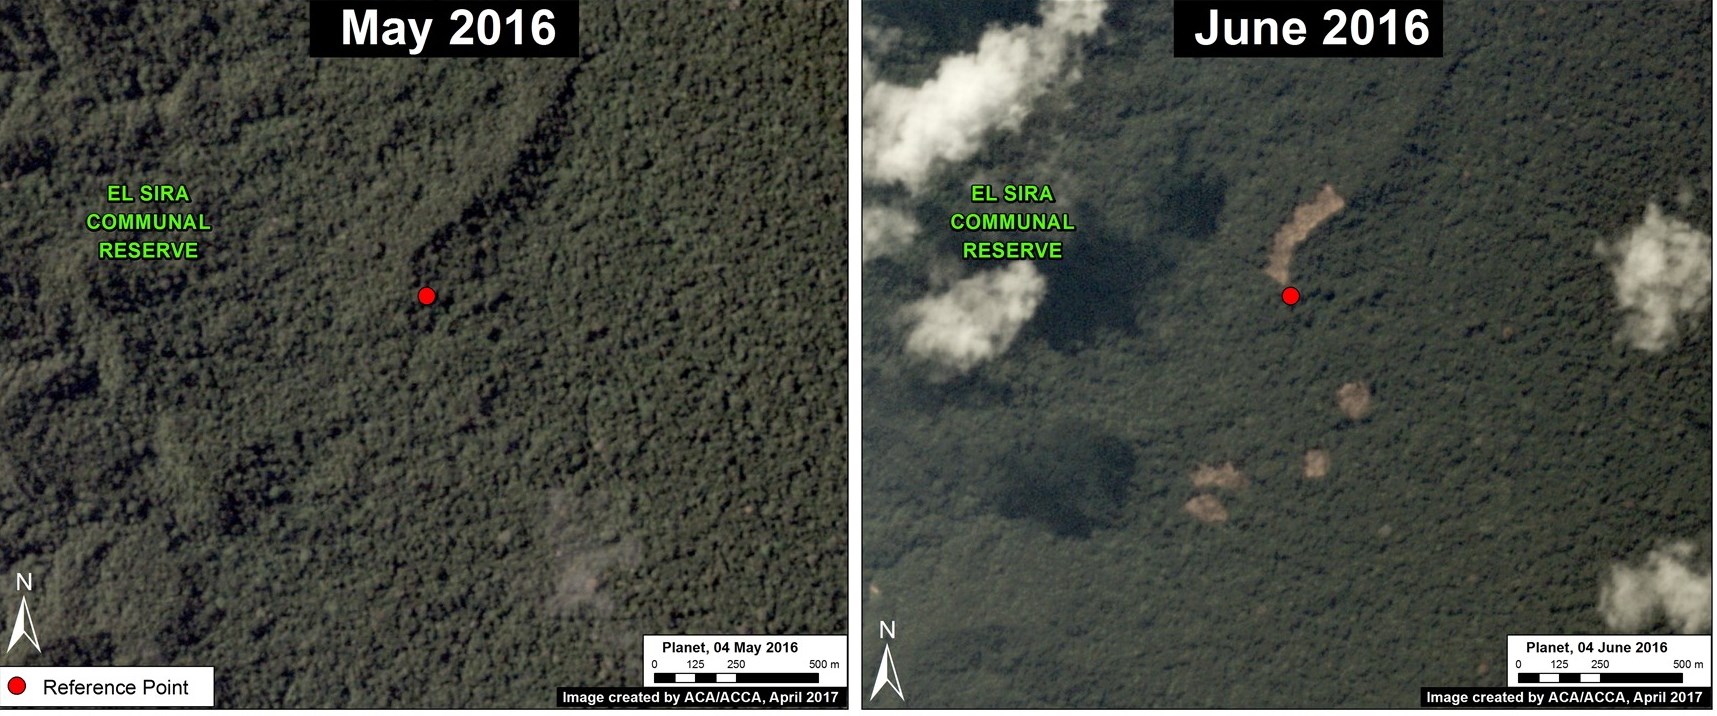
We used Planet imagery to document numerous cases of small-scale deforestation for illegal agricultural practices. These examples are important because, cumulatively, small-scale deforestation represents the vast majority (80%) of forest loss events in the Peruvian Amazon (see MAAP Synthesis #2). Image 59c shows the rapid appearance of several new agricultural plots between May (left panel) and June (right panel) 2016 within an important natural protected area in the central Peruvian Amazon, El Sira Communal Reserve.

Logging Roads

Image 59d. Data: Planet

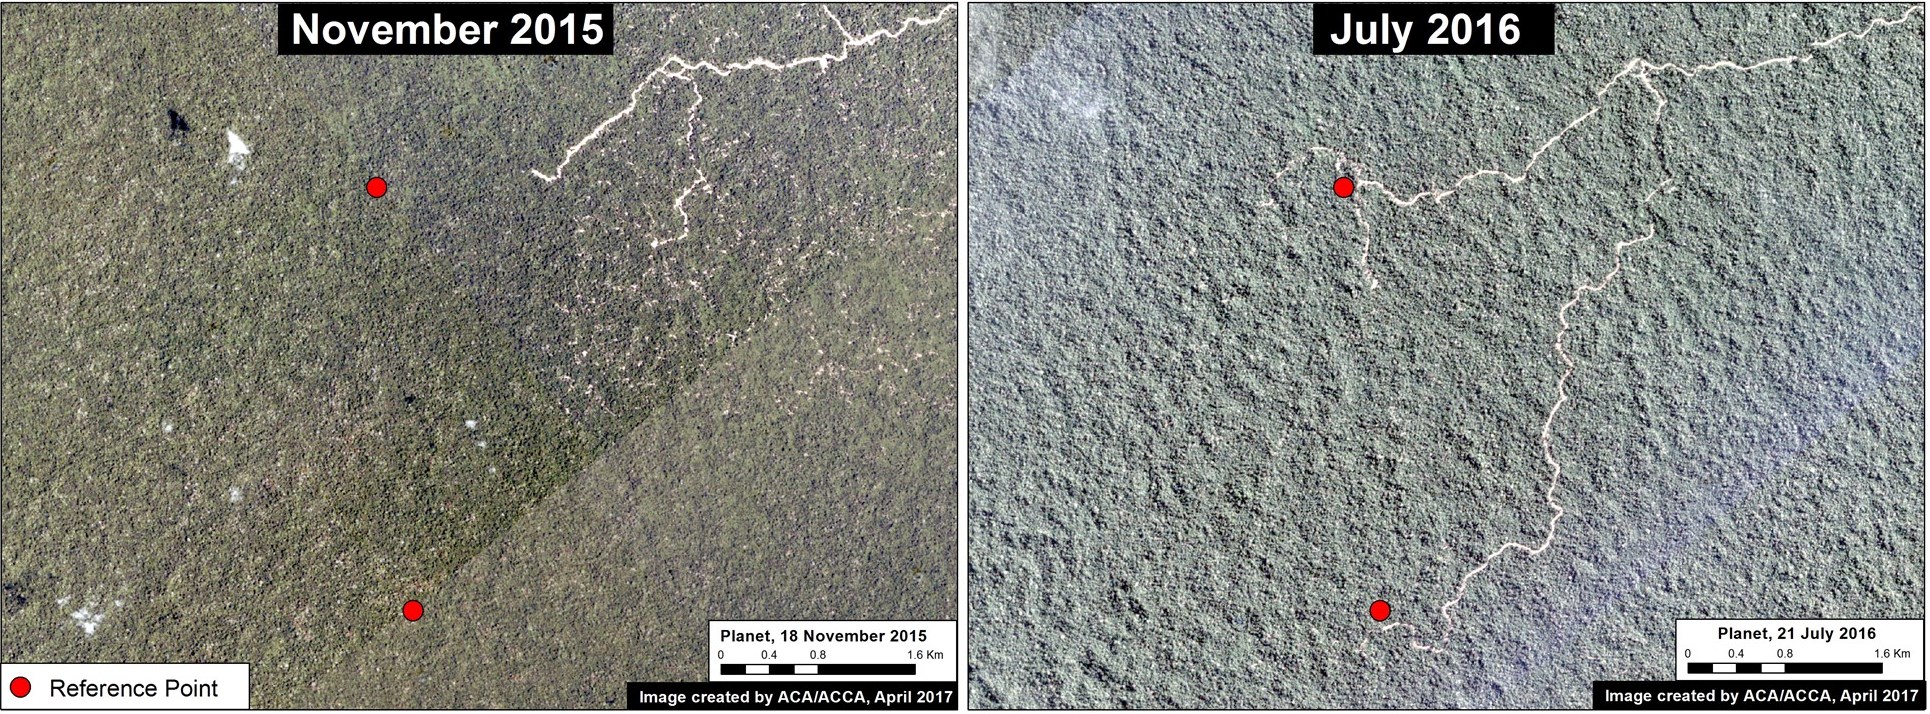
We used Planet imagery to show the rapid construction of logging roads. For example, Image 59d shows the construction of a logging road in the buffer zone of an important national park in the central Peruvian Amazon (Cordillera Azul) between November 2015 (left panel) and July 2016 (right panel).

Wildfire

Image 59e. Data: Planet

Planet imagery was also an important resource to monitor the intense wildfires in Peru last year. Image 59e shows forest loss from an escaped agricultural fire in the northern Peruvian Amazon between May (left panel) and October (right panel) 2016. Note the imagery even caught the smoke from the fires in September (middle panel).

Blowdowns

Image 59f. Data: Planet

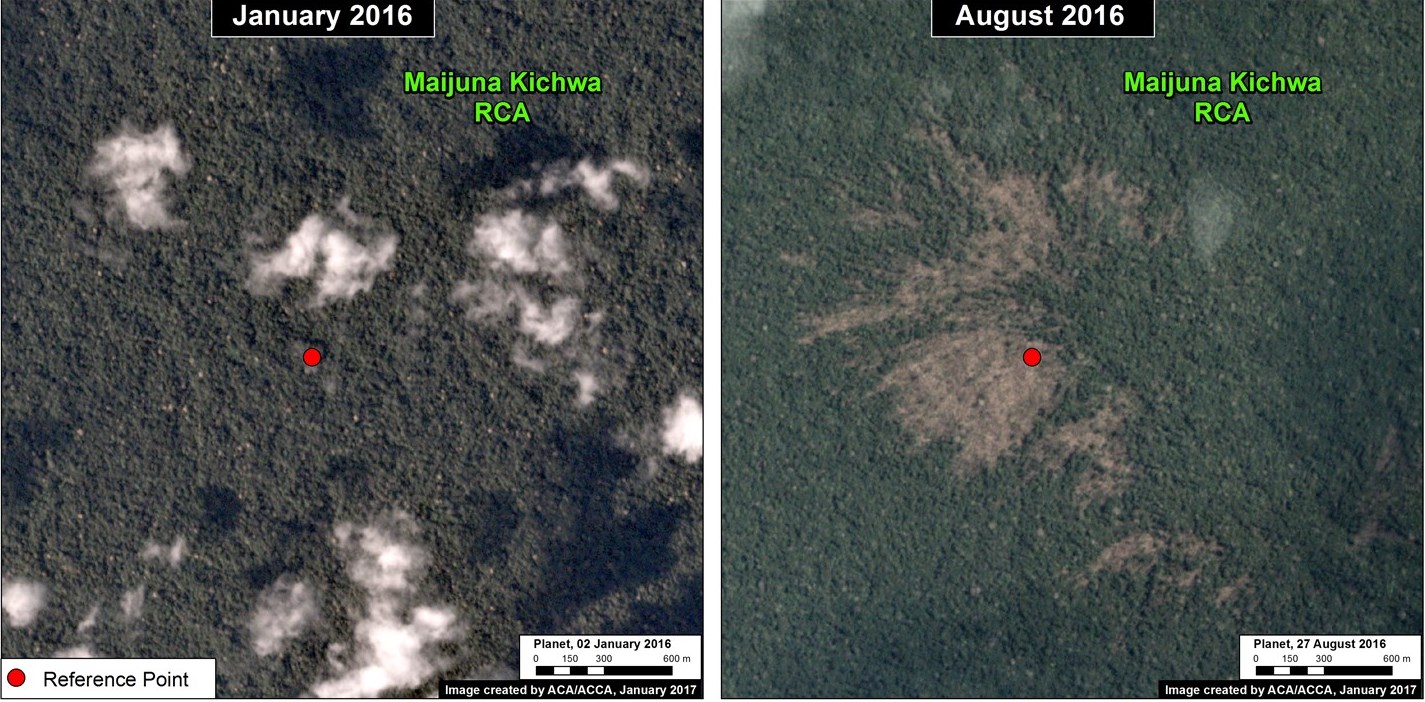
We used Planet to help document a little-known, but important, type of natural forest loss in the Peruvian Amazon: blowdown due to strong winds from localized storms known as “hurricane winds.” Image 59f shows a high-resolution view of a recent major blowdown event between January (left panel) and August (right panel) 2016 in the northern Peruvian Amazon.

Landslides

Image 59g. Data: Planet

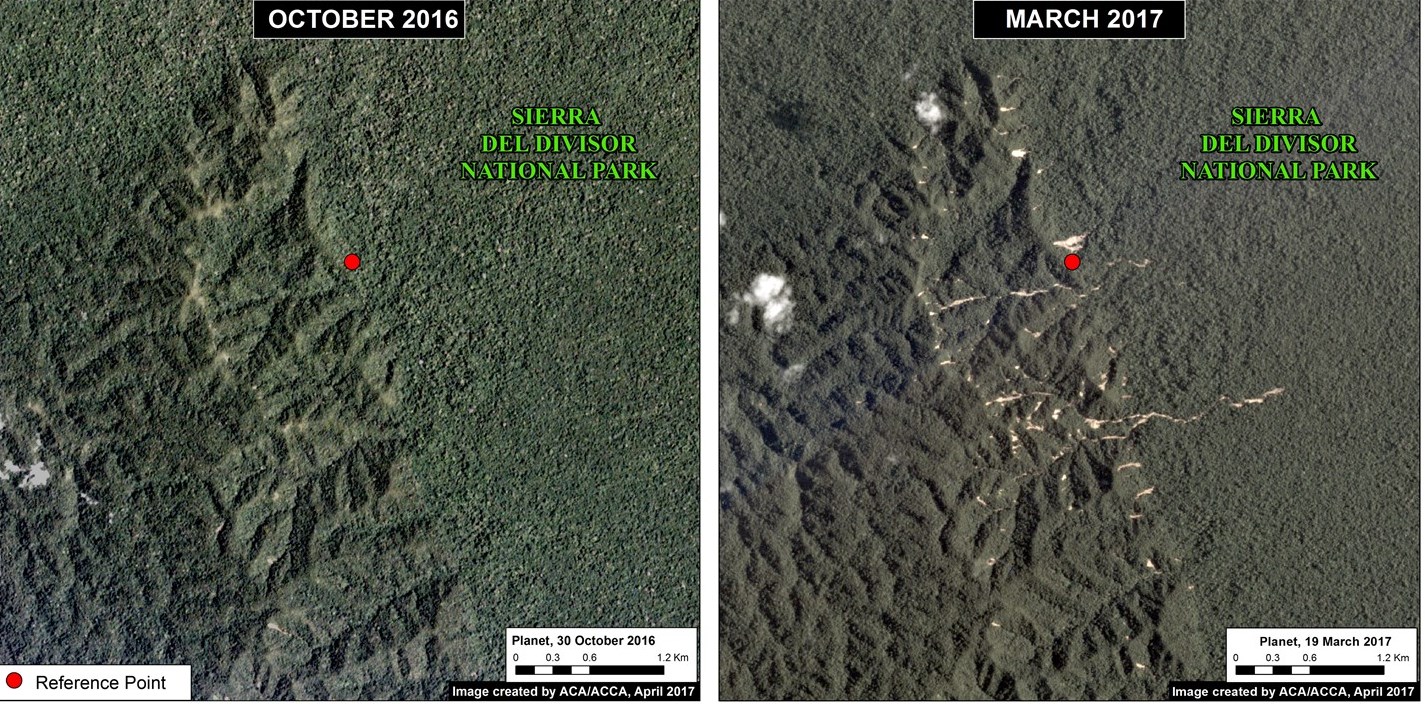
Planet imagery recently revealed an interesting natural phenomenon: a major landslide within a remote, rugged section of Peru’s newest national park, Sierra del Divisor. Image 59g shows the area between October 2016 (left panel) and March 2017 (right panel).

Floods

Image 59h. Data: Planet

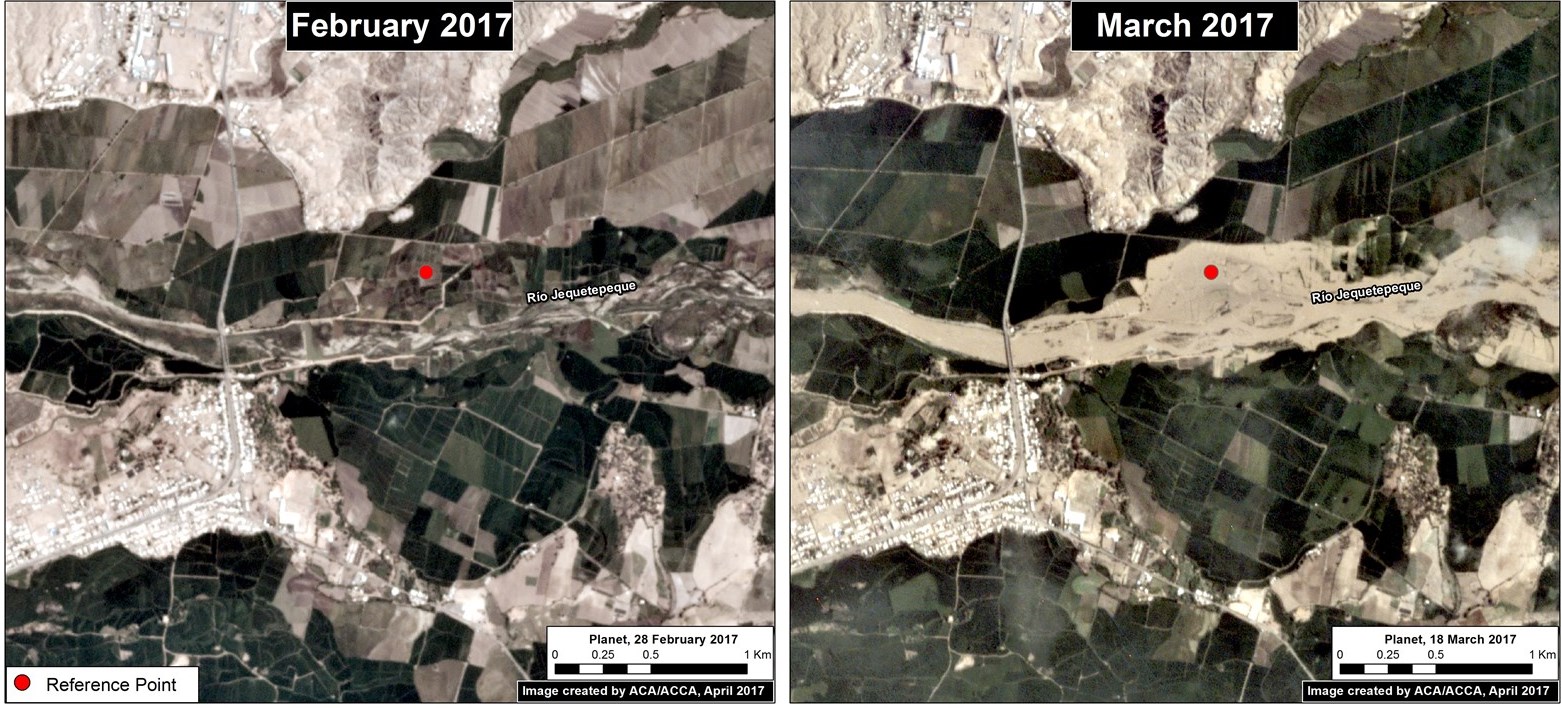
Finally, Planet imagery played a key role in monitoring the impacts of the recent deadly floods that hit the northern Peruvian coast. Image 59h shows the rapid flooding of agricultural plots along a river in northern Peru between February (left panel) and March (right panel) 2017.

References

Planet Team (2017). Planet Application Program Interface: In Space for Life on Earth. San Francisco, CA. https://api.planet.com

Citation

Finer M, Novoa S, Mascaro J (2017) Power of “Small Satellites” from Planet. MAAP: 59.

MAAP #54: Natural forest loss due to “hurricane winds” in the Peruvian Amazon

Image 54. Base Map

A little-known, but not uncommon, type of natural forest loss in the Peruvian Amazon is blowdown due to strong winds from localized storms (locally known as “hurricane winds”).

The intense winds cause a chain reaction of fallen trees, resulting in a fan-shaped pattern of forest loss with a defined orientation following the direction of the storm winds.

This phenomenon has previously been reported in Brazil and Colombia (see References below).

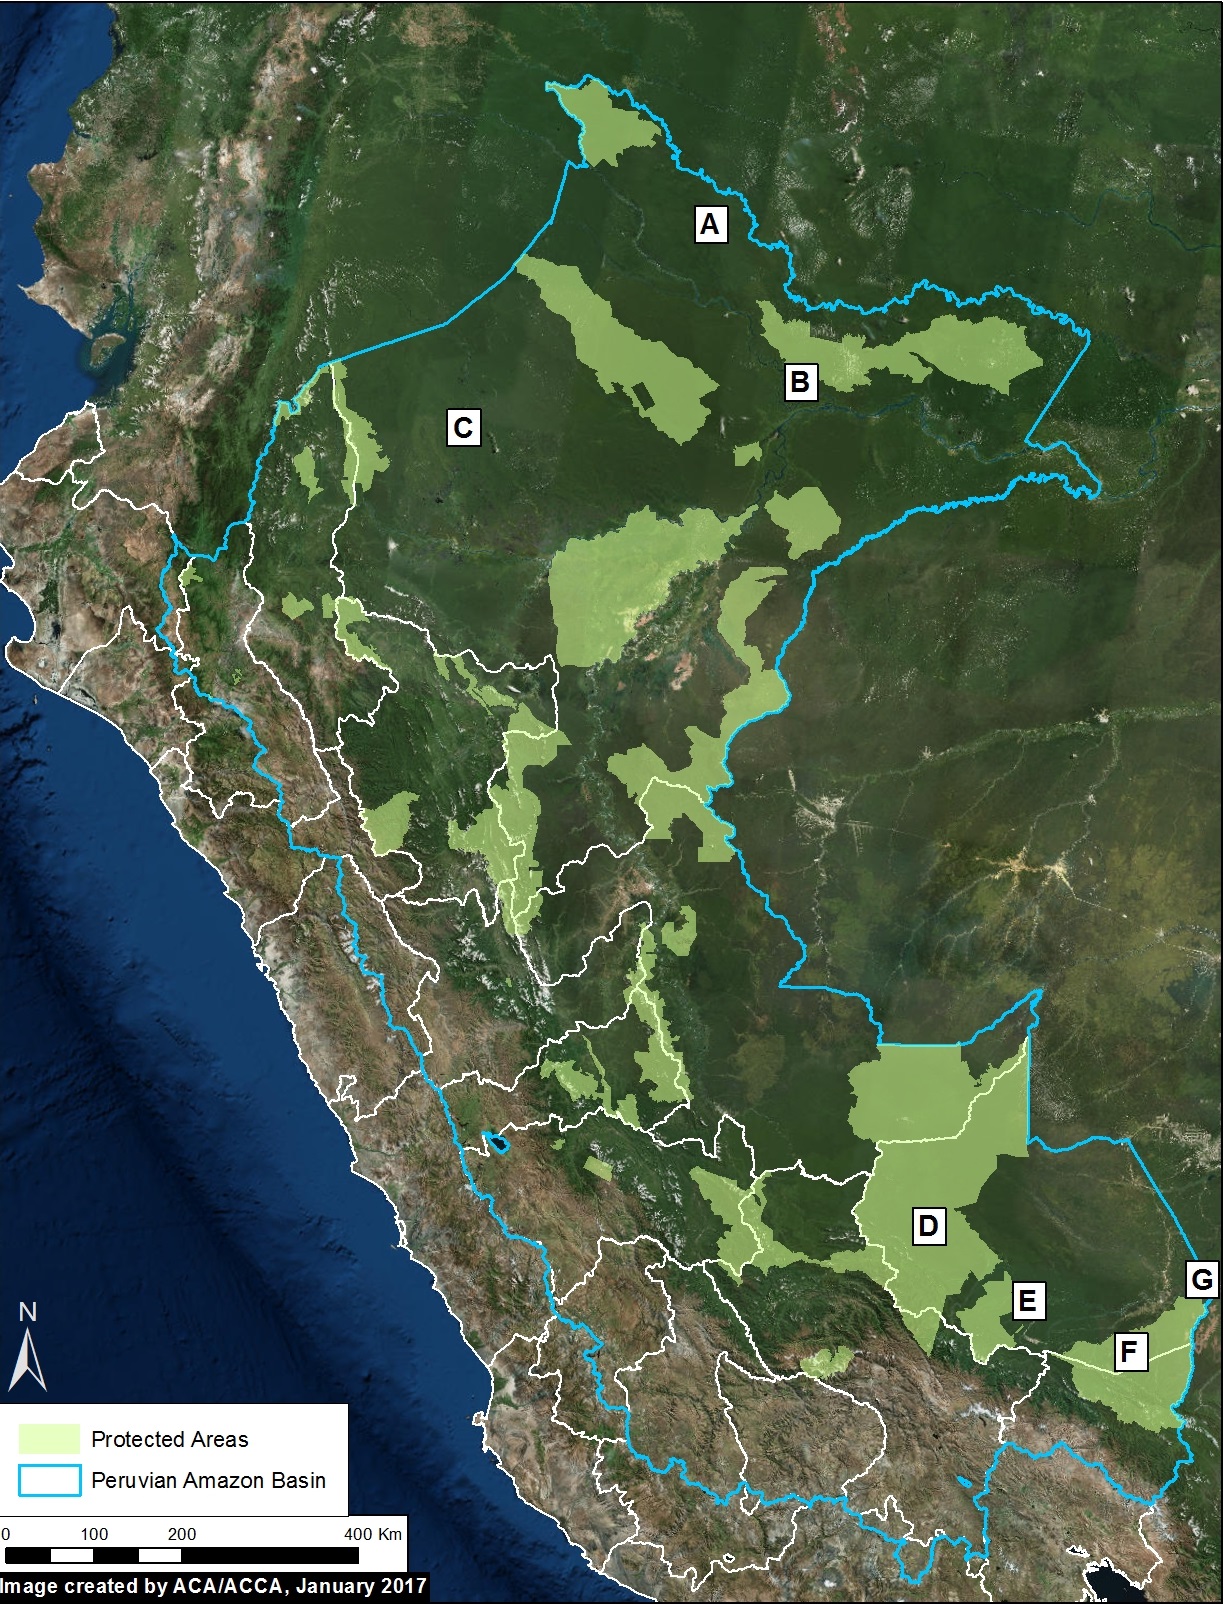
The base image (Image 54) shows the location of some recent (during 2016) examples of forest loss due to blowdowns in the Peruvian Amazon.

These examples were initially detected from analysis of GLAD alerts, early warning tree loss data produced by the University of Maryland (see Annex).

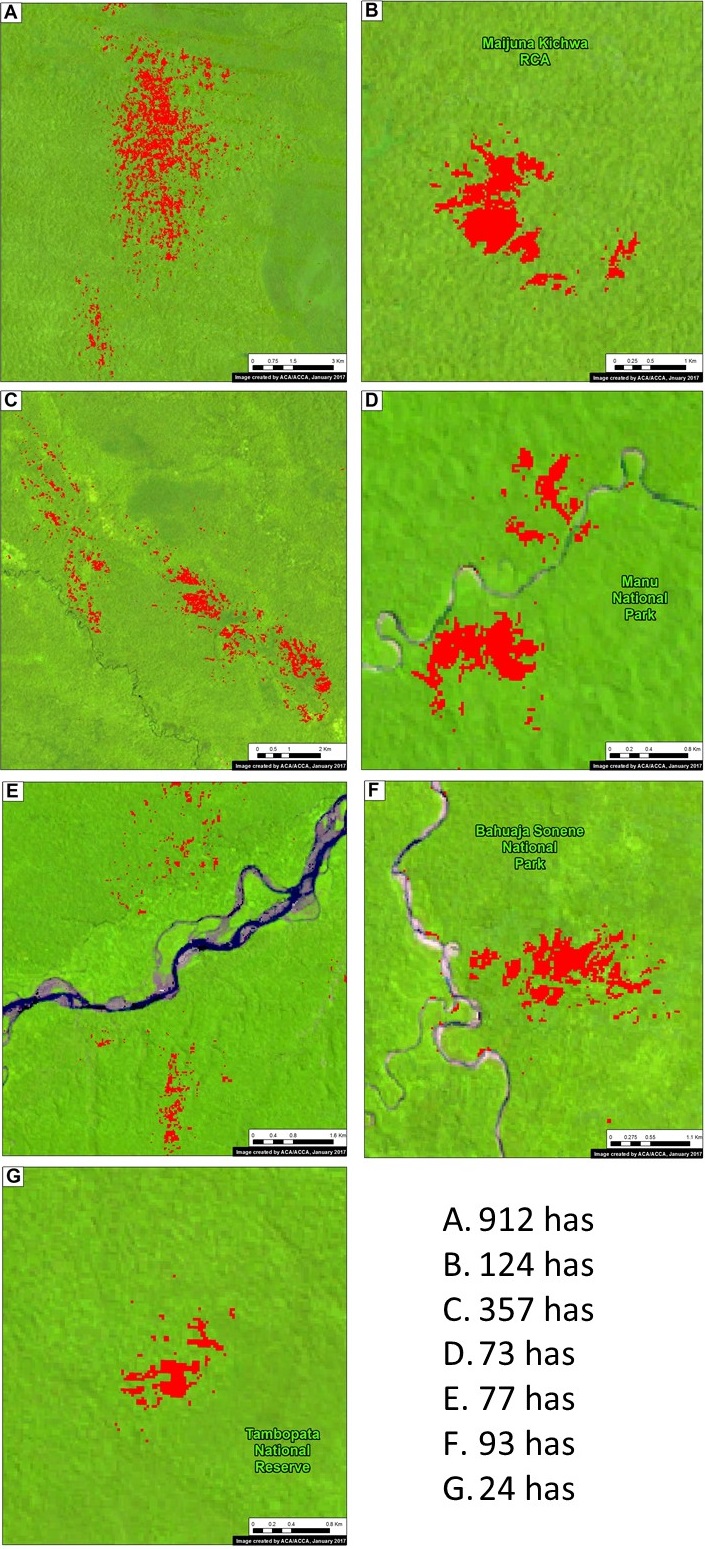
Below, we detail the 7 blowdown examples indicated on the base map. They are located in both northern (Loreto region) and southern (Madre de Dios region) Peru, and include 4 Protected Areas. The forest loss in these examples ranged from 24 to 900 hectares.


Loreto Examples

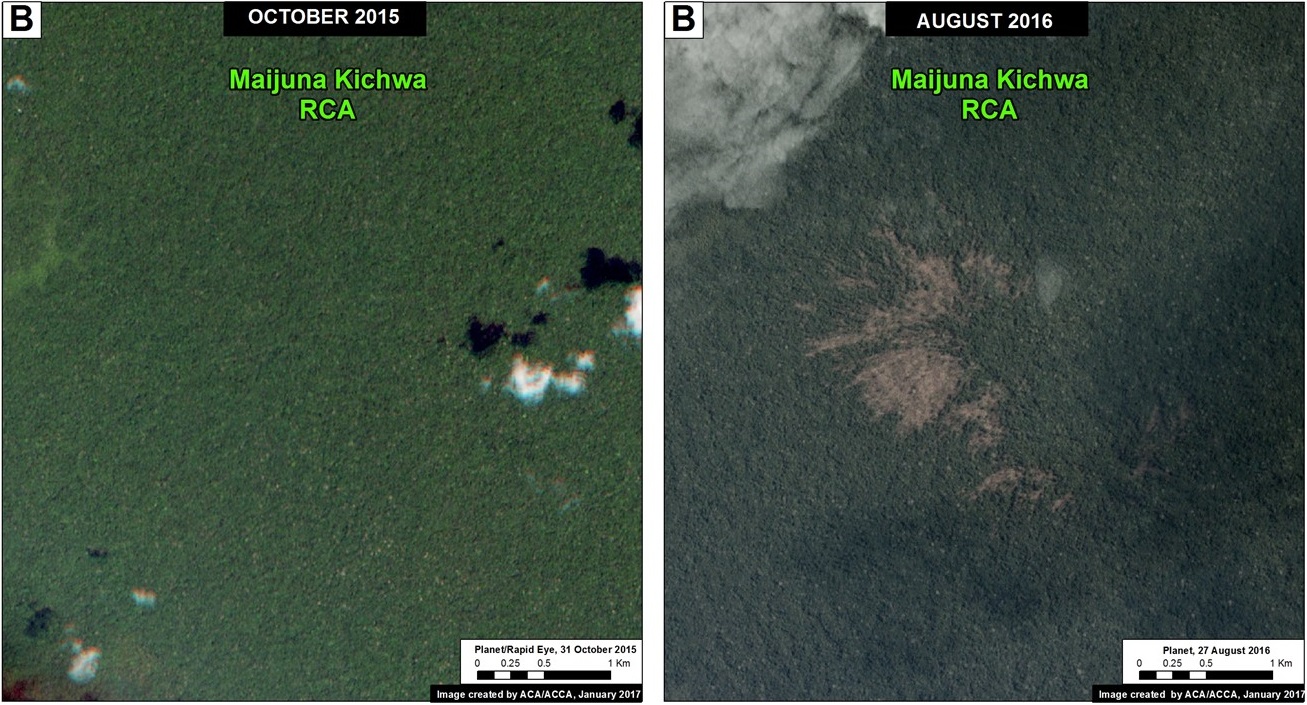
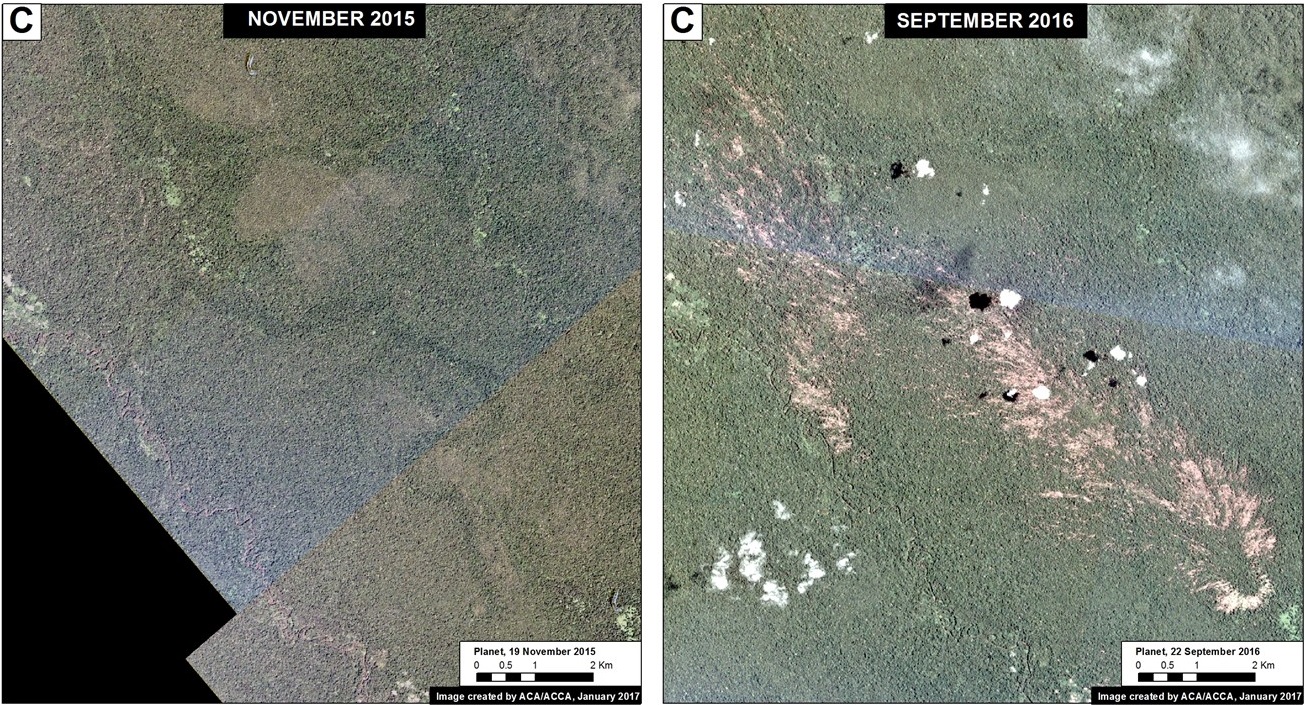
This section highlights 3 examples of blowdowns in Loreto. In each example, we show an image of before (left panel) and after (right panel) the forest loss due to the winds. The documented forest loss in these areas includes: 912 hectares in Example A, 124 hectares in Example B (Ampiyacu Apayacu Regional Conservation Area), and 357 hectares in Example C.

Image 54a. Data: Planet.
Image 54b. Data: Planet. Note: Blowdown in Ampiyacu Apayacu RCA, not Maijuna.


Image 54c. Data: Planet.

Madre de Dios Examples

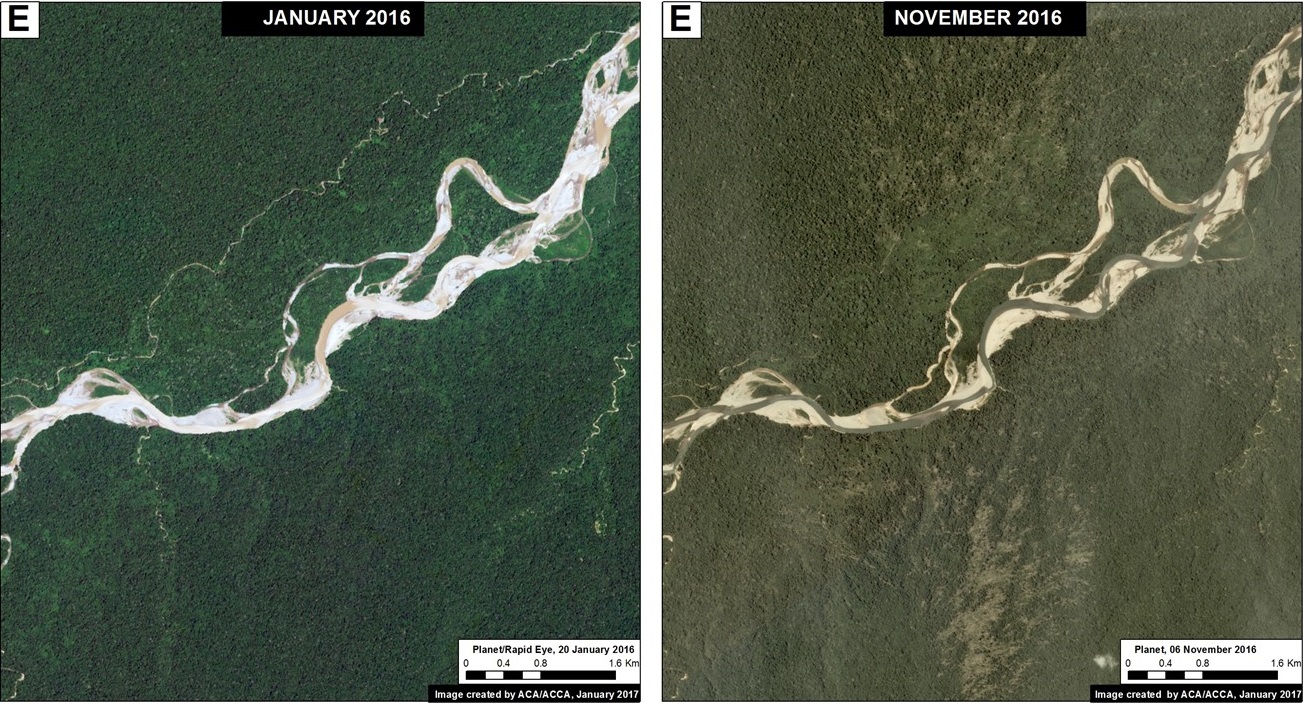
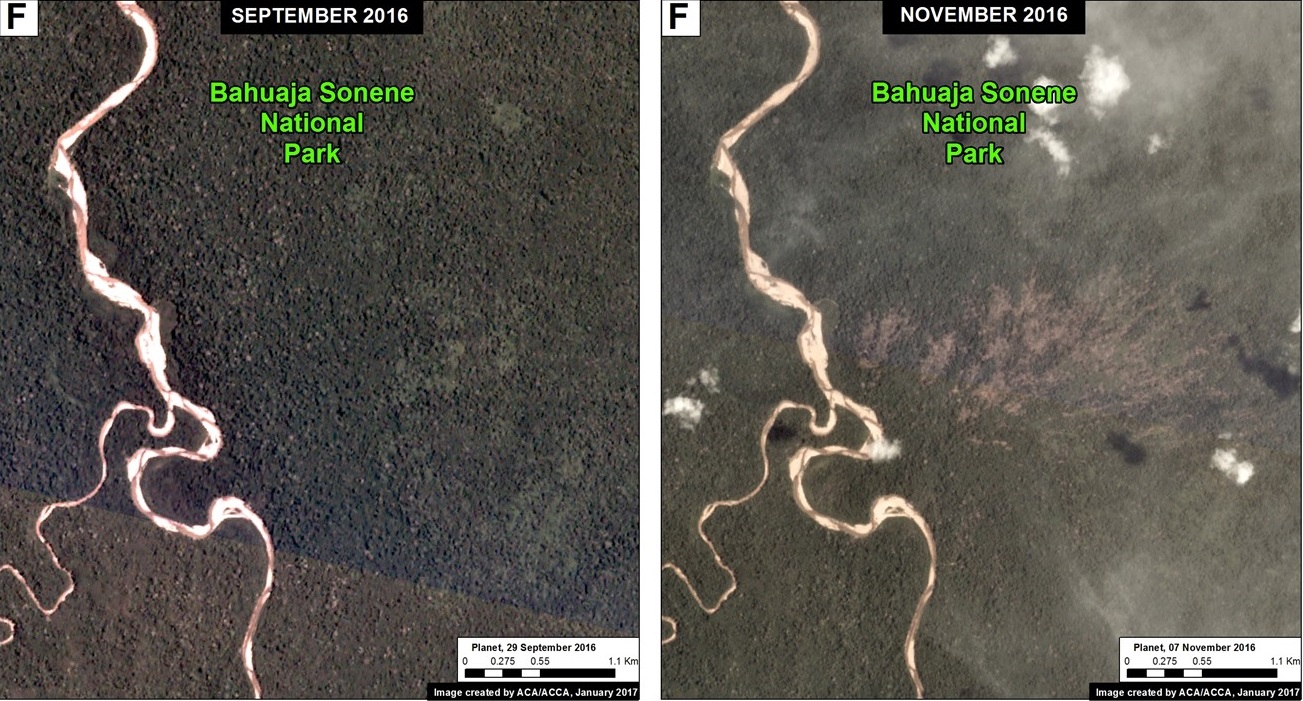
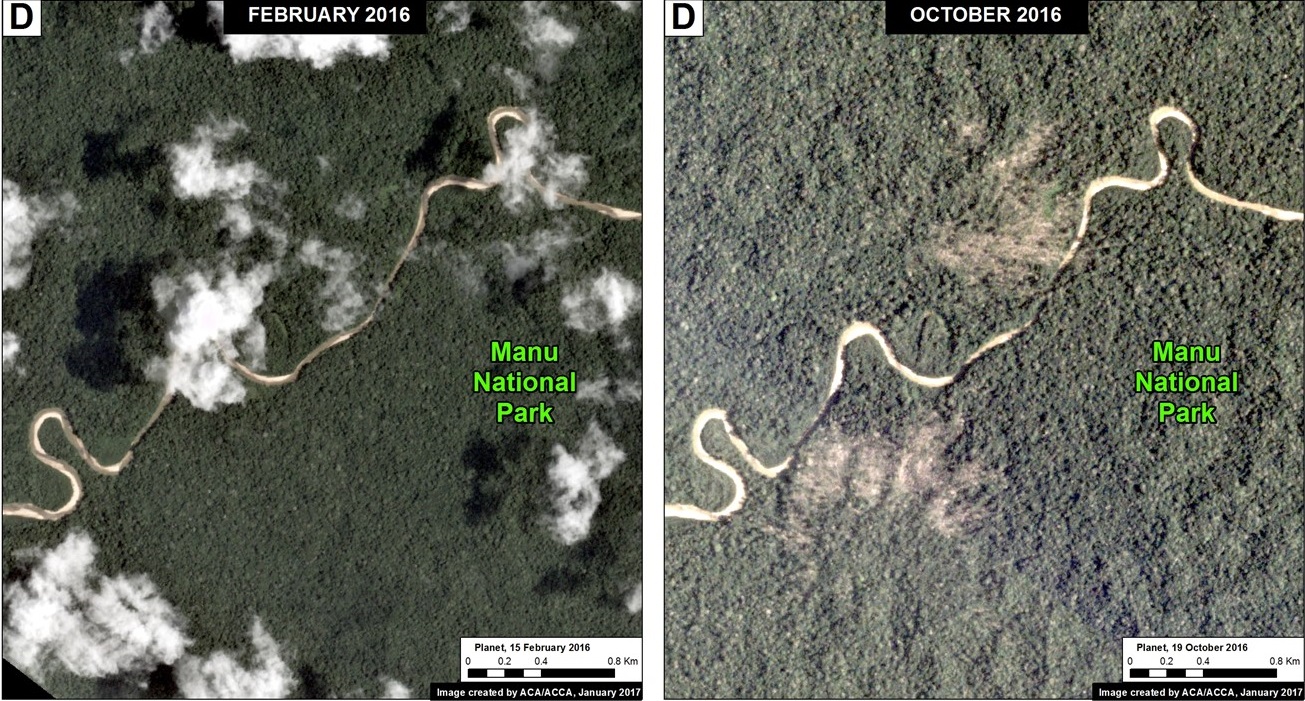
This section highlights 4 examples of blowdowns in Madre de Dios. In each example, we show an image of before (left panel) and after (right panel) the forest loss due to the winds. The documented forest loss in these areas includes: 73 hectares in Example D (Manu National Park), 77 hectares in Example E, 93 hectares in Example F (Bahuaja Sonene National Park), and 24 hectares in Example G (Tambopata National Reserve).

Image 54d. Data: Planet.
Image 54e. Data: Planet.


Image 54f. Data: Planet.


Image 54g. Data: Planet.

Annex

This last image shows how the tree loss patterns from blowdowns appear in the GLAD alerts.

Coordinates

A.      -1.386944, -73.679444
B.      -3.029722, -72.786666
C.      -3.456111, -76.713333
F.       -13.294722, -69.295833

References

Planet Team (2017). Planet Application Program Interface: In Space for Life on Earth. San Francisco, CA. https://api.planet.com

Espırito-Santo, F. D. B. et al. Storm intensity and old-growth forest disturbances in the Amazon region. Geophys. Res. Lett. 37, L11403 (2010).

Nelson, B. W. et al. Forest disturbance by large blowdowns in the Brazilian Amazon. Ecology 75, 853–858 (1994).

Garstang, M., White, S., Shugart, H. H. & Halverson, J. Convective cloud downdrafts as the cause of large blowdowns in the Amazon rainforest. Meteorol. Atmos. Phys. 67, 199–212 (1998).

Etter y Botero (1990) Efectos de los procesos climáticos y geomorfológicos en la dinámica del Bosque Húmedo Tropical de la Amazonía Colombiana. Colombia Amazonica 4:7.

Citation

Novoa S, Finer M (2017) Natural forest loss due to “hurricane winds” in the Peruvian Amazon. MAAP: 54.