MAAP #35: Confirming Amazon Deforestation by United Cacao in 2013 [High Res View]

To date, we have published 4 MAAP articles* tracking deforestation by the company United Cacao in the northern Peruvian Amazon (outside the town of Tamshiyacu in the Loreto region). In these articles, based on analysis of satellite imagery, we have documented the deforestation of 2,380 hectares (5,880 acres) related to this project.

The company, however, continues to deny this deforestation**. In general, their main response seems to be that the land in question had been deforested for previous agricultural projects prior to their arrival in 2013.

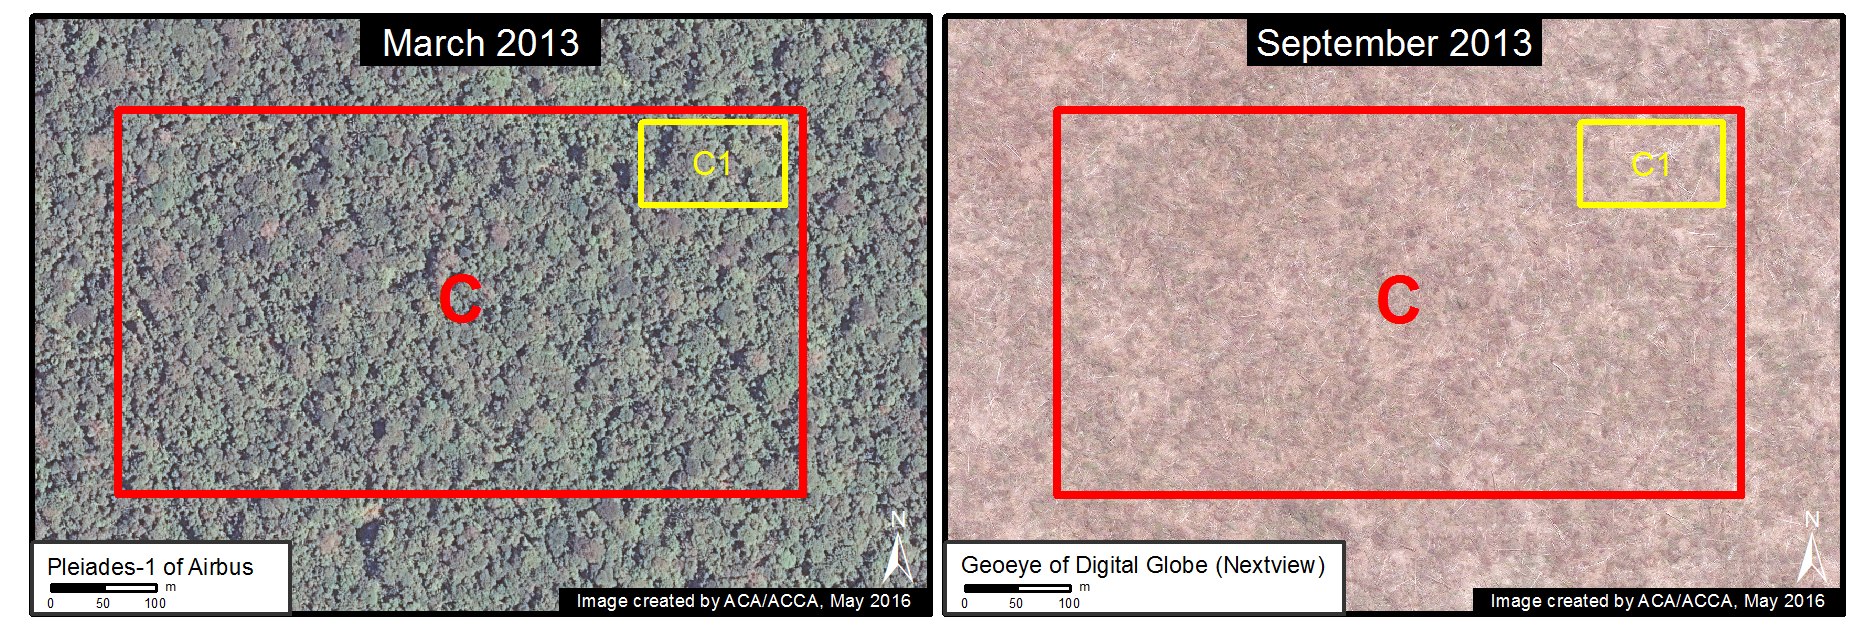
Here in MAAP #35, we show definitively that this assertion simply does not match the satellite evidence. This article is based on analysis of recently-acquired satellite images from early 2013, the time period that the cacao project began. These images show, in extremely high resolution, the large-scale deforestation of primary forest in the project area between March and September 2013.*** Click each image to enlarge.

It is important to resolve the deforestation-related issues because the company has plans to expand its agricultural land bank in the coming years. Please see this recent statement from the Peruvian Forestry Service (SERFOR) for details on the legal aspect of this case.

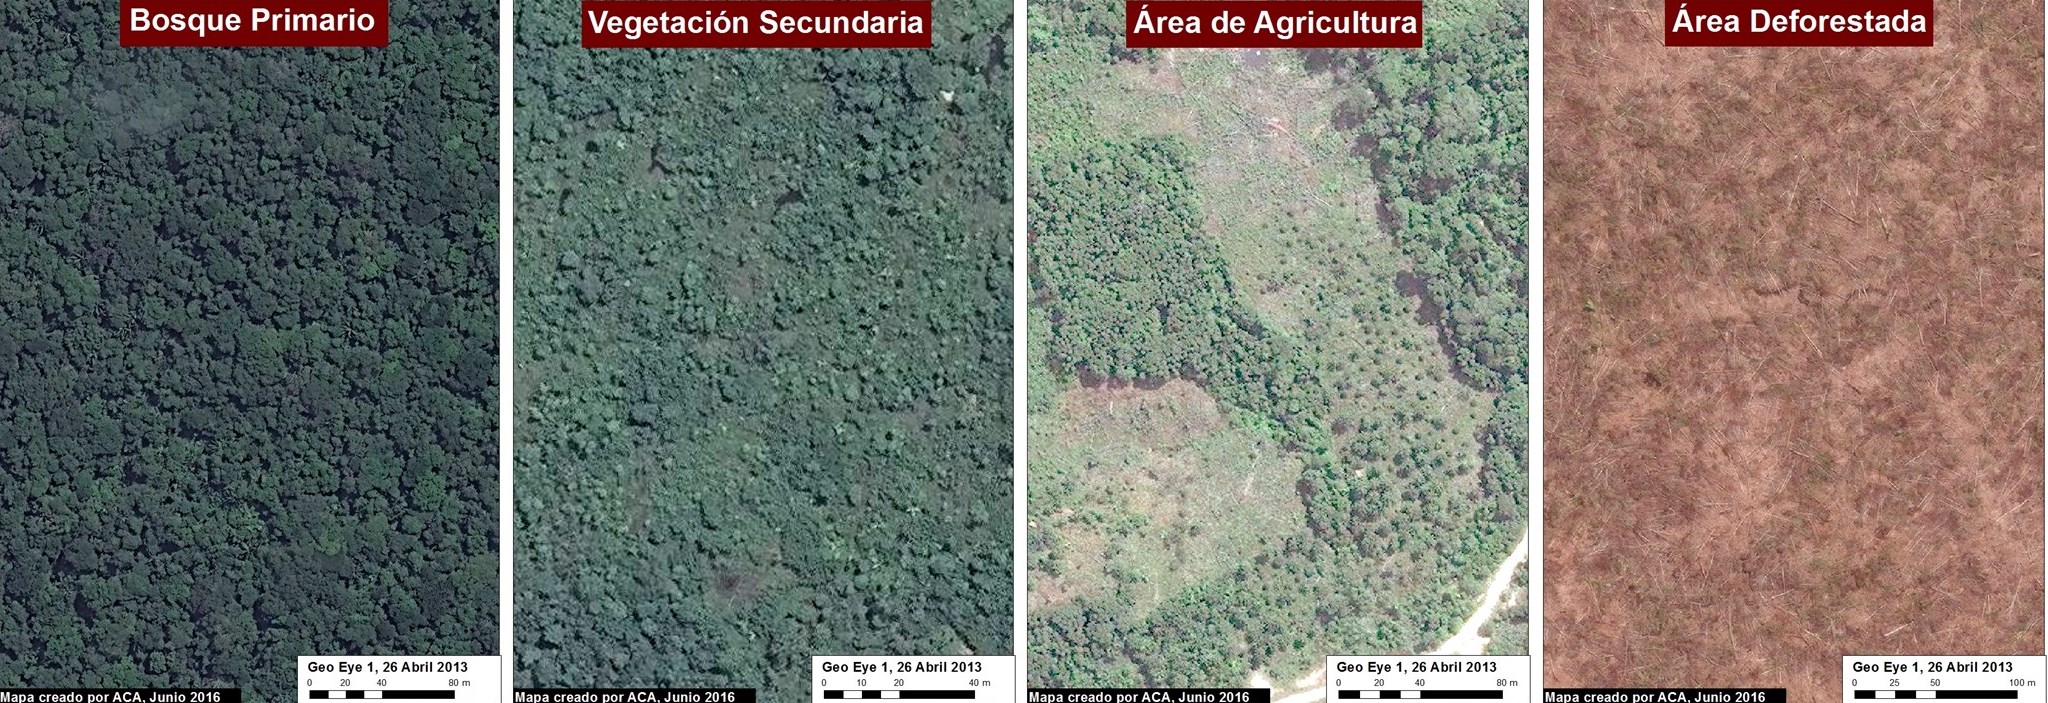
As a reference, at the end of the article there is a graphic (Image 35l) illustrating the difference (as seen in high-resolution imagery) between primary forest, secondary vegetation, agricultural areas, and deforested areas.

New Evidence of Large-Scale Deforestation in 2013

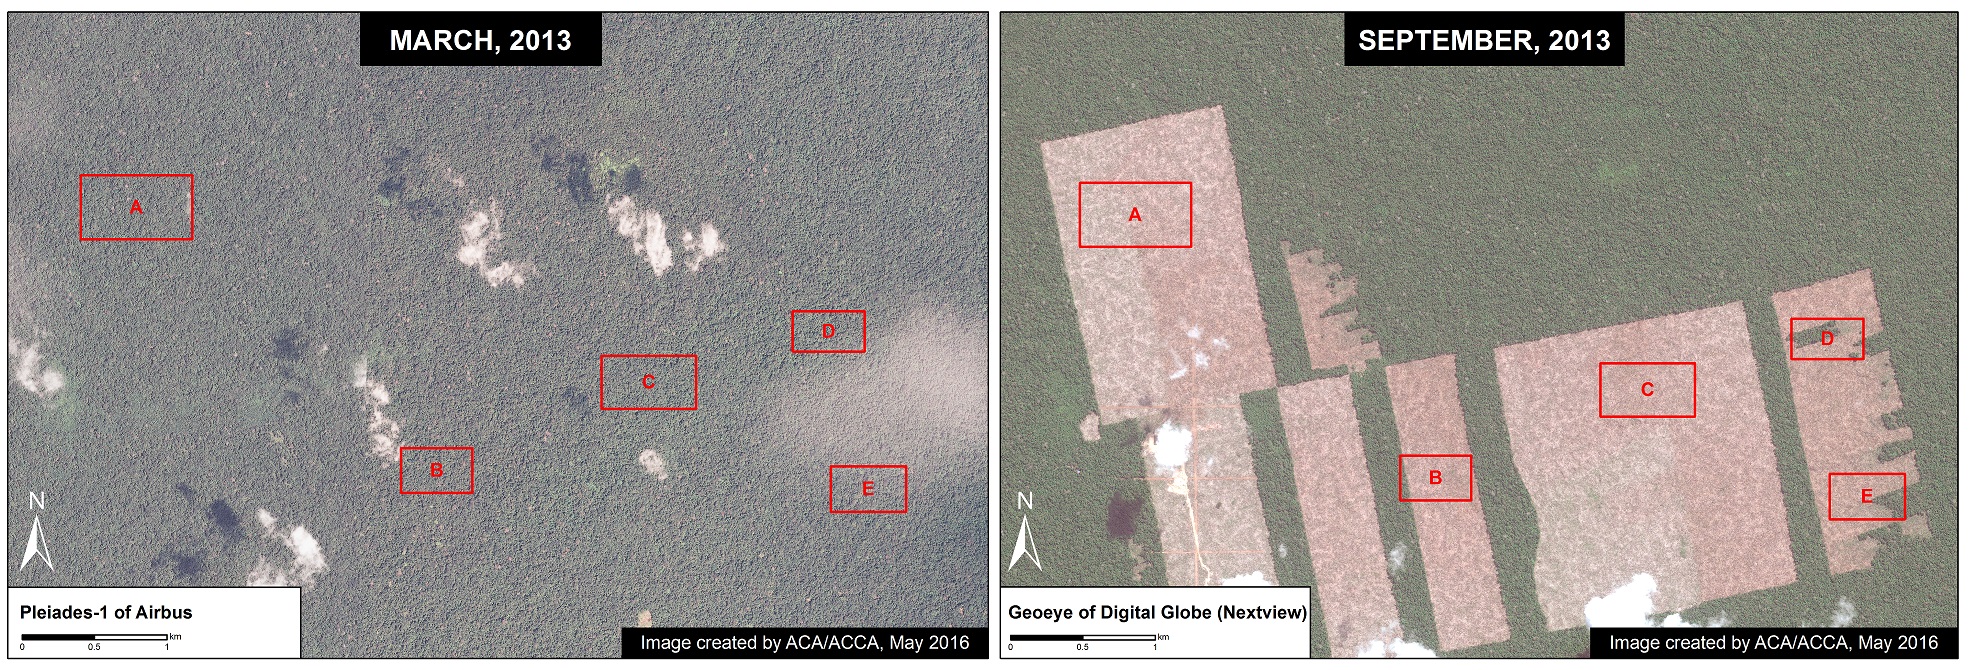
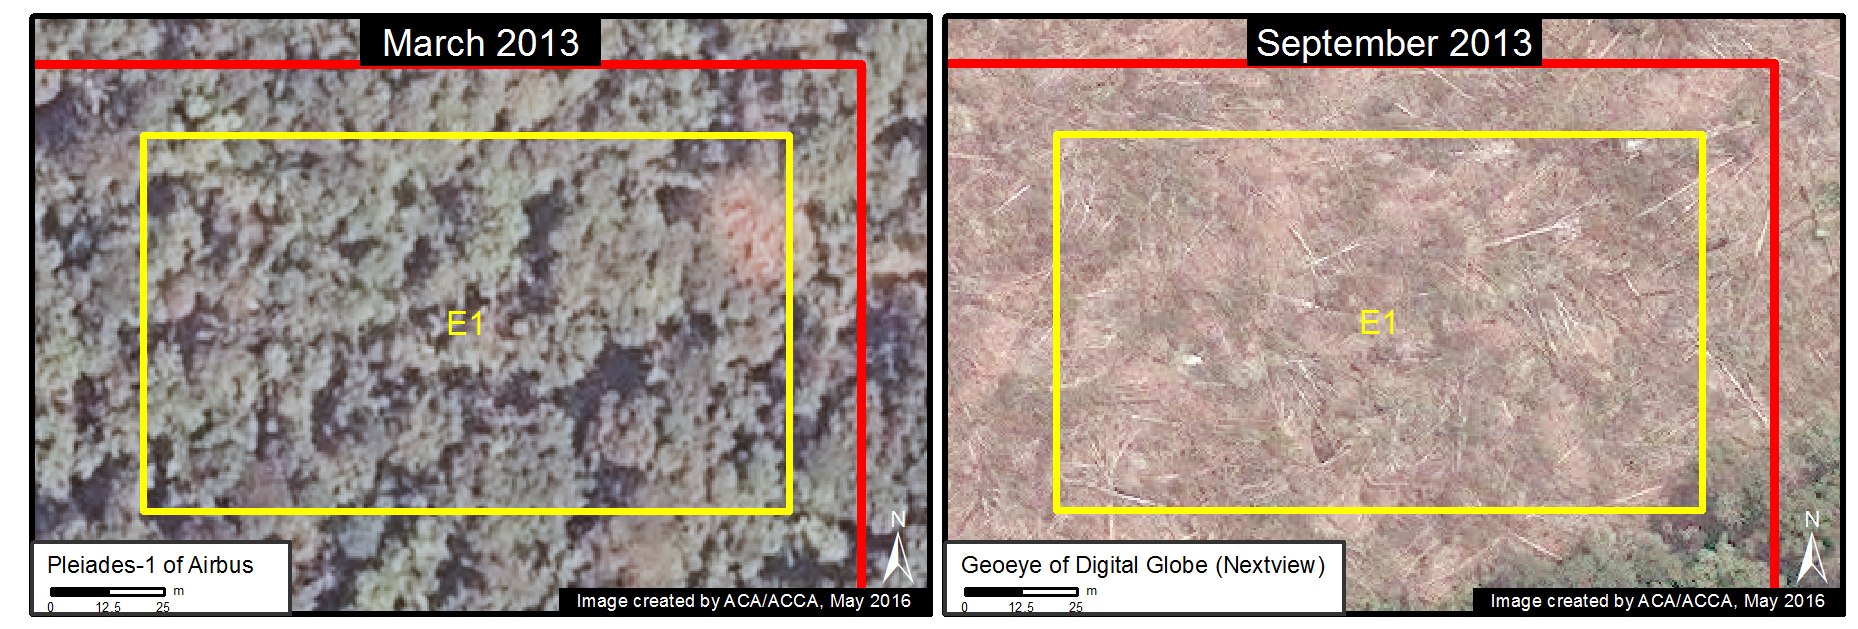
We recently obtained high-resolution satellite imagery from March 25, 2013, immediately before the beginning of the deforestation for the cacao project. Image 35a shows the same exact project area between March (left panel) and September (right panel) 2013. In March, the project area is predominantly covered with primary forest*** and contains only a few scattered patches of previously disturbed land. In contrast, in September, the project area is clearly undergoing a large-scale deforestation event (1,100 hectares at that time).

tamshiyacu2
Image 35a. Data: Airbus, Digital Globe (Nextview)

Zoom A

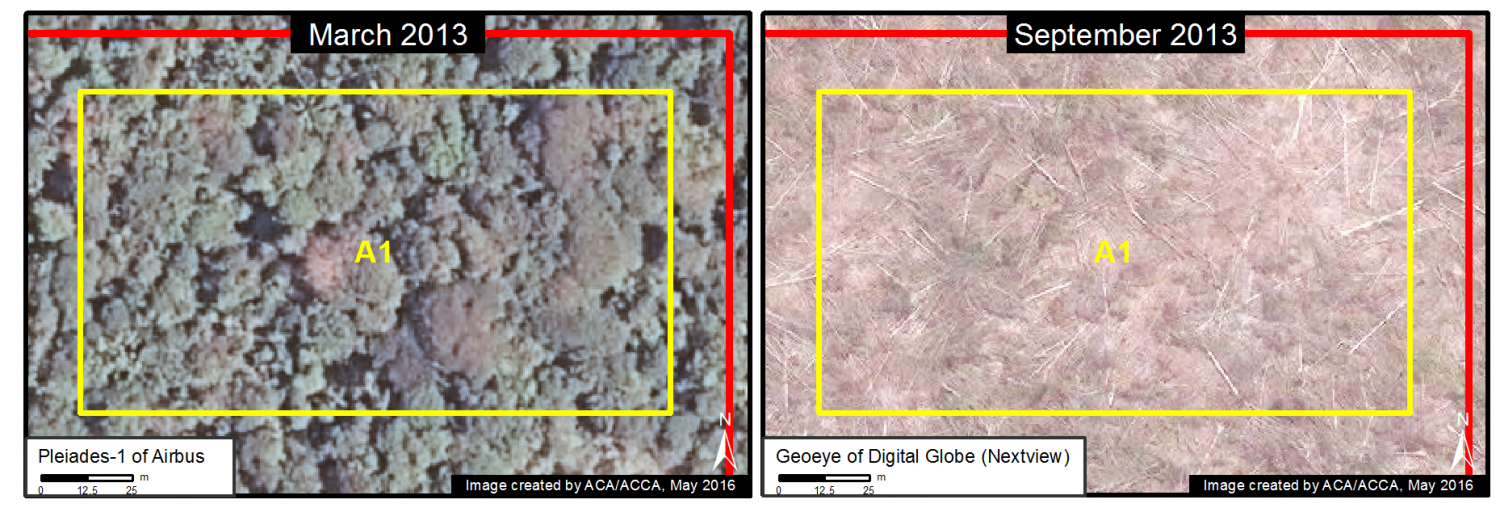
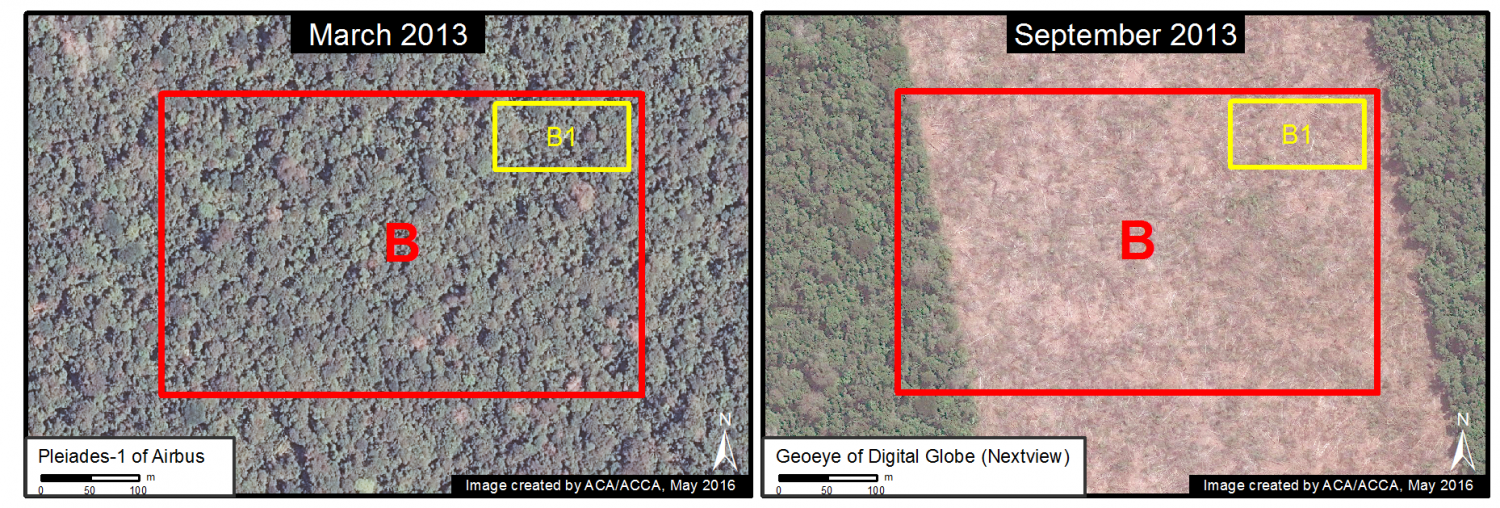
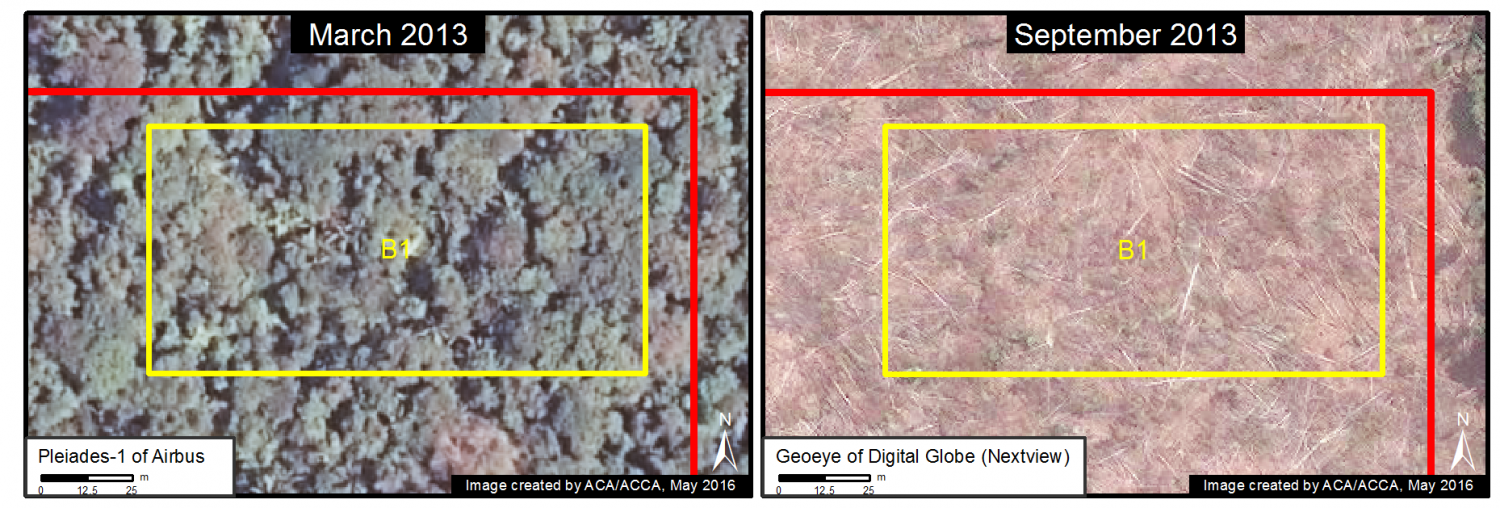
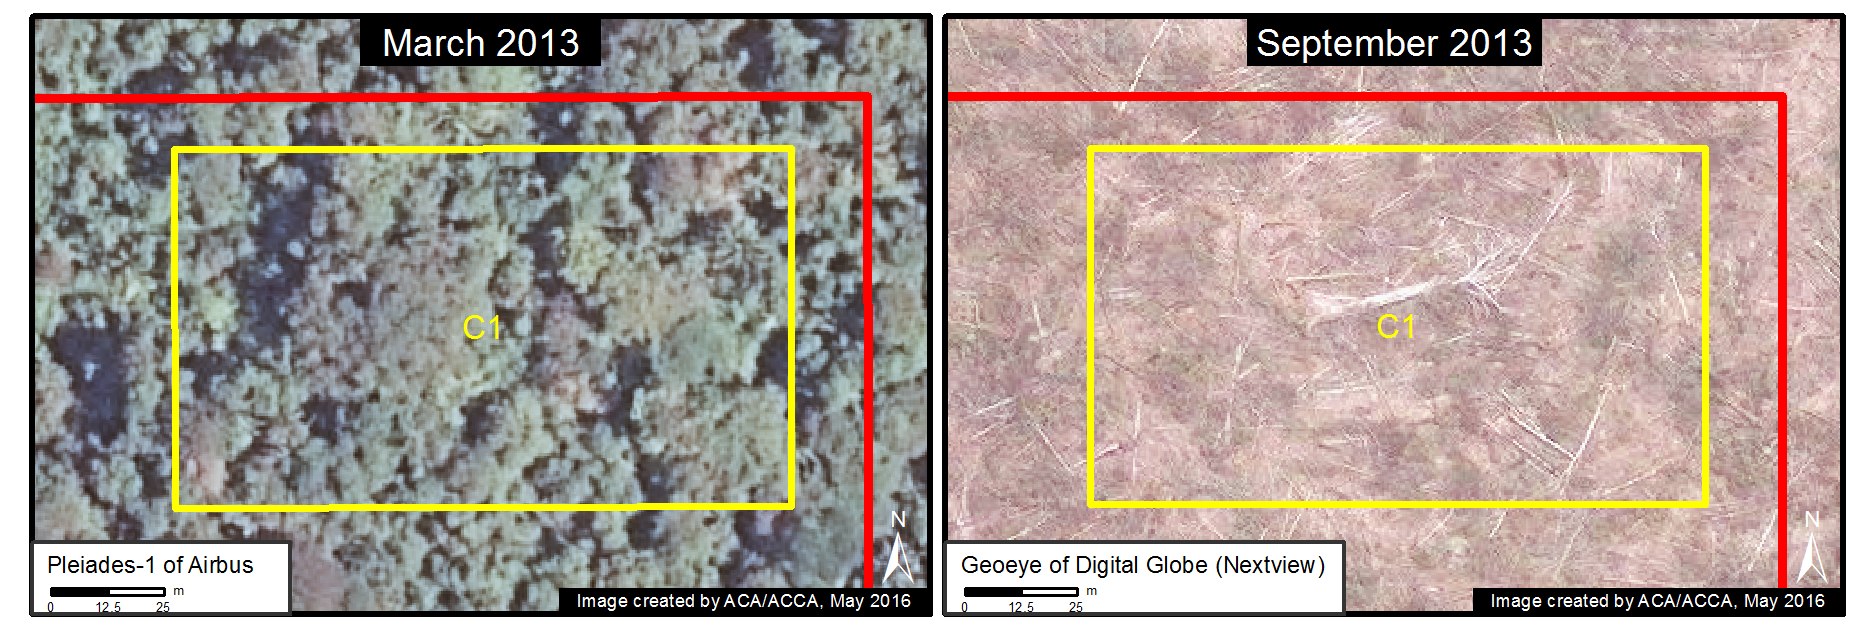
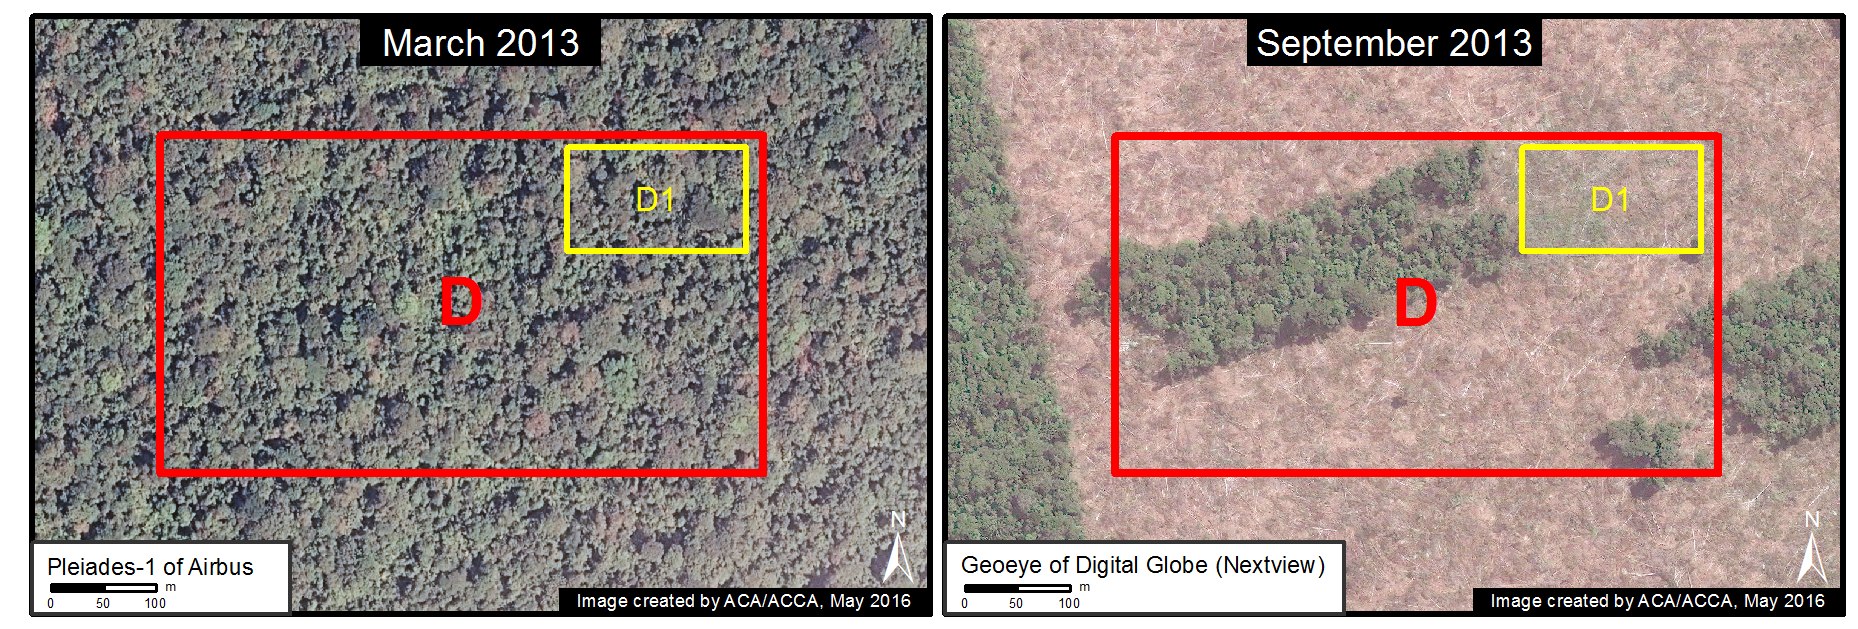
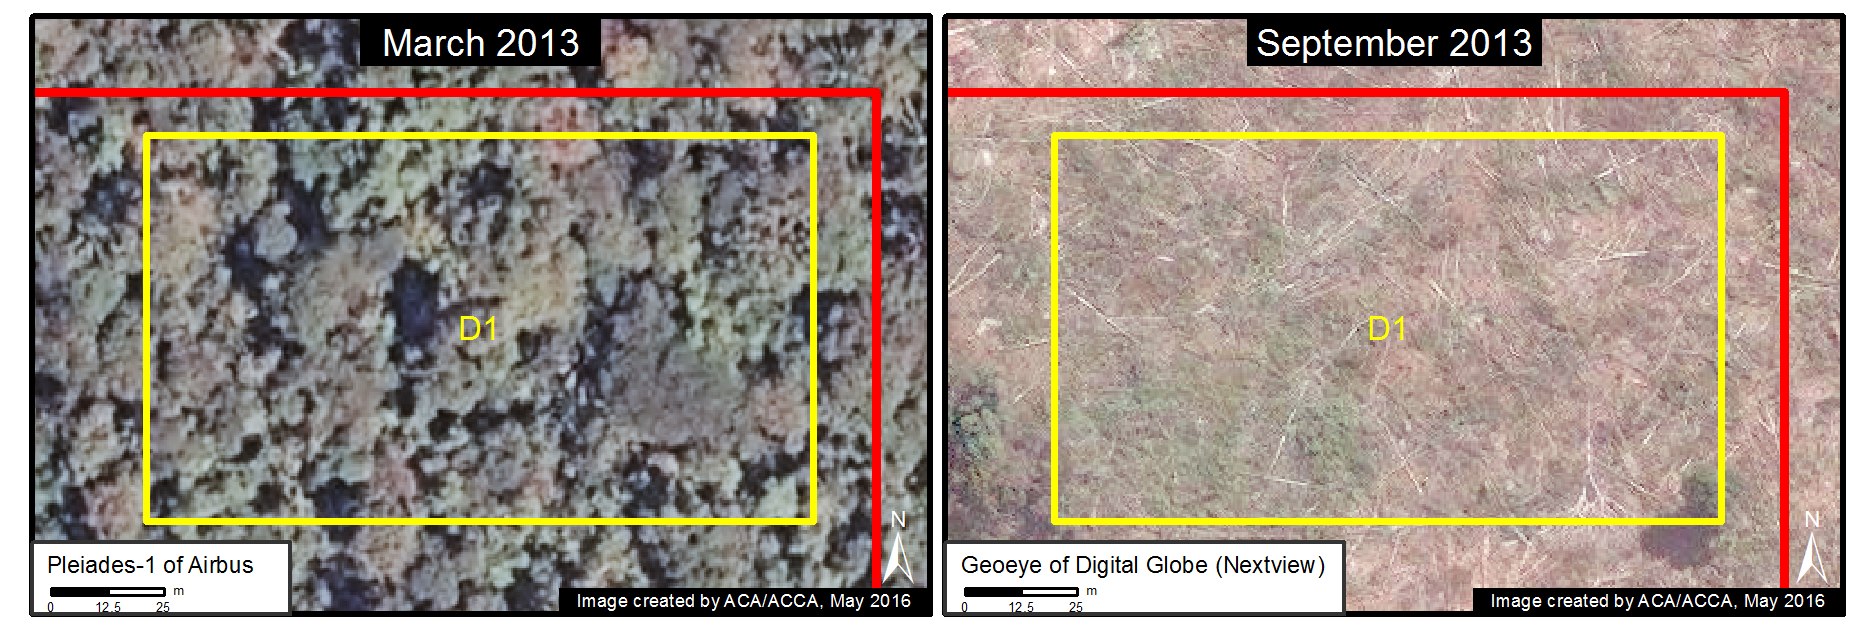
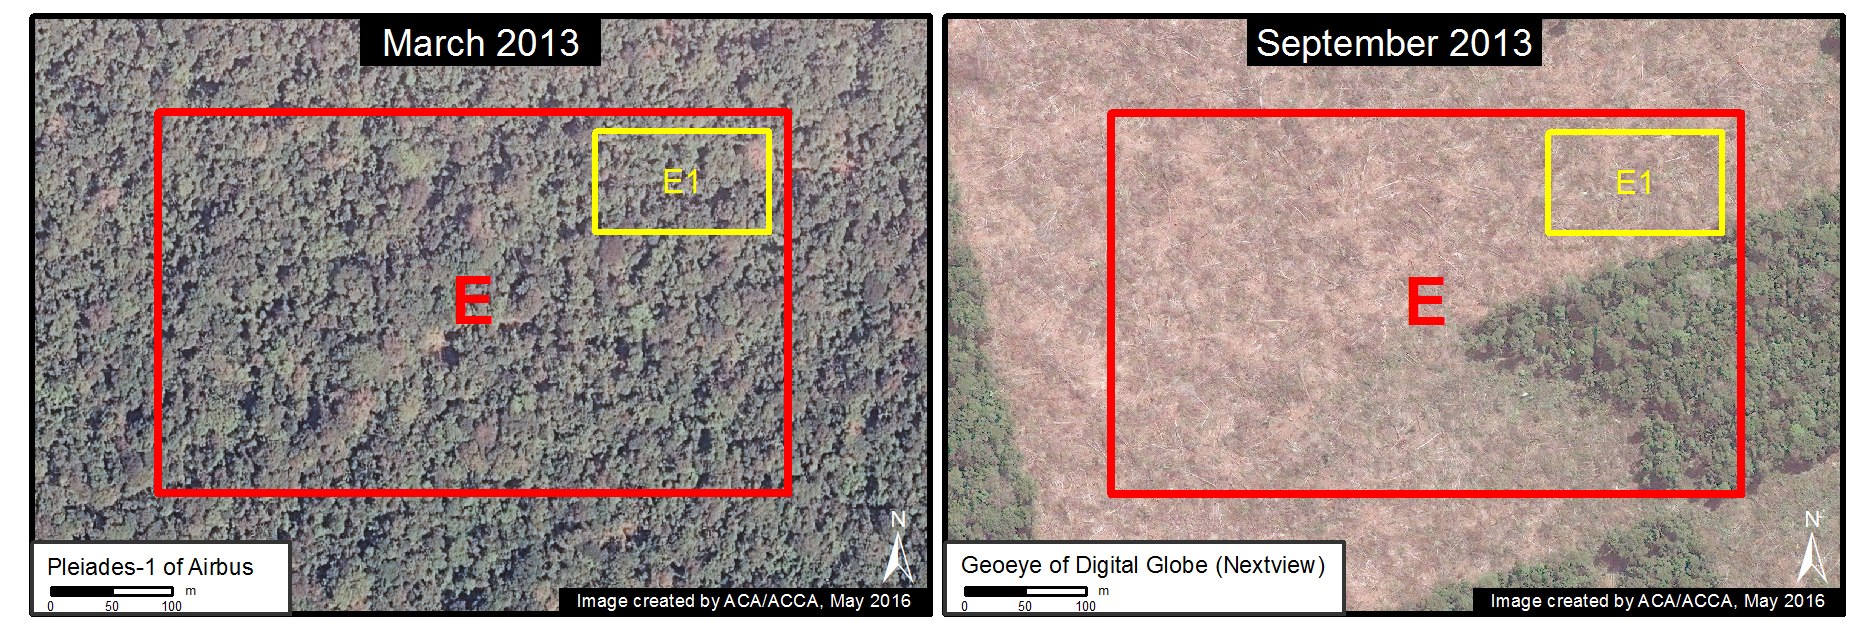
In the following series of images, we show zooms of the areas indicated by Insets A-E in Image 35a. Each image shows the same exact area within the cacao project between March (left panel) and September (right panel) 2013. In all images, one can clearly see intact forest in March followed by large-scale deforestation in September.

Image 35b. Data: Airbus, Digital Globe (Nextview)
Image 35c. Data: Airbus, Digital Globe (Nextview)

Zoom B

tamsh_zoomB
Image 35d. Data: Airbus, Digital Globe (Nextview)
tamsh_zoomB1
Image 35e. Data: Airbus, Digital Globe (Nextview)

Zoom C

tamsh_zoomC
Image 35f. Data: Airbus, Digital Globe (Nextview)
tamsh_zoomC1
Image 35g. Data: Airbus, Digital Globe (Nextview)

Zoom D

tamsh_zoomD
Image 35h. Data: Airbus, Digital Globe (Nextview)
tamsh_zoomD1
Image 35i. Data: Airbus, Digital Globe (Nextview)

Zoom E

tamsh_zoomE
Image 35j. Data: Airbus, Digital Globe (Nextview)
tamsh_zoomE1
Image 35k. Data: Airbus, Digital Globe (Nextview)

Reference Graphic

Finally, for reference, Image 35l illustrates the difference (as seen in high-resolution imagery) between primary forest, secondary vegetation, agricultural areas, and deforested areas.

Imagen Xl. Datos: Worldview (NextView)
Image 35l. Data: Worldview (NextView)

References

*MAAP #27, MAAP #13, MAAP #9, MAAP #2

**See articles in Directors Talk, La Region, y The Guardian

***see MAAP #9 for details on our time-series analysis dating back to 1985 that revealed that the vast majority of the project area is primary forest

Citation

Finer M, Cruz C, Novoa S (2016) Confirming Amazon Deforestation by United Cacao in 2013 [High Res View].  MAAP: 35.

MAAP #32: Large-scale vs. Small-scale Deforestation in the Peruvian Amazon

Graph 32a. Data: PNCB/MINAM, UMD/GLAD

In the previous MAAP #25 and MAAP #26, we illustrated deforestation hotspots in the Peruvian Amazon for the periods 2012-2014 and 2015*, respectively. Here in MAAP #32, we present a complementary analysis based on the size of deforestation events.

Graph 32a shows the comparative results of deforestation patterns between 2013 and 2015, indicating that:
Small-scale (< 5 hectares) accounted for the vast majority of deforestation events (70-80%) each year.
Medium-scale (5-50 hectares) accounted for approximately 20% of the deforestation events each year.
Large-scale (> 50 hectares) deforestation was variable. In 2013, the year with the most activity of new cacao and oil palm plantations, it accounted for 8% of the deforestation events. In 2015 it was only 1%.

In summary, small- and medium-scale deforestation events represent more than 90% of the total and a constant threat, while large-scale deforestation events represents a latent threat. As described below, large-scale projects can quickly cause massive deforestation events, and should therefore remain a high priority.

*We have increased our deforestation estimate for 2015 to 163,238 hectares (403,370 acres), the second highest on record (behind only 2014). This estimate is based on GLAD alerts, produced by University of Maryland, Google, and Global Forest Watch.

Base Map

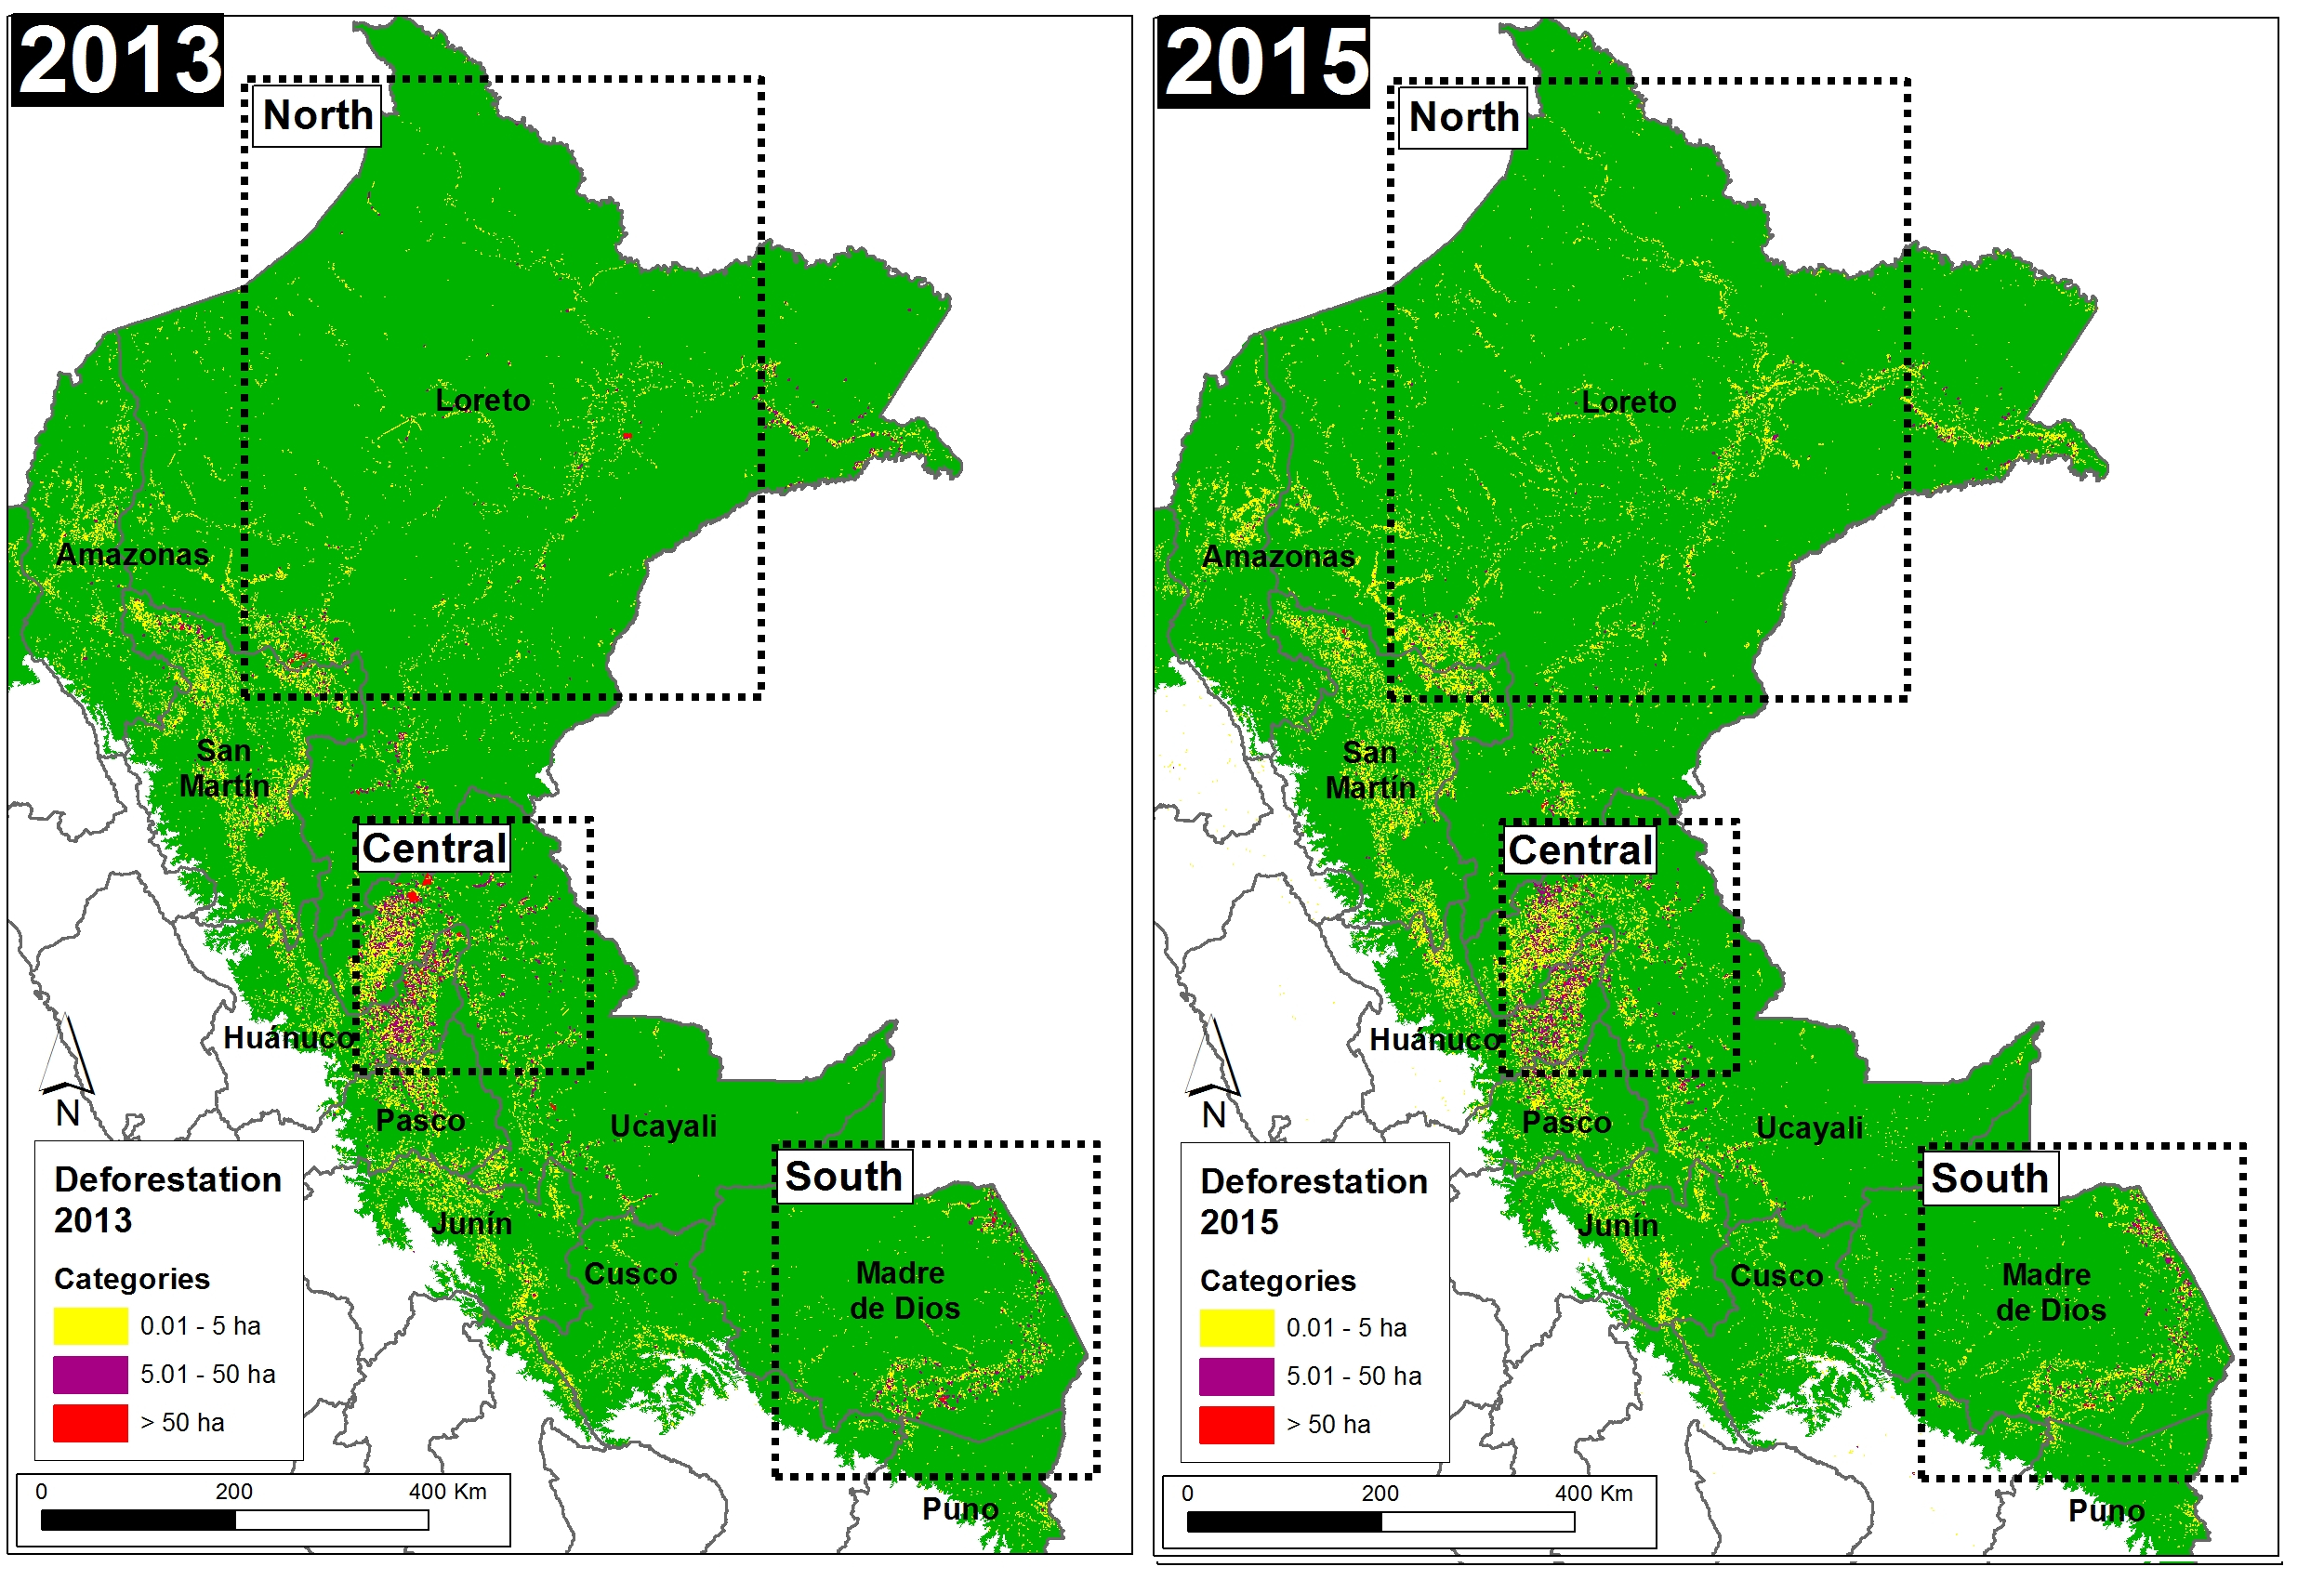
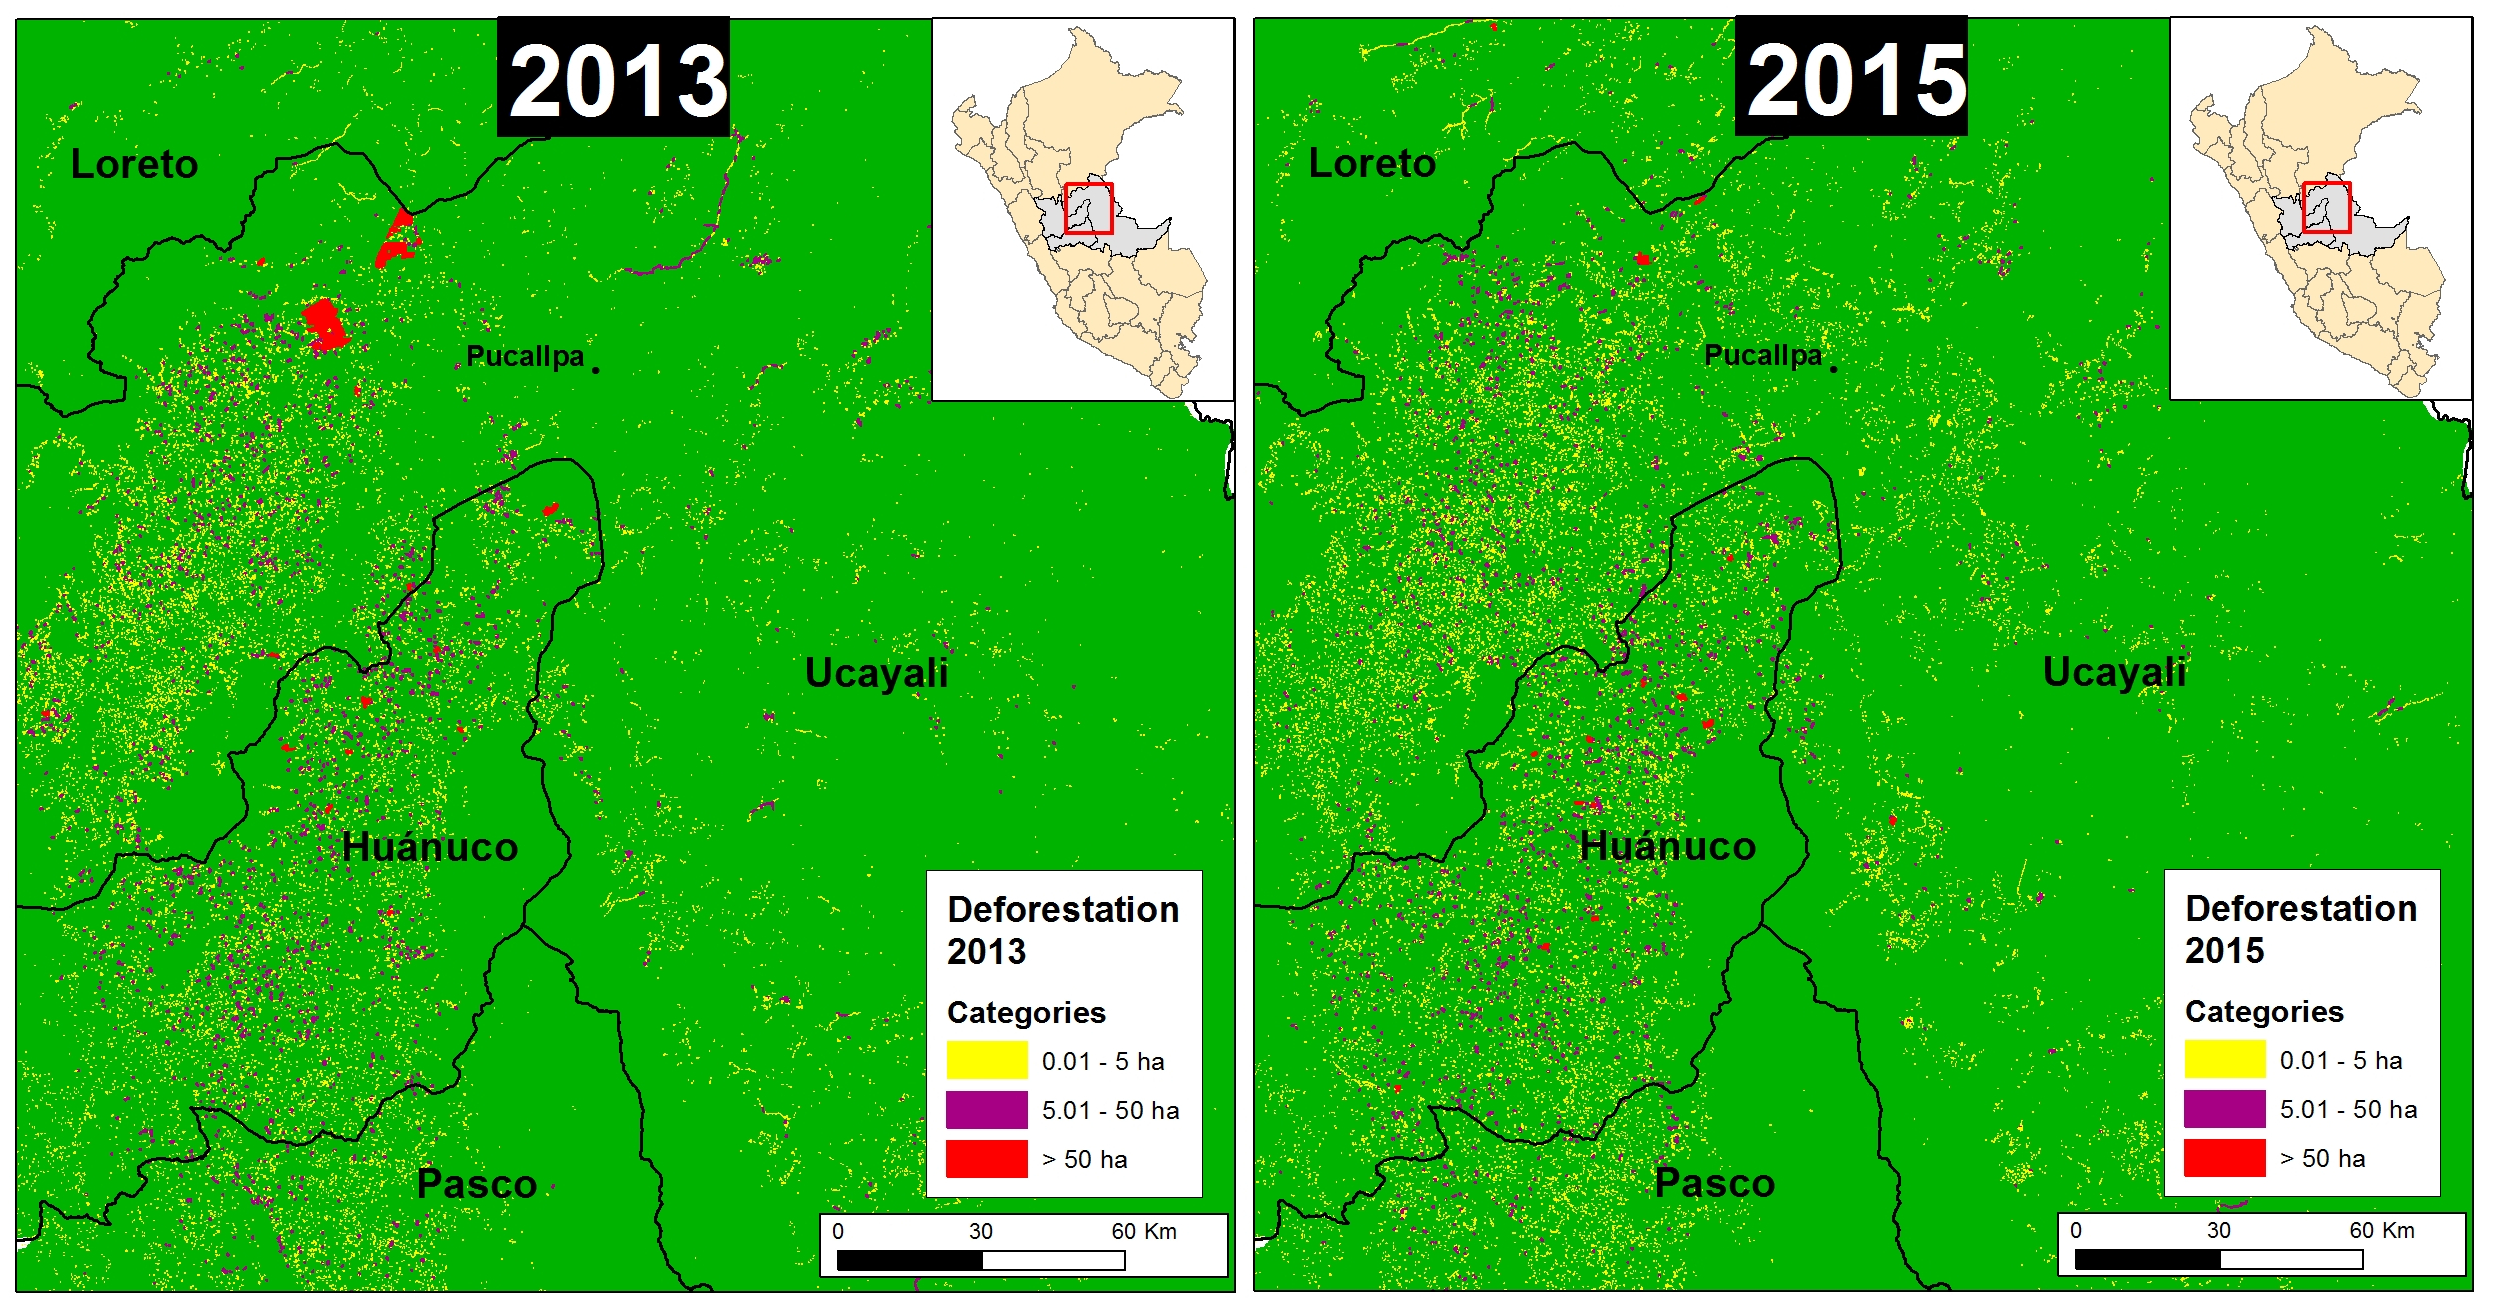
Image 32a shows, in graphic form, the deforestation patterns described above for 2013 (left panel) and 2015 (right panel). Further below, we show zooms for three key zones in the north, central, and south, respectively.

Categ_13_15_v1_en
Image 32a. Data: PNCB/MINAM, UMD/GLAD

Northern Peruvian Amazon

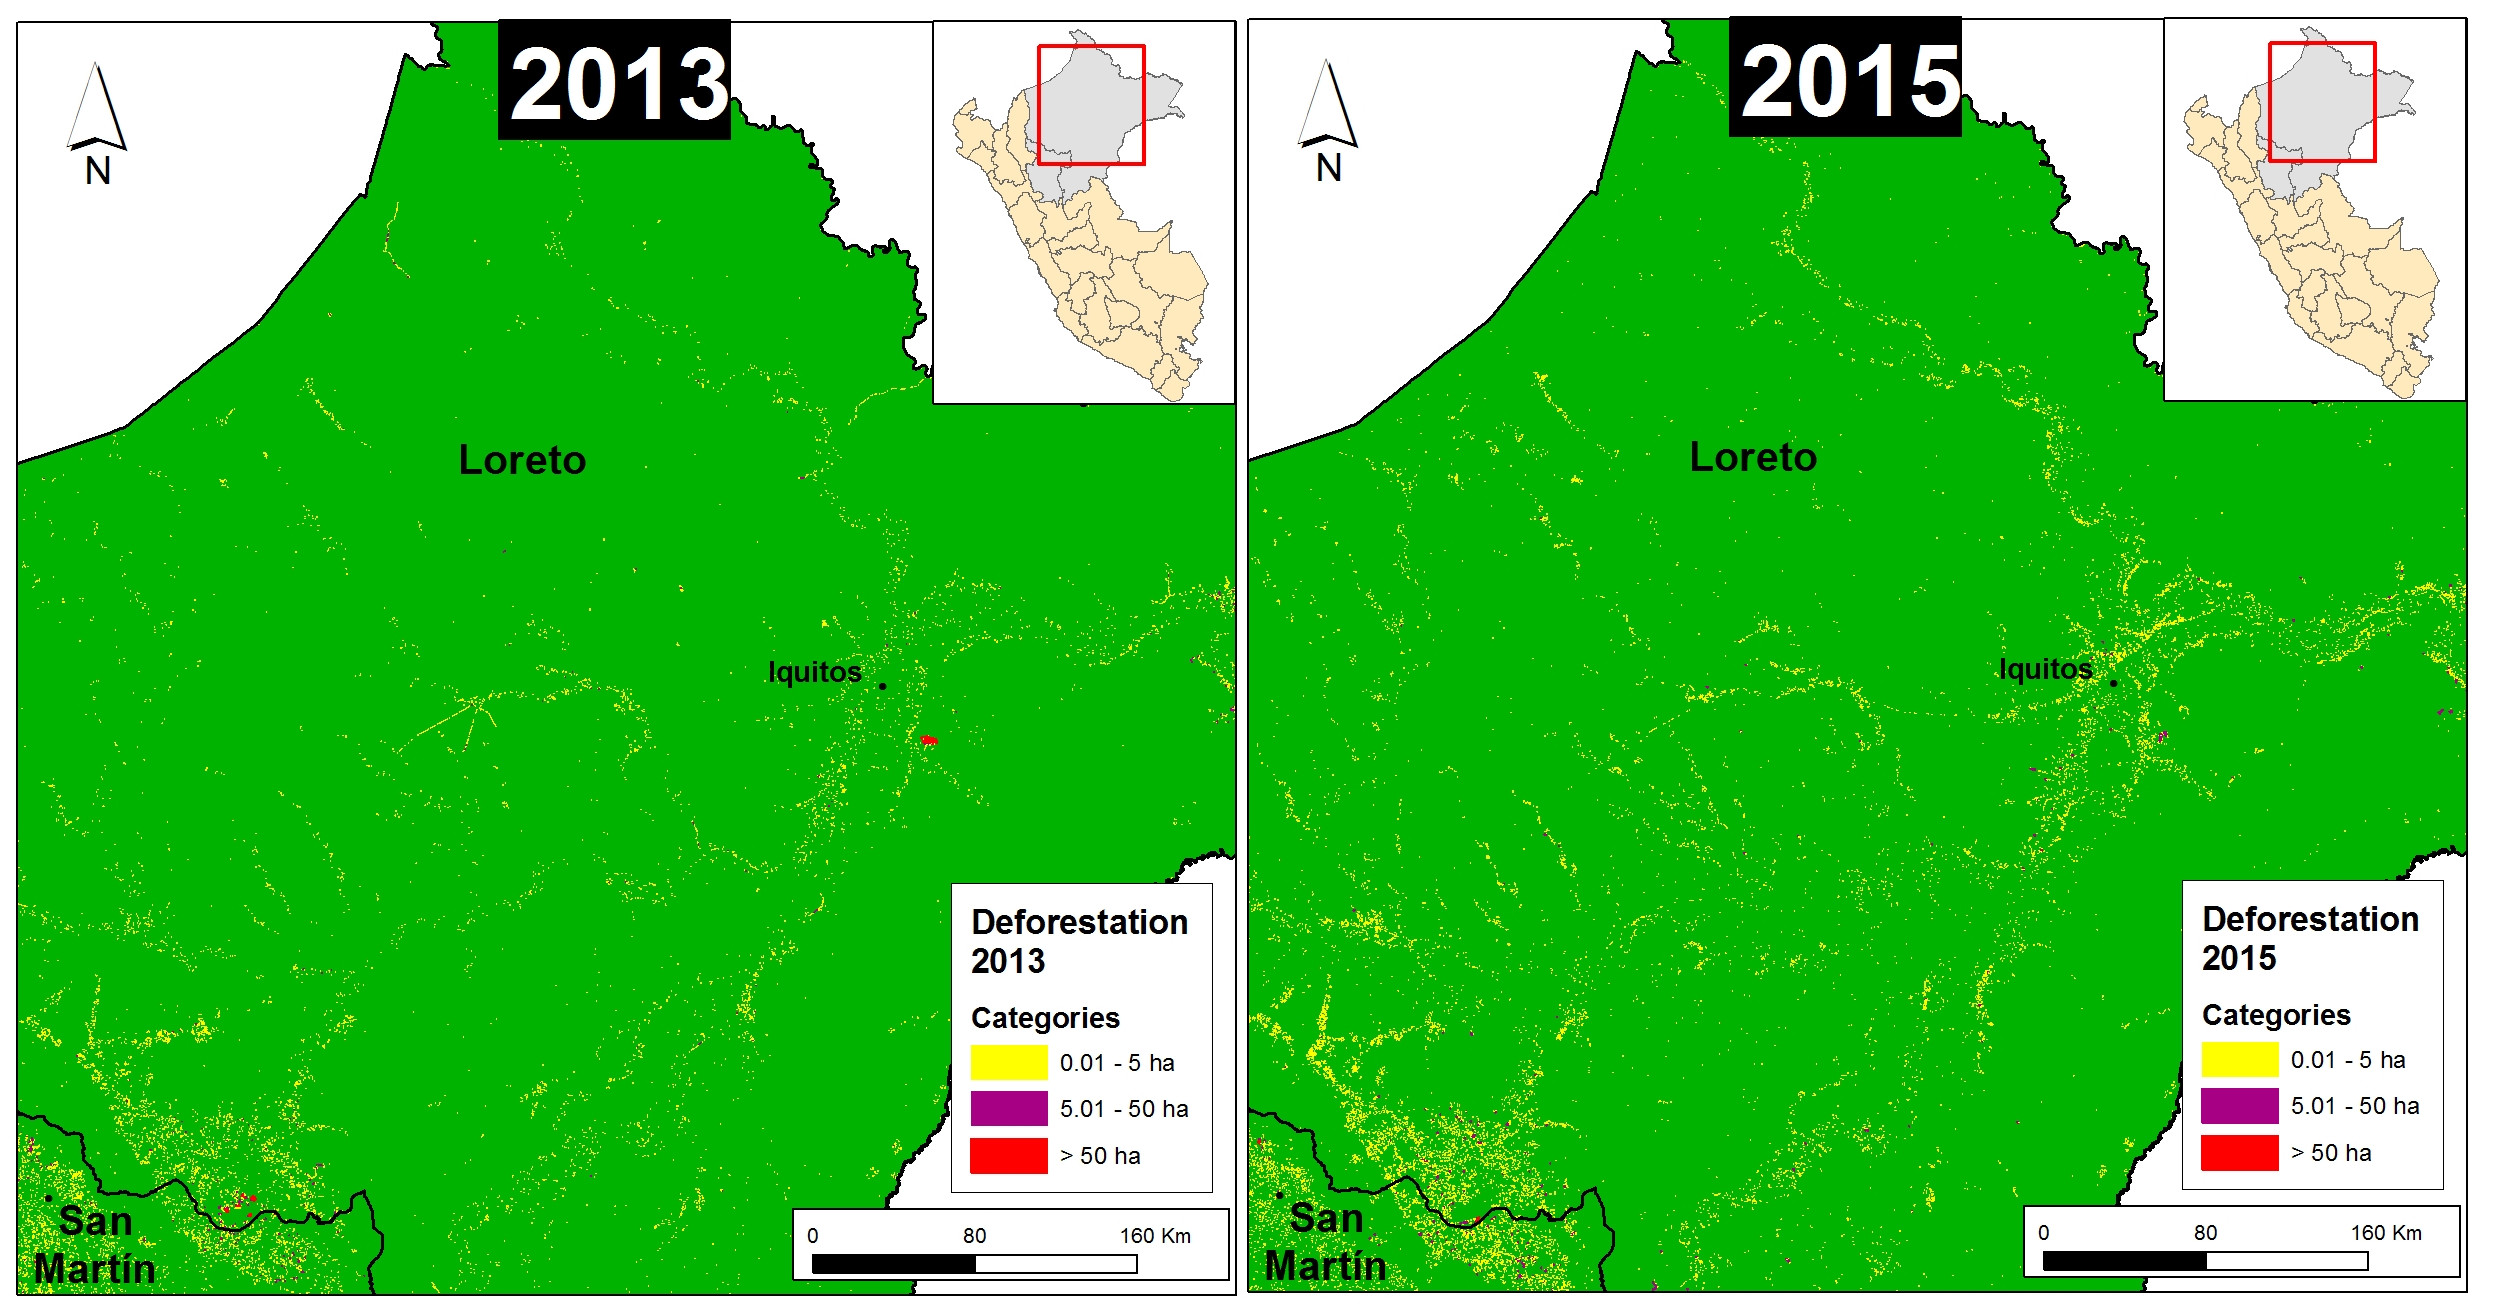
Image 32b shows a zoom of the northern Peruvian Amazon for 2013 (left panel) and 2015 (right panel). In general, there is a pattern of small-scale deforestation along the rivers of Loreto. Additionally, in 2013, there were large-scale deforestation events for a cacao project located to the southeast of the city of Iquitos (see MAAP #27 for more details) and for oil palm plantations along the border of Loreto and San Martin regions (see MAAP #16 for more details). In 2015, the expansion of deforestation continued in these areas, but at a medium-scale.

Categ_13_15_n_v1_en
Image 32b. Data: PNCB/MINAM, UMD/GLAD

Central Peruvian Amazon

Image 32c shows a zoom of the central Peruvian Amazon for 2013 (left panel) and 2015 (right panel). In general, there is a concentration of small- and medium-scale deforestation between northwest Ucayali and southeast Huánuco. Additionally, in 2013, there is large-scale deforestation for two new oil palm plantations located northeast of the city of Pucallpa (see MAAP #4 for more details).

Categ_13_15_c_v1_en
Image 32c. Data: PNCB/MINAM, UMD/GLAD

Southern Peruvian Amazon

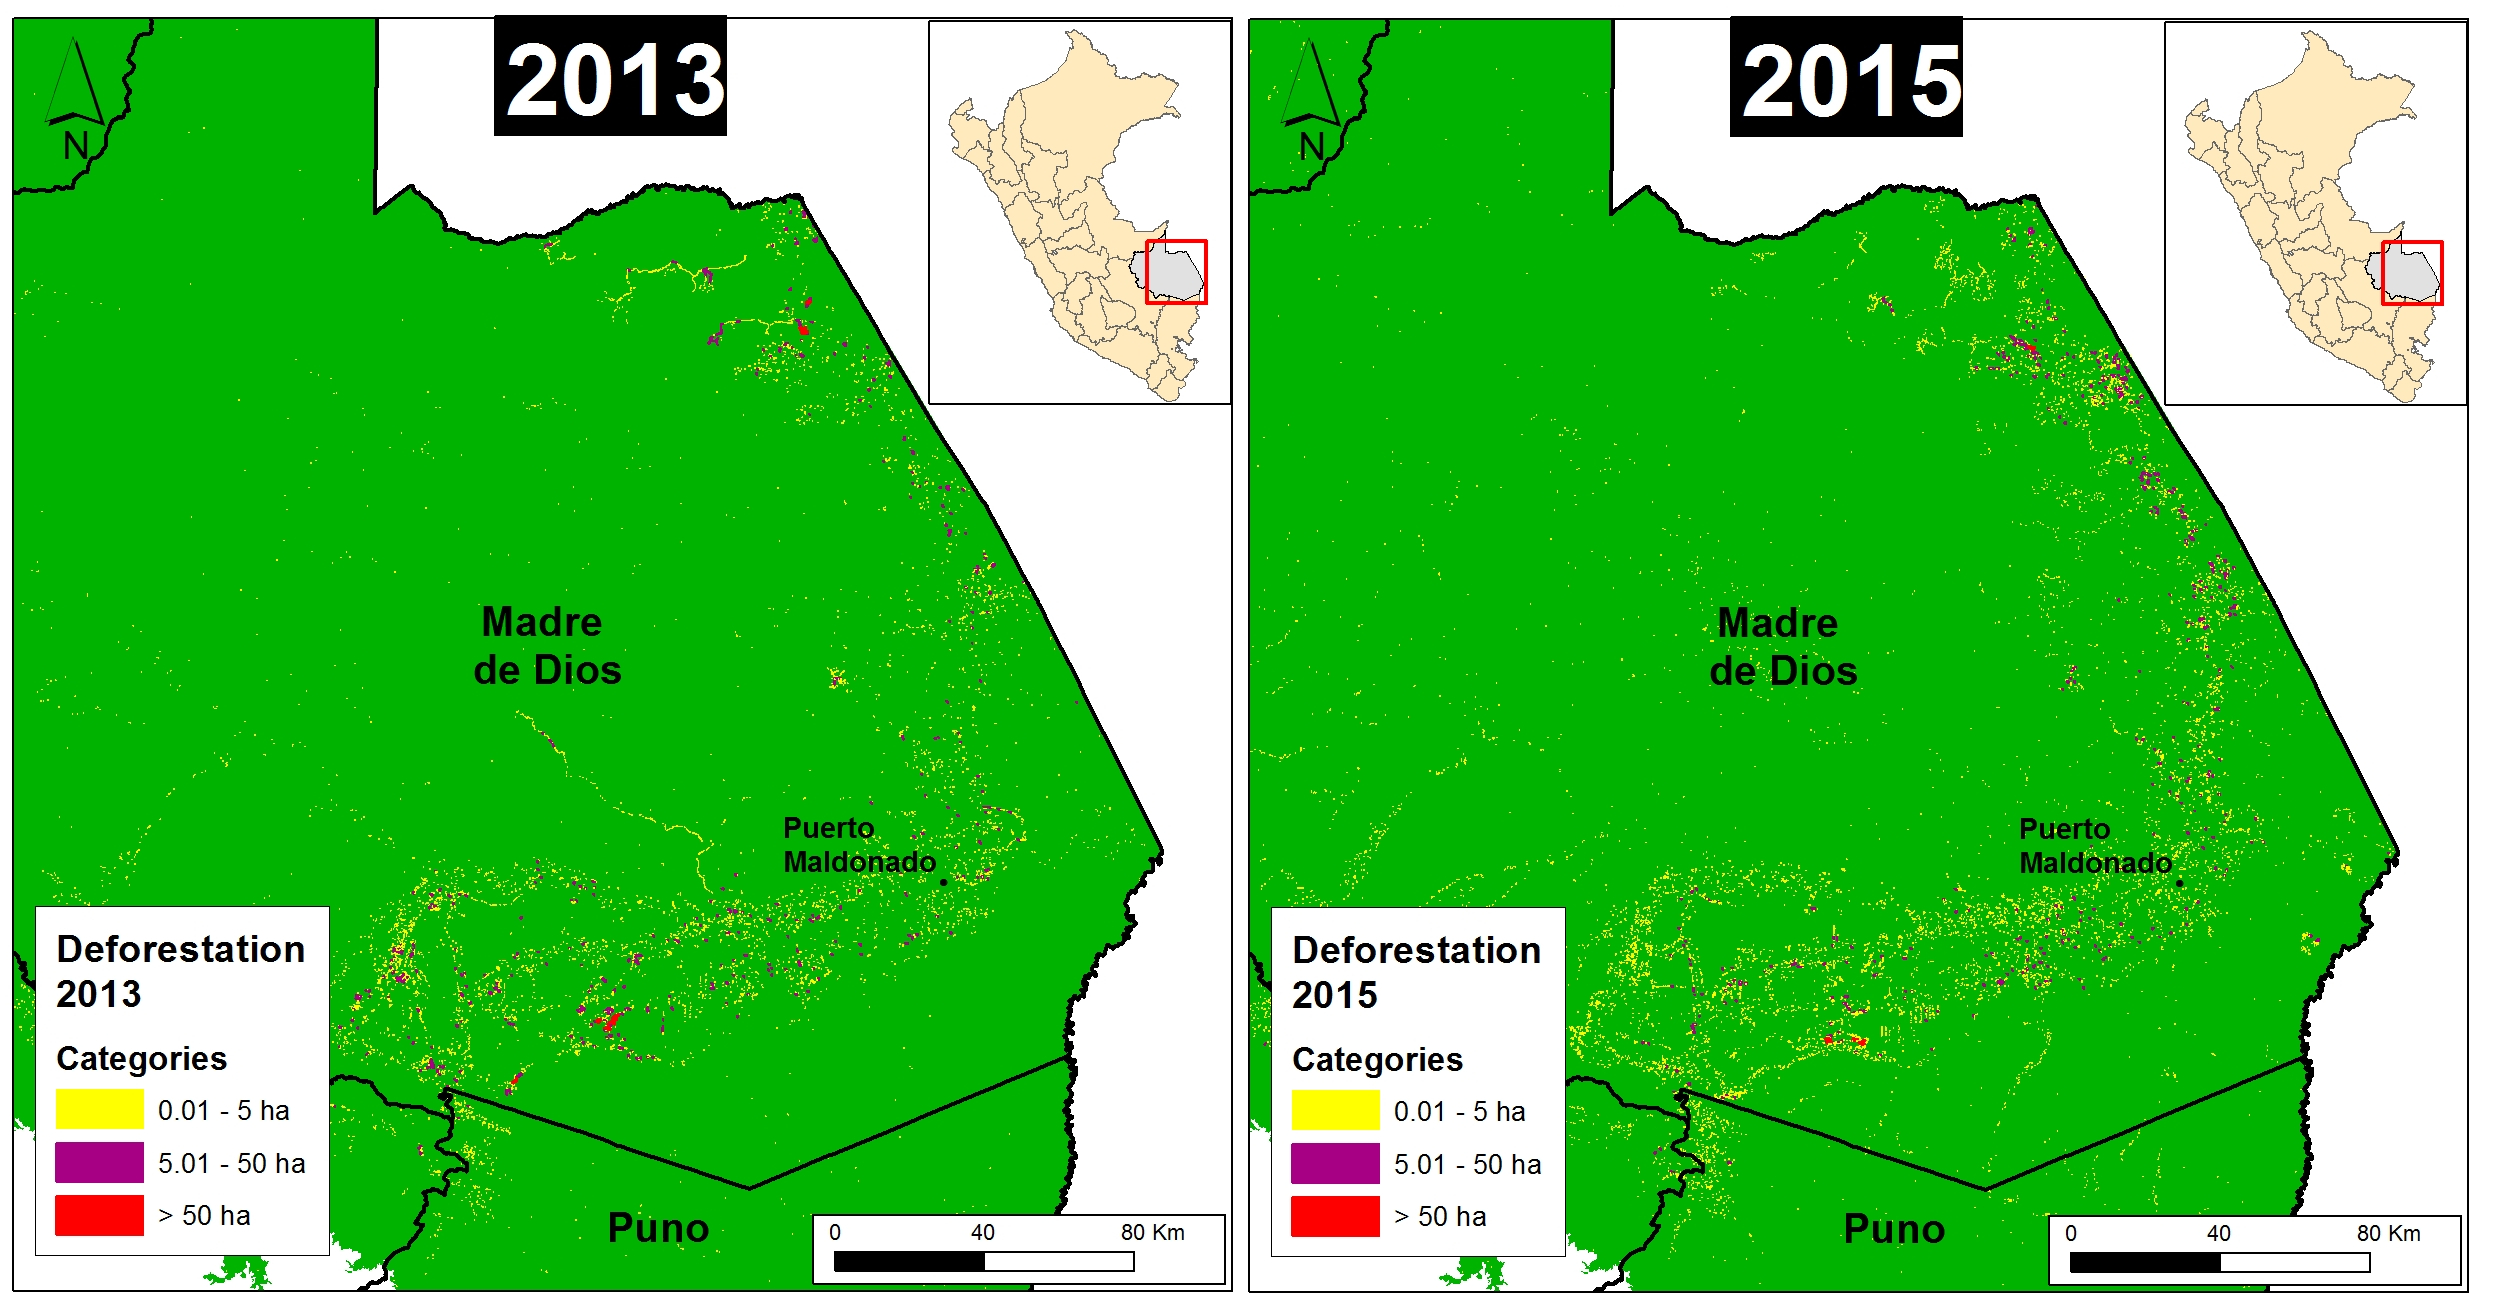
Image 32d shows a zoom of the southern Peruvian Amazon for 2013 (left panel) and 2015 (right panel). In general, there is a pattern of small- and medium-scale deforestation along the Interoceanic highway in Madre de Dios. Additionally, there is the persistence of large-scale deforestation in southern Madre de Dios related to illegal gold mining (see MAAP #12 for more details).

Categ_13_15_s_v1_en
Image 32d. Data: PNCB/MINAM, UMD/GLAD

Citation

Finer M, Novoa S (2016) Large-scale vs. Small-scale Deforestation in the Peruvian Amazon. MAAP: 32.

MAAP #27: United Cacao Continues Deforestation of Primary Forest in Tamshiyacu (Loreto, Peru)

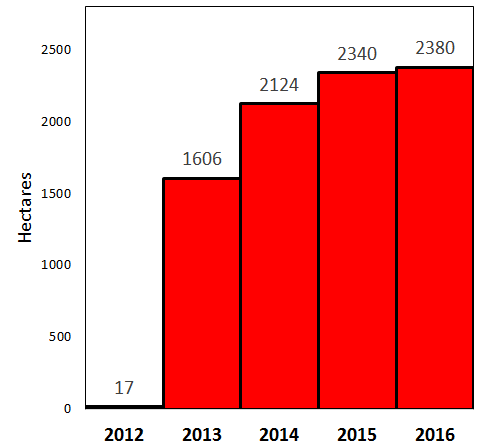
Deforestation continues to increase in the land owned and operated by United Cacao  near the town of Tamshiyacu in the northern Peruvian Amazon. Since 2013, we have documented the deforestation of 2,380 hectares (5,880 acres) related to this project, the vast majority at the expense of primary forest*. Of this total, 250 hectares were clear-cut after the Peruvian Ministry of Agriculture ordered the “paralyzation” of the company’s agricultural activities in December 2014**. Here in MAAP #27, we present evidence that indicates the deforestation related to this project will continue to expand in the coming months.

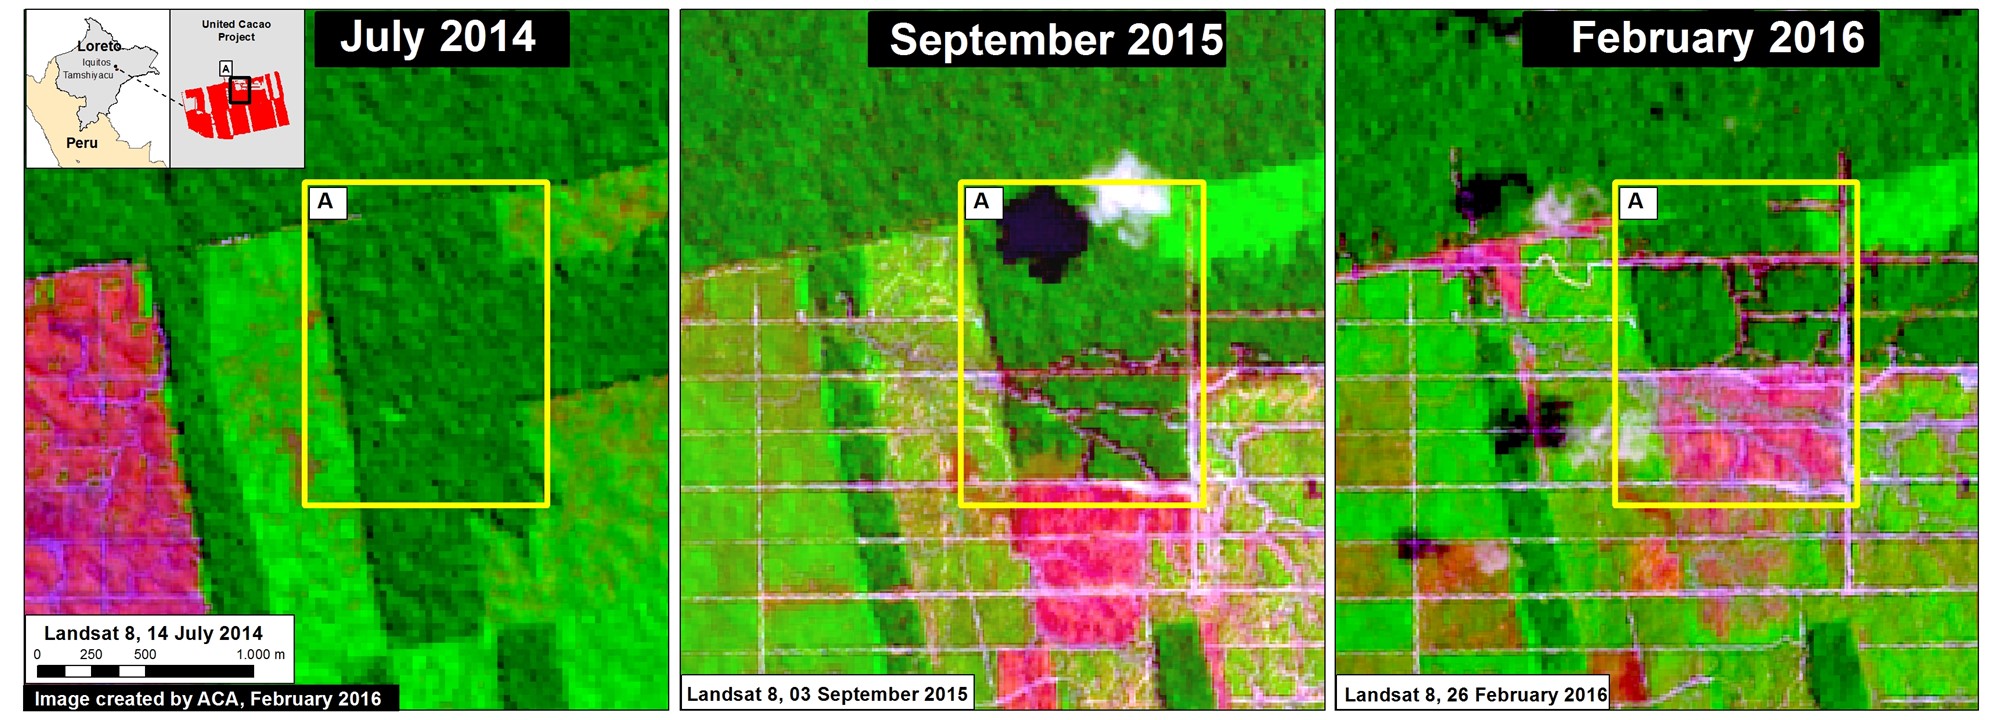
Image 27a. Data: USGS.

Image 27a shows a series of satellite images (Landsat) that shows the advance of deforestation in in the northern part of the United Cacao project. The left panel shows this area contained a remnant of primary forest (see dark green color in Inset A) in July 2014. The central panel shows that, by September 2015, a new access road network was constructed in the southern part of this area (see pink color, which indicates recently deforested areas). Finally, the right panel shows that in February 2016 (the most recent image), the southern part of that same area is now deforested, while a new access road network has been constructed to the north. Thus, if this pattern continues (access roads followed by large-scale deforestation), we predict that deforestation will soon occur in this northern area.

High-Resolution View

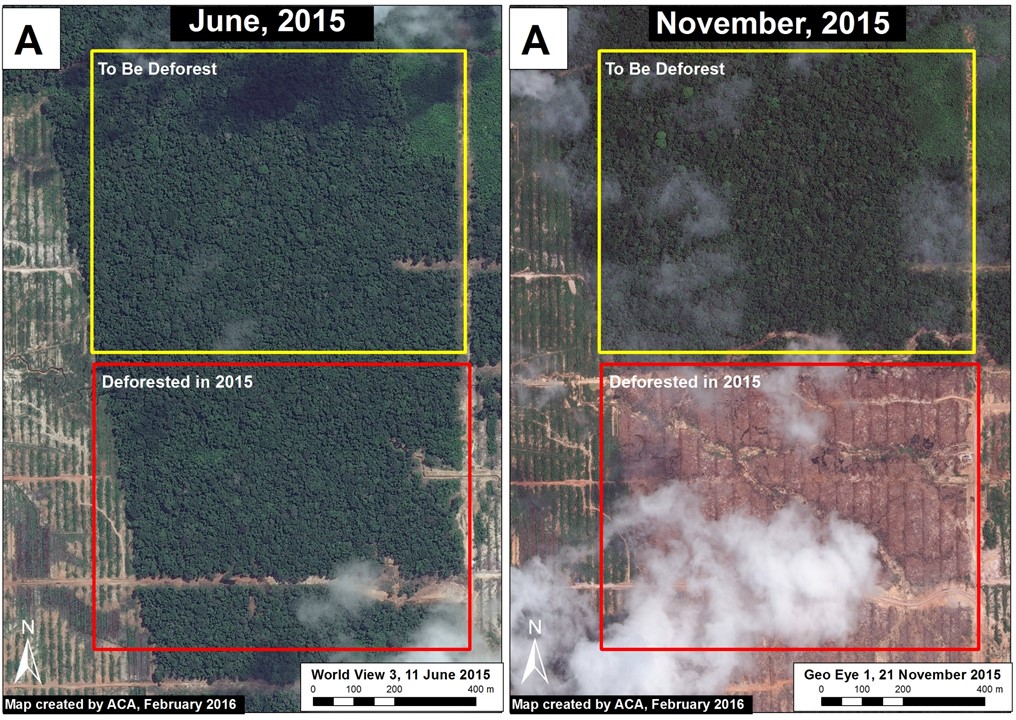
Image 27b shows, in high-resolution, the deforestation of primary forest between June (left panel) and November (right panel) of 2015 in the northern part of the United Cacao project described above (see red box in both images). The image also shows the area of primary forest that is now threatened with additional deforesation (see yellow box in both images).

Image 27b. Data: WorldView-3 from Digital Globe (NextView).
Data: PNCB/MINAM, Hansen/UMD/Google/USGS/NASA, Hansen et al 2016 (ERL)***

Deforestation Trend

The graph to the right shows the trend of accumulated deforestation in the United Cacao project area between 2012 and February 2016. The company began operations in early 2013, the same year as the large increase in deforestation. Also note that deforestation increased in 2015 despite the Ministry of Agriculture’s “paralyzation” order in late 2014.


GLAD weekly alerts

It is worth emphasizing how quickly and precisely the new GLAD weekly alert system picked up the new access road construction in 2016 (see Image 27c). Also, click here to see this view on Global Forest Watch.

Image 27c. Data: UMD/GLAD, GFW, UrtheCast

Notes

*According to the Supreme Decree (No. 018-2015-MINAGRI) approving the Regulations for Forest Management under the framework of the new 2011 Forestry Act (No. 29763), the official definition of primary forest in Peru is: “Forest with original vegetation characterized by an abundance of mature trees with species of superior or dominant canopy, which has evolved naturally.” Using methods of remote sensing, our interpretation of that definition are areas that from the earliest available image (in this case, from 1985) are characterized by dense closed-canopy coverage and experienced no major clearing events. See MAAP #9 and MAAP #2 for more details.

** Resolución de Dirección General N° 462-2014-MINAGRI-DVDIAR-DGAAAA recent press release from the organization Environmental Investigation Agency reports that the order is still in effect (http://eia-global.org/blog/united-cacao-linked-companies-ordered-to-stop-operations-by-peruvian-author).

***Hansen, M.C., A. Krylov, A. Tyukavina, P.V. Potapov, S. Turubanova, B. Zutta, S. Ifo, B. Margono, F. Stolle, and R. Moore (2016) Humid tropical forest disturbance alerts using Landsat data.  Environ. Res. Lett. 11: 034008. Accessed through Global Forest Watch: www.globalforestwatch.org

Citation

Finer M, Novoa S (2016) United Cacao Continues Deforestation of Primary Forest in Tamshiyacu (Loreto, Peru). MAAP: #27.


MAAP #25: Deforestation Hotspots in the Peruvian Amazon, 2012-2014

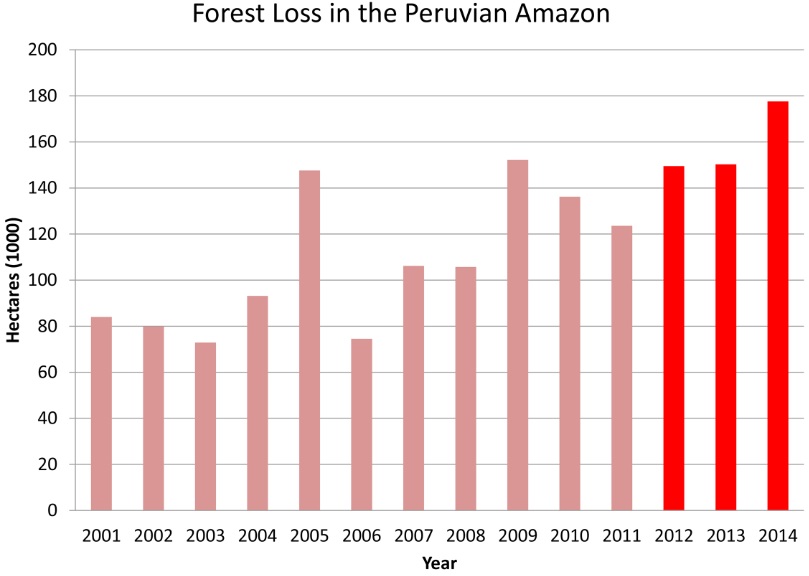
Deforestation continues to increase in the Peruvian Amazon. According to the latest information from the Peruvian Environment Ministry1, 2014 had the highest annual forest loss on record since 2000 (177,500 hectares, or 438,600 acres per year). 2013 and 2012 had the third and fourth-highest annual forest loss totals, respectively (behind only 2009).

Source: PNCB/MINAM
Source: PNCB/MINAM

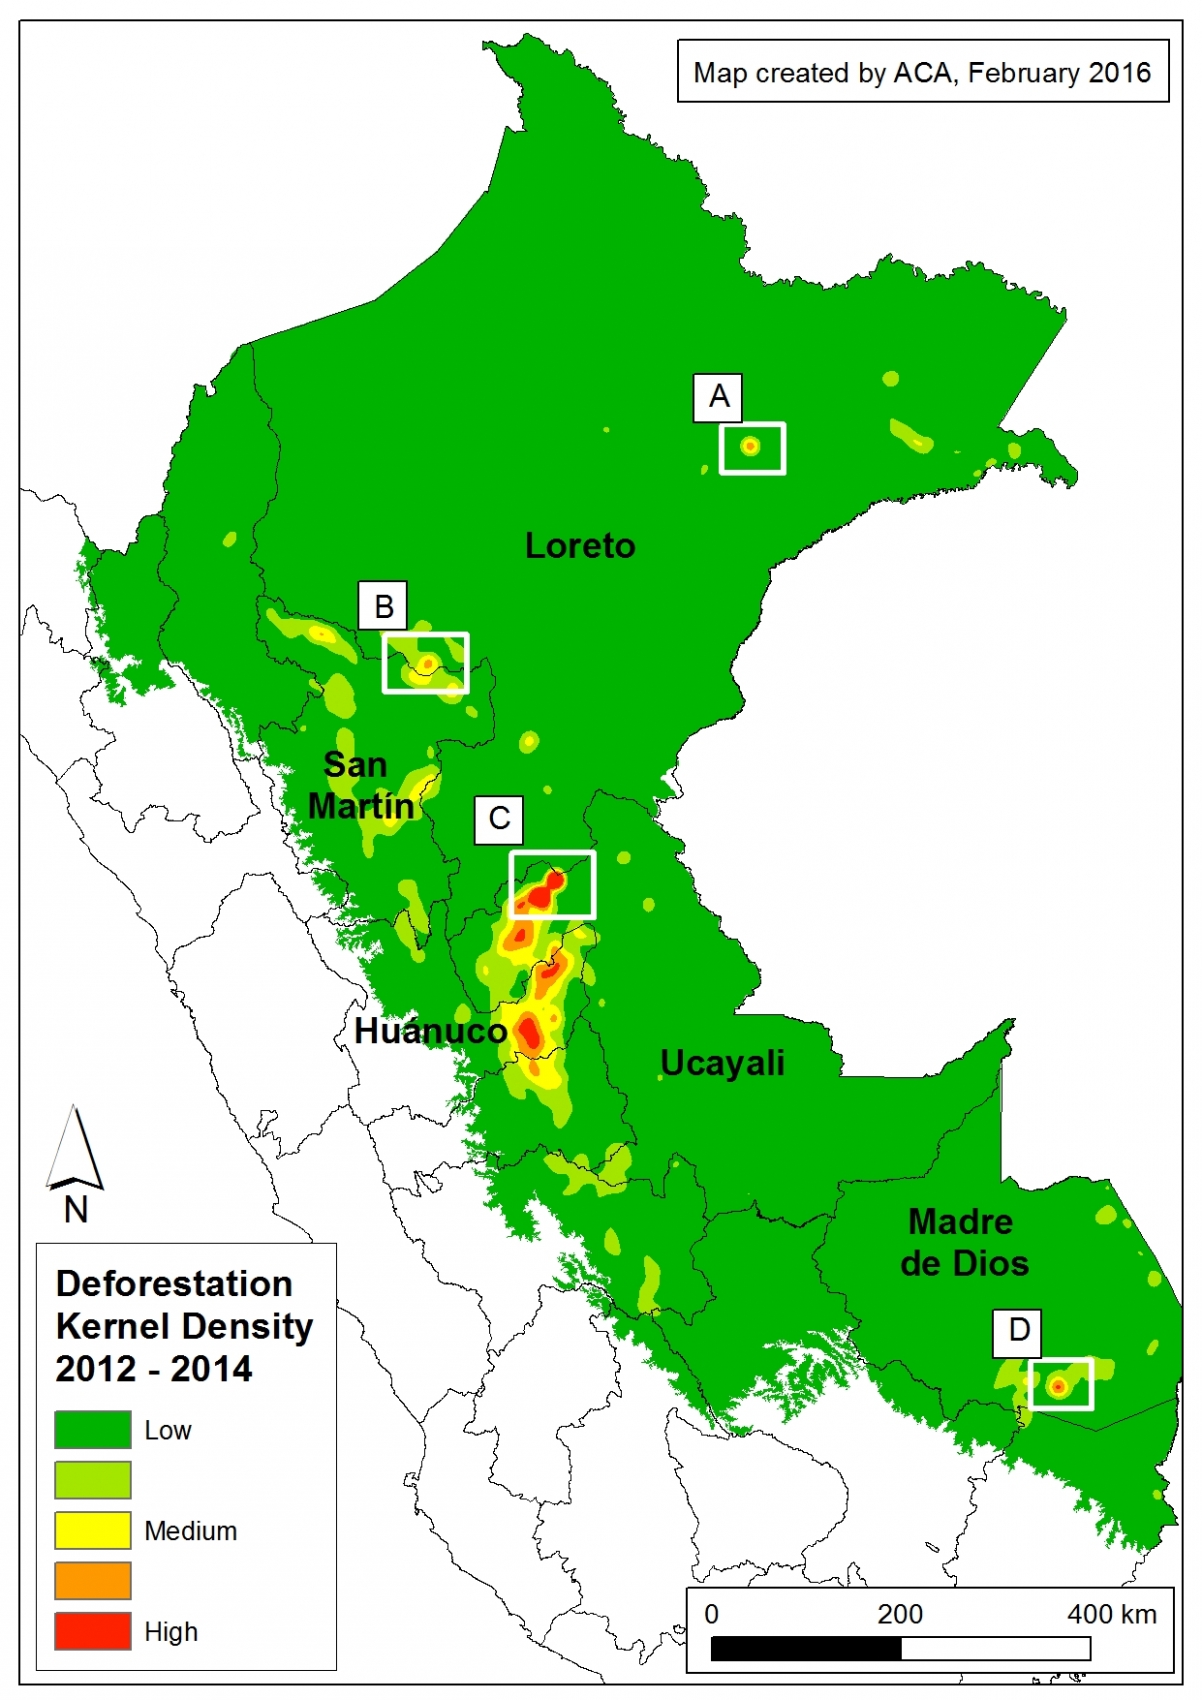
To better understand where this deforestation is concentrated, we conducted kernel density estimation. This type of analysis calculates the magnitude per unit area of a particular phenomenon (in this case, forest loss).

Image 25a shows the kernel density map for forest loss in the Peruvian Amazon between 2012 and 2014 and reveals that recent deforestation is concentrated in a number of “hotspots” in the departments of Loreto, San Martin, Ucyali, Huanuco, and Madre de Dios.

Insets A-D highlight four areas with high densities of forest loss described in previous MAAP articles. We are currently studying the other high density deforestation areas not included in the insets.


Inset A: Cacao in Loreto

Image 25a. Kernel density map for forest loss in the Peruvian Amazon between 2012 and 2014. Data: PNCB/MINAM, Hansen/UMD/Google/USGS/NASA.
Image Xb.
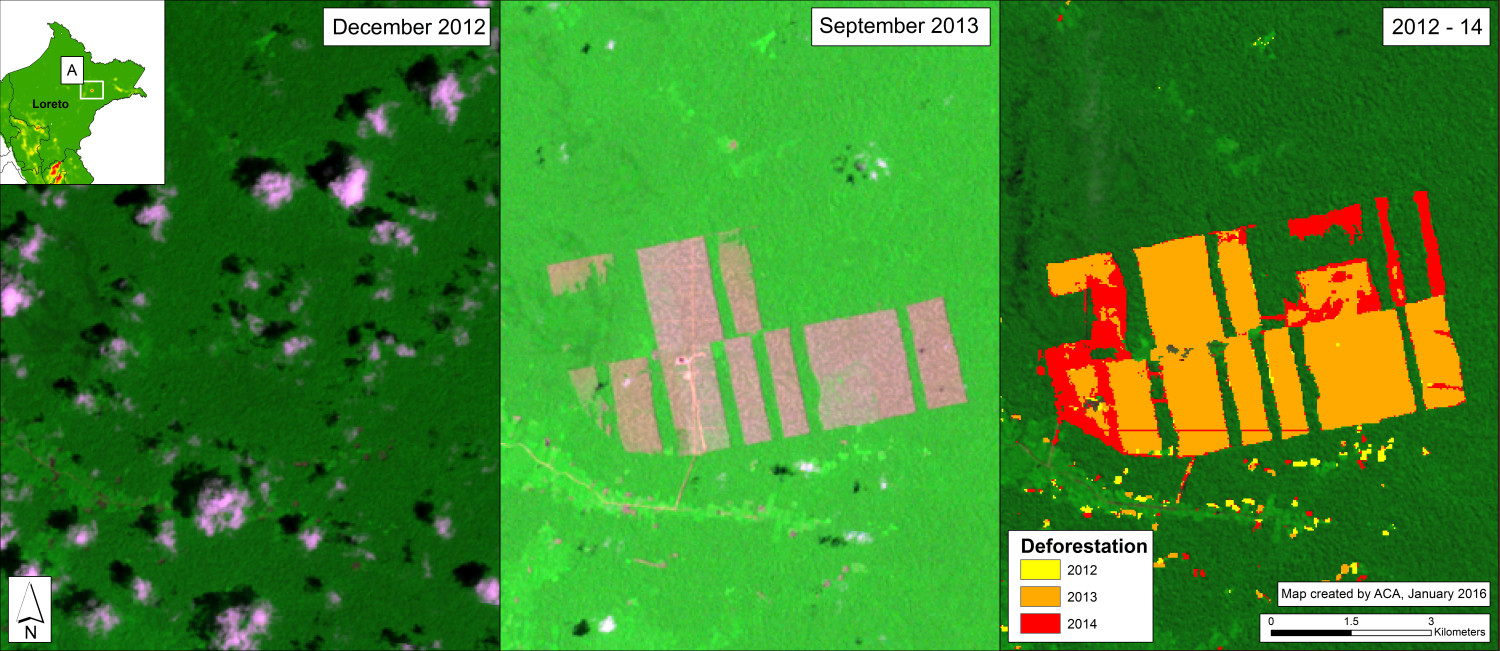
Image 25b. Deforestation for cacao in northern Peru between December 2012 (left panel) and September 2013 (center panel) and cumulative 2012-14 (right panel). Data: USGS, PNCB/MINAM, Hansen/UMD/Google/USGS/NASA

Inset A (from Image 25a) indicates the deforestation of over 2,000 hectares (4,940 acres) on property owned by the company United Cacao (through its wholly owned Peruvian subsidiary, Cacao del Peru Norte) near the town of Tamshiyacu in the department of Loreto. MAAP #9 demonstrated that much of this deforestation took place at the expense of primary forest. Image 25b highlights this area, showing the forest loss between December 2012 (left panel) and September 2013 (center panel; the pinkish areas indicate recently cleared forests). The right panel shows the cumulative deforestation between 2012 and 2014. See MAAP #9 and MAAP #2 for more details.


Inset B: Oil Palm in Loreto/San Martin

Peru_KD_B_3panel_v1
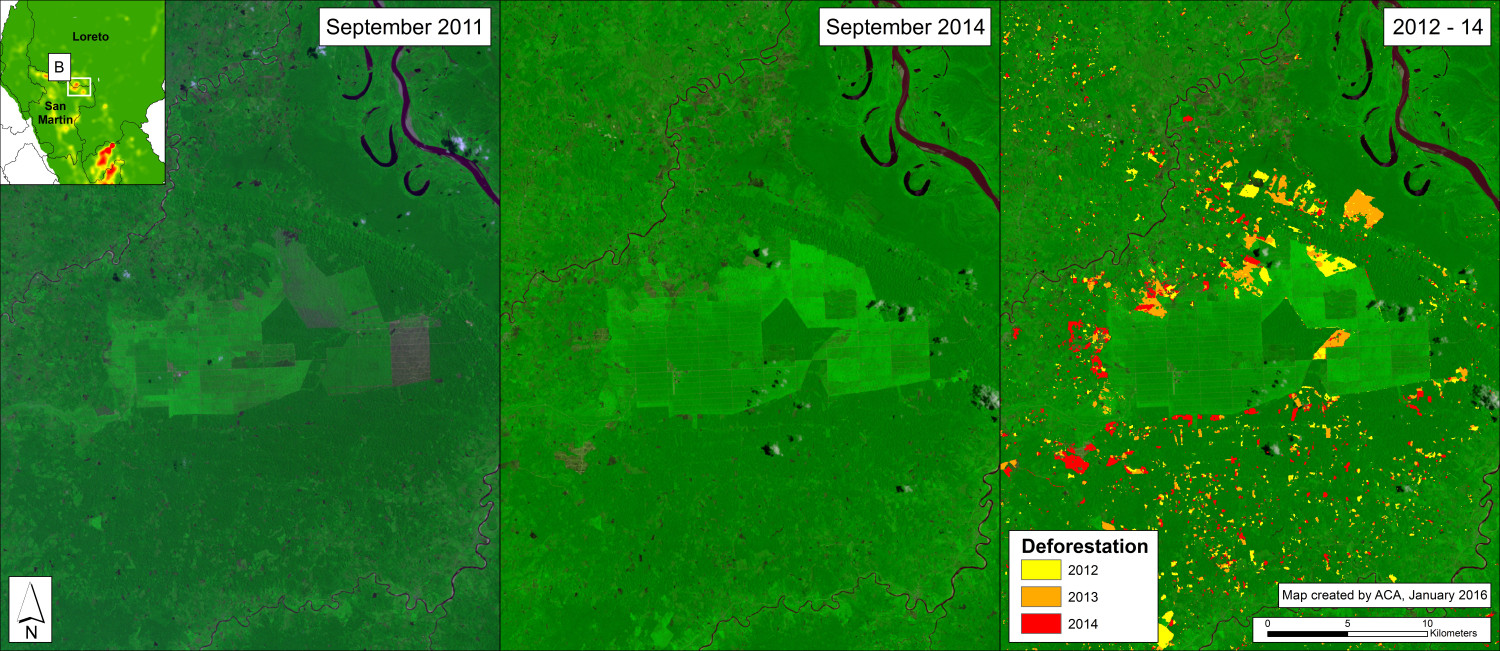
Image 25c. Deforestation for oil palm in northern Peru between September 2011 (left panel) and September 2014 (center panel) and cumulative 2012-14 (right panel). Data: USGS, PNCB/MINAM, Hansen/UMD/Google/USGS/NASA

Inset B (from Image 25a) indicates expanding deforestation within and around two large-scale oil palm plantations along the Loreto-San Martin border. Image 25c highlights this area, showing the forest loss between Setpember 2011 (left panel) and September 2014 (center panel). The right panel shows the cumulative deforestation between 2012 and 2014 (6,363 hectares, or 15,700 acres). See MAAP #16 for more details.

Inset C: Oil Palm in Ucayali

Image Xd.
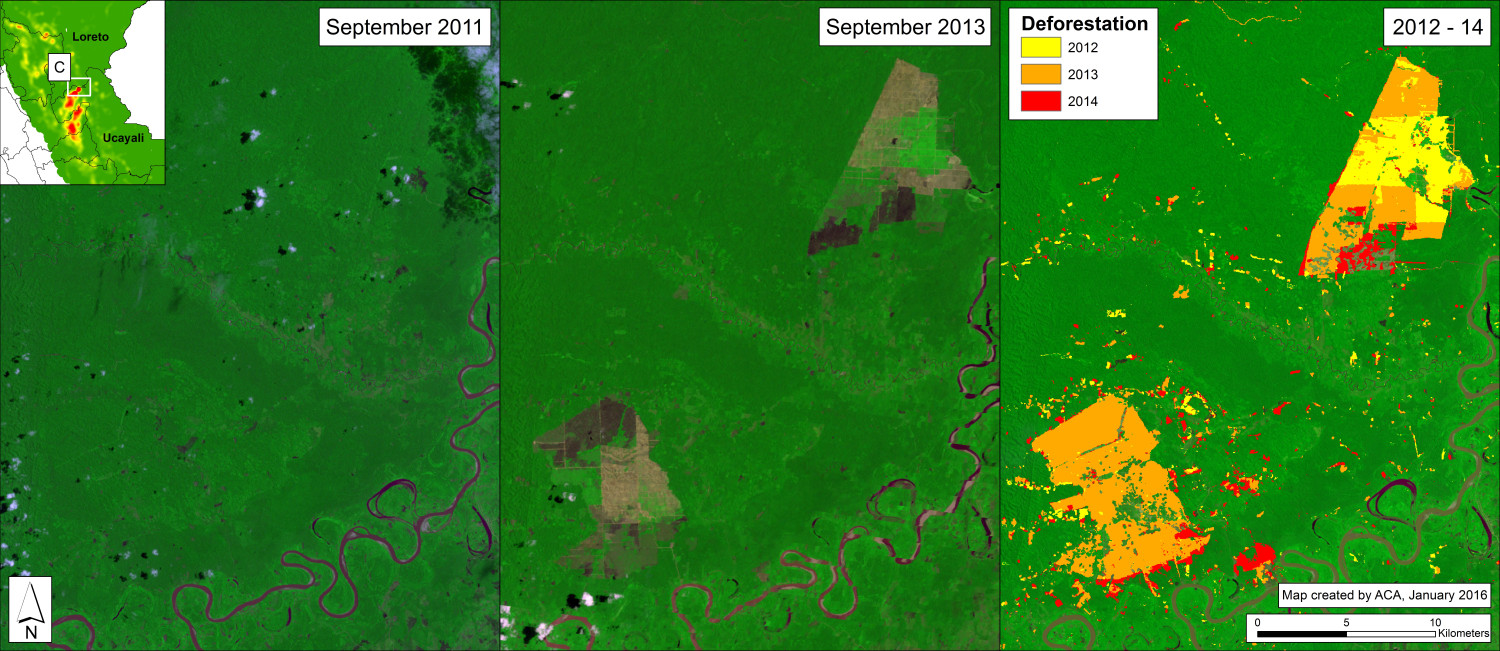
Image 25d. Deforestation for oil palm in central Peru between September 2011 (left panel) and September 2013 (center panel) and cumulative 2012-14 (right panel). Data: USGS, PNCB/MINAM, Hansen/UMD/Google/USGS/NASA

Inset C (from Image 25a) indicates the deforestation of 9,400 hectares (23,200 acres) of primary forest for two large-scale oil palm plantations in the department of Ucayali. Image 25d highlights this area, showing the forest loss between September 2011 (left panel) and September 2013 (center panel; the pinkish-black areas indicate recently cleared forests). The right panel shows the cumulative deforestation between 2012 and 2014. See MAAP #4 for more details.

Inset D: Gold Mining in Madre de Dios

Peru_KD_D_3panel_v1
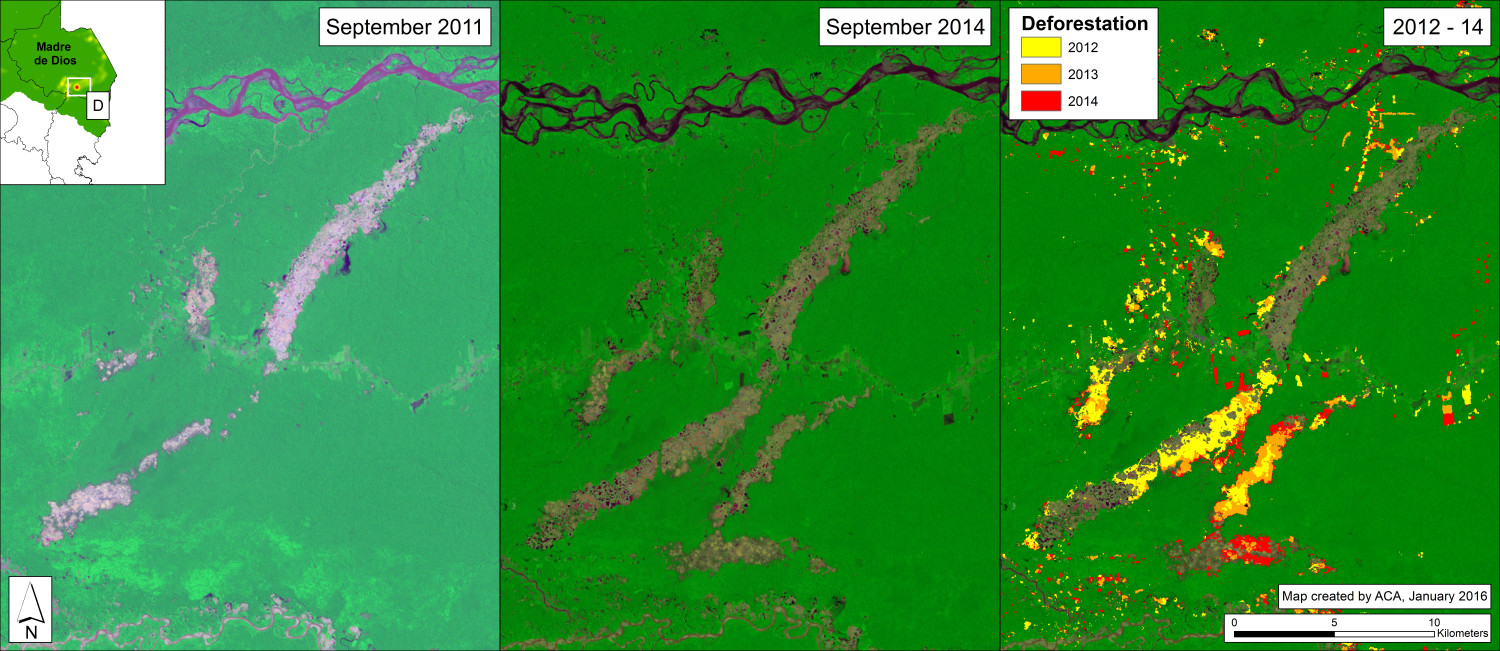
Image 25e. Deforestation for gold mining in southern Peru between September 2011 (left panel) and September 2014 (center panel) and cumulative 2012-14 (right panel). Data: USGS, PNCB/MINAM, Hansen/UMD/Google/USGS/NASA

Inset D (from Image 25a) indicates the extensive illegal gold mining deforestation in the buffer zone of Tambopata National Reserve in the department of Madre de Dios. Image 25e highlights this area, showing the forest loss between September 2011 (left panel) and September 2014 (center panel; the lighter areas indicate recently cleared forests). The right panel shows the cumulative deforestation between 2012 and 2014 (4,738 hectares, or 11,700 acres). See MAAP #1 for more details.

It is important to emphasize that in this case, extensive deforestation continued in 2015. See MAAP #12 and MAAP #24 for more details.

Methodology

We conducted this analysis using the Kernel Density  tool from Spatial Analyst Tool Box of ArcGis 10.1 software. Our goal was to emphasize local concentrations of deforestation in the raw data while still representing overarching patterns of deforestation between 2012 and 2014. We accomplished this using the following parameters:

Search Radius: 15000 layer units (meters)

Kernel Density Function: Quadratic

Cell Size in the map: 200 x 200 meters (4 hectares)

Everything else was left to the default setting.

References

1MINAGRI-SERFOR/MINAM-PNCB (2015) Compartiendo una visión para la prevención, control y sanción de la deforestación y tala ilegal.

Citation

Finer M, Snelgrove C, Novoa S (2015) Deforestation Hotspots in the Peruvian Amazon, 2012-2014. MAAP: 25.

MAAP #23: Increasing Deforestation along lower Las Piedras River (Madre de Dios, Peru)

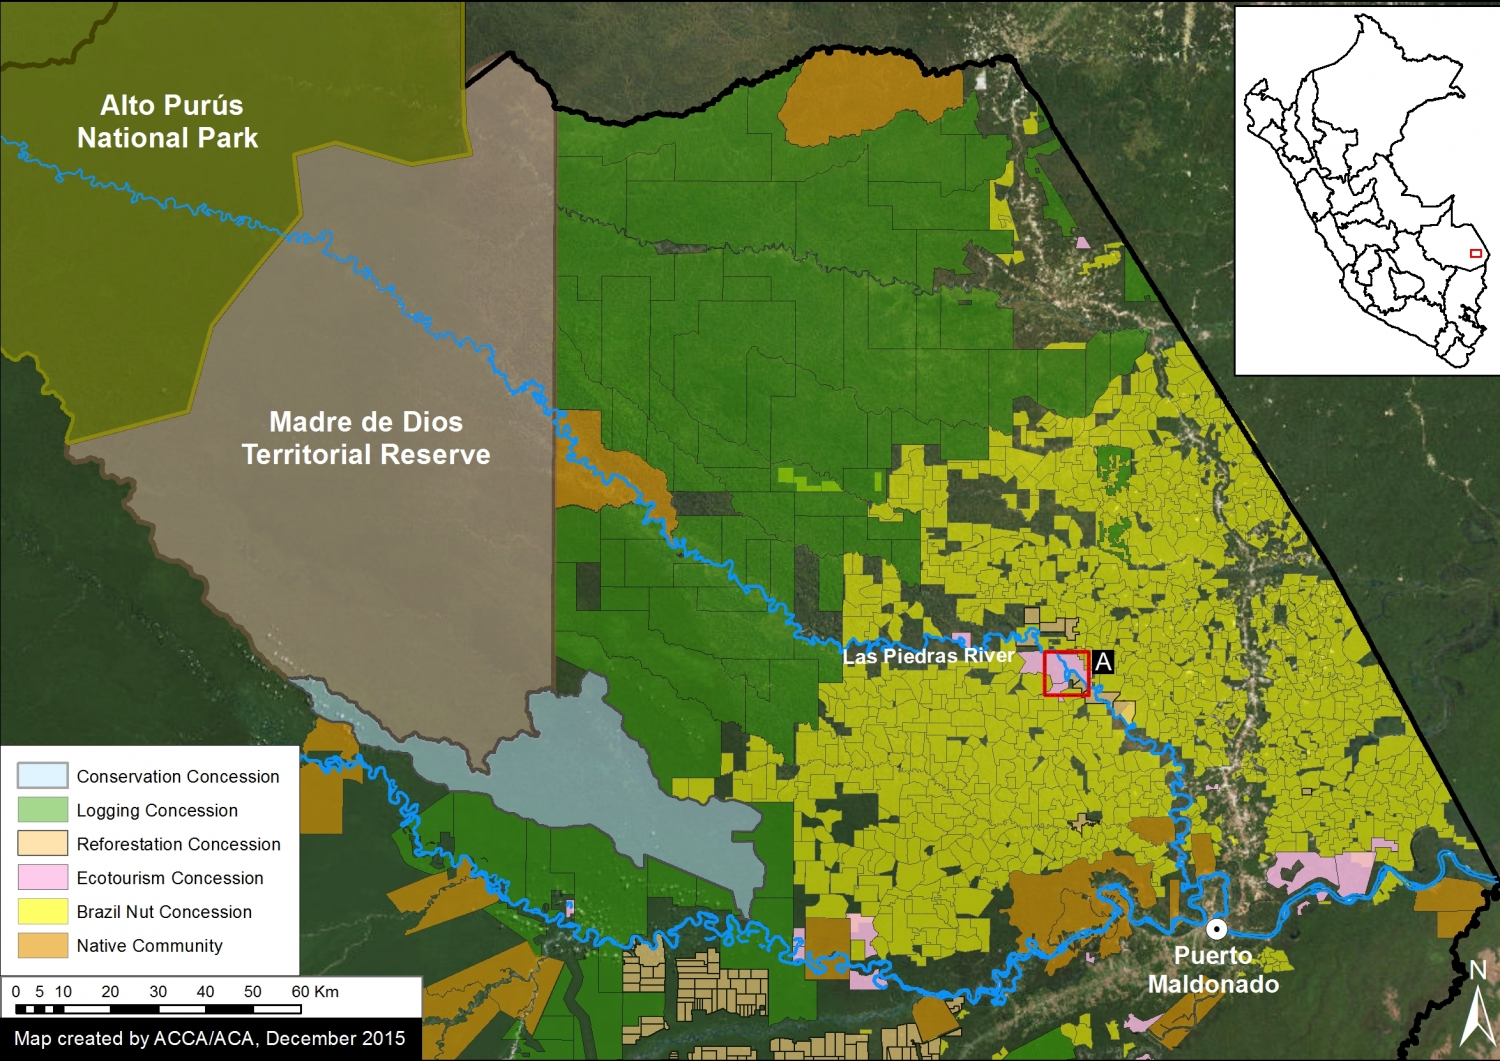
The Las Piedras River in the southern Peruvian Amazon (department of Madre de Dios) is increasingly recognized for its outstanding wildlife (for example, see this video by naturalist and explorer Paul Rosolie, and this trailer for the upcoming film Uncharted Amazon). As seen in Image 23a, its headwaters are born in the Alto Purus National Park, but the lower Las Piedras is surrounded by a mix of different types of forestry concessions (logging, Brazil nut harvesting, ecotourism, and reforestation).

Here in MAAP #23, we document the growing deforestation on the lower Las Piedras River in the area surrounding the community of Lucerna (see red box in Image 23a for context).

Image Xa. Las Piedras River and surrounding designations. Data: MINAGRI, IBC, SERNANP.
Image 23a. Las Piedras River and surrounding designations. Data: MINAGRI, IBC, SERNANP.

Deforestation Analysis

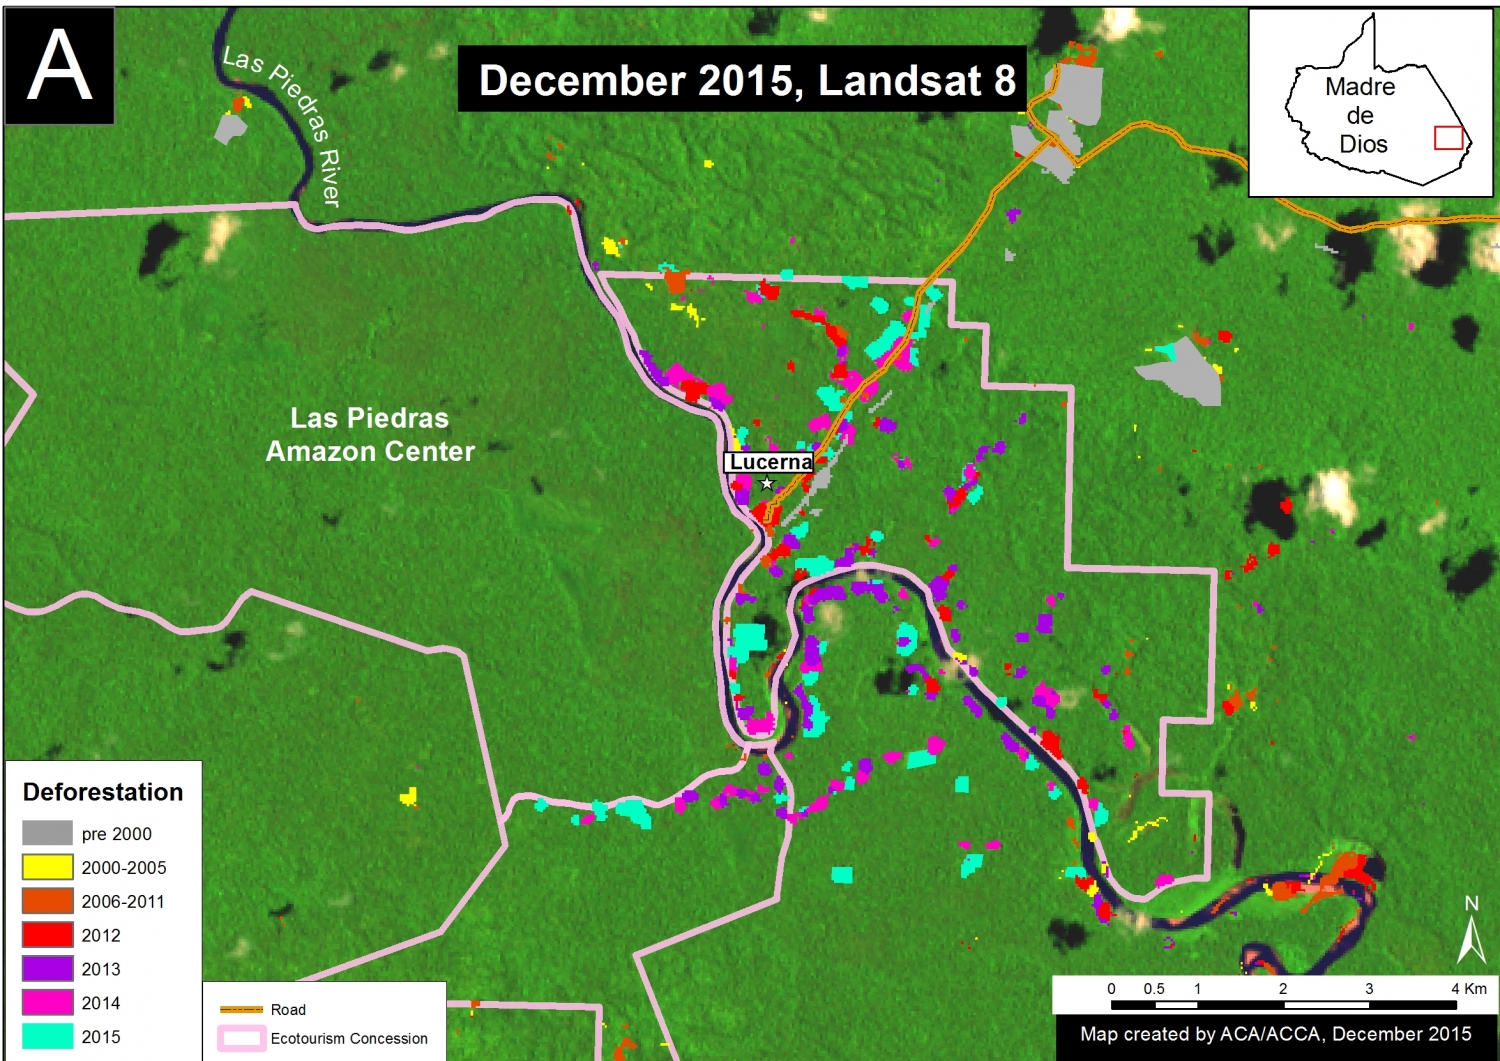
Image 23b shows our deforestation analysis for an area along the lower Las Piedras River near the community of Lucerna (see red box in Image 23a for context). We found a sharp increase in deforestation starting in 2012. In the 11 years between 2000 and 2011, we detected the deforestation of 88 hectares (218 acres). In contrast, in the 4 years between 2012 and 2015, we detected the deforestation of 472 hectares (1,166 acres). 2015 had the highest deforestation total with 155 hectares (383 acres).

Image Xb. Lower Las Piedras River deforestation analysis. Data: MINAGRI, PNCB/MINAM, Hansen/UMD/Google/USGS/NASA.
Image 23b. Lower Las Piedras River deforestation analysis. Data: MINAGRI, CLASlite, PNCB/MINAM, Hansen/UMD/Google/USGS/NASA.

Note that the Las Piedras Amazon Center (LPAC) Ecotourism Concession represents an effective barrier to deforestation. However, note that two other, less active, ecotourism concessions are experiencing extensive deforestation. The 4,460 hectare LPAC concession (which was created in 2007 and transferred to ARCAmazon in March 2015) hosts an active tourist lodge, research center,  and Forest Ranger Protection Program, which employs local people to patrol the area while monitoring wildlife and human impacts.

Image Xc. Recent Landsat image showing deforestation along lower Las Piedras. Data: USGS,MINAGRI.
Image 23c. Recent Landsat image showing deforestation along lower Las Piedras. Data: USGS,MINAGRI.

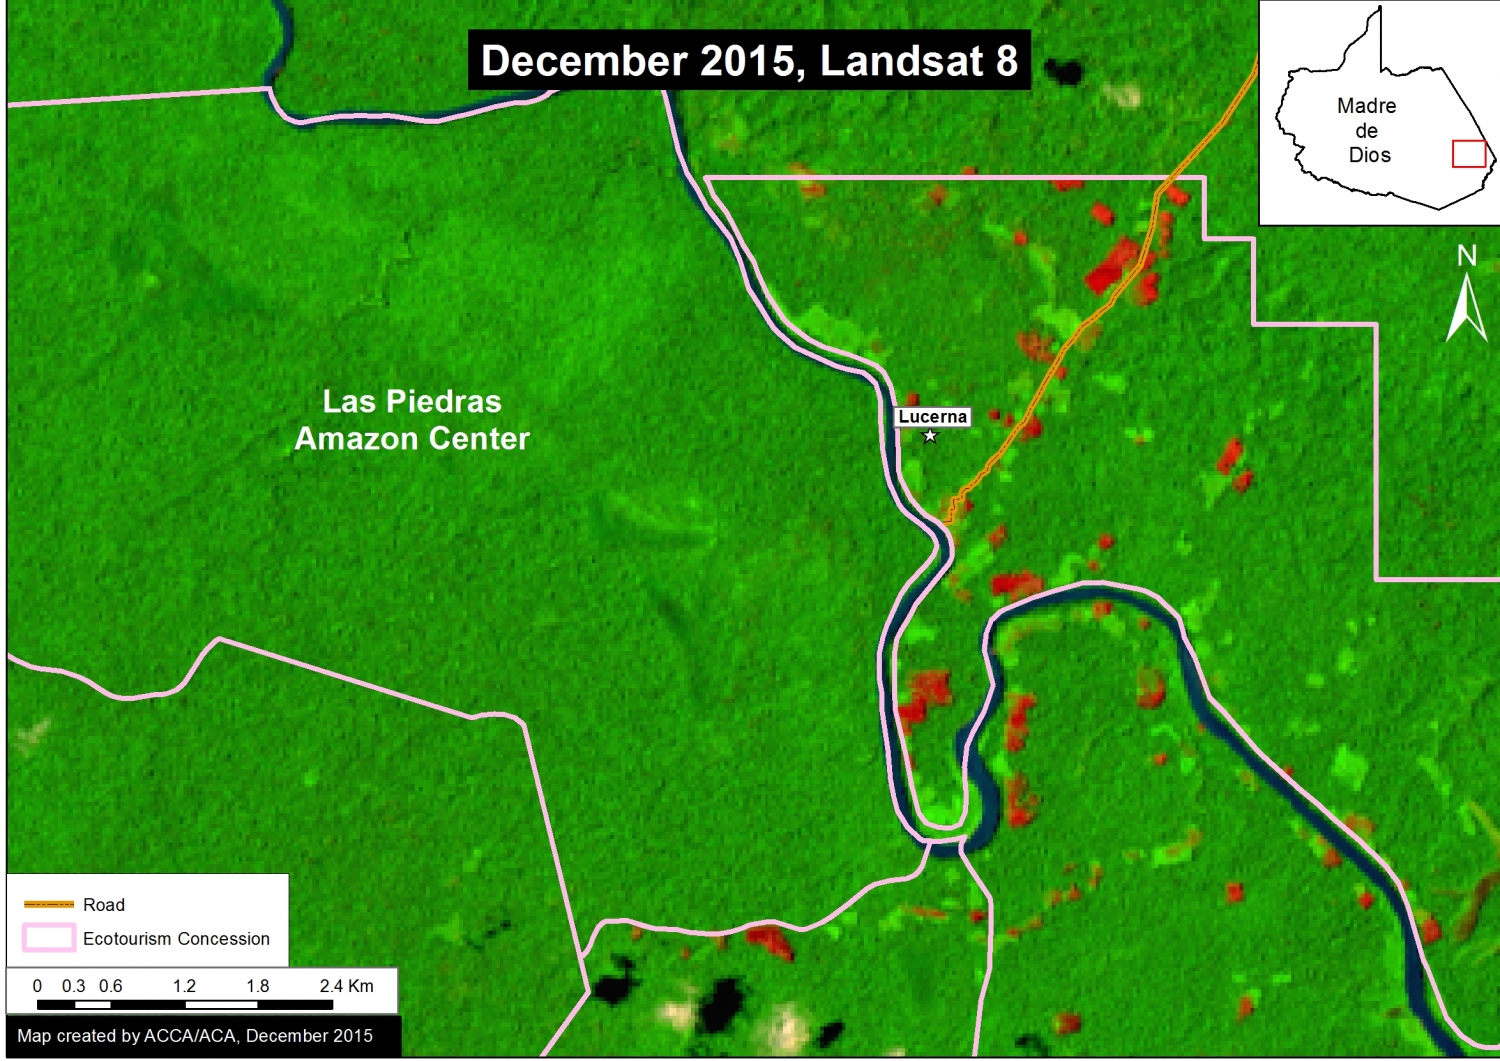
Image 23c shows a very recent (December 2015) Landsat image of the deforestation highlighted in Image 23b. The pinkish-red areas indicate the most recently cleared forests. We have received information indicating that much of this new deforestation is associated with cacao plantations. Cacao is of course used to produce chocolate.

Citation

Finer M, Pena N (2015) Increasing Deforestation along lower Las Piedras River (Madre de Dios, Peru). MAAP #23

MAAP Synthesis #1: Patterns and Drivers of Deforestation in the Peruvian Amazon

We present a preliminary analysis of current patterns and drivers of deforestation in the Peruvian Amazon. This analysis is largely based on the first 15 articles published on MAAP between April and September 2015, but also incorporates information from other relevant sources. We describe this analysis as preliminary because as MAAP research continues, we will be able to improve and refine our synthesis in subsequent editions.
MAAP_Synthe_Sa_v4_en
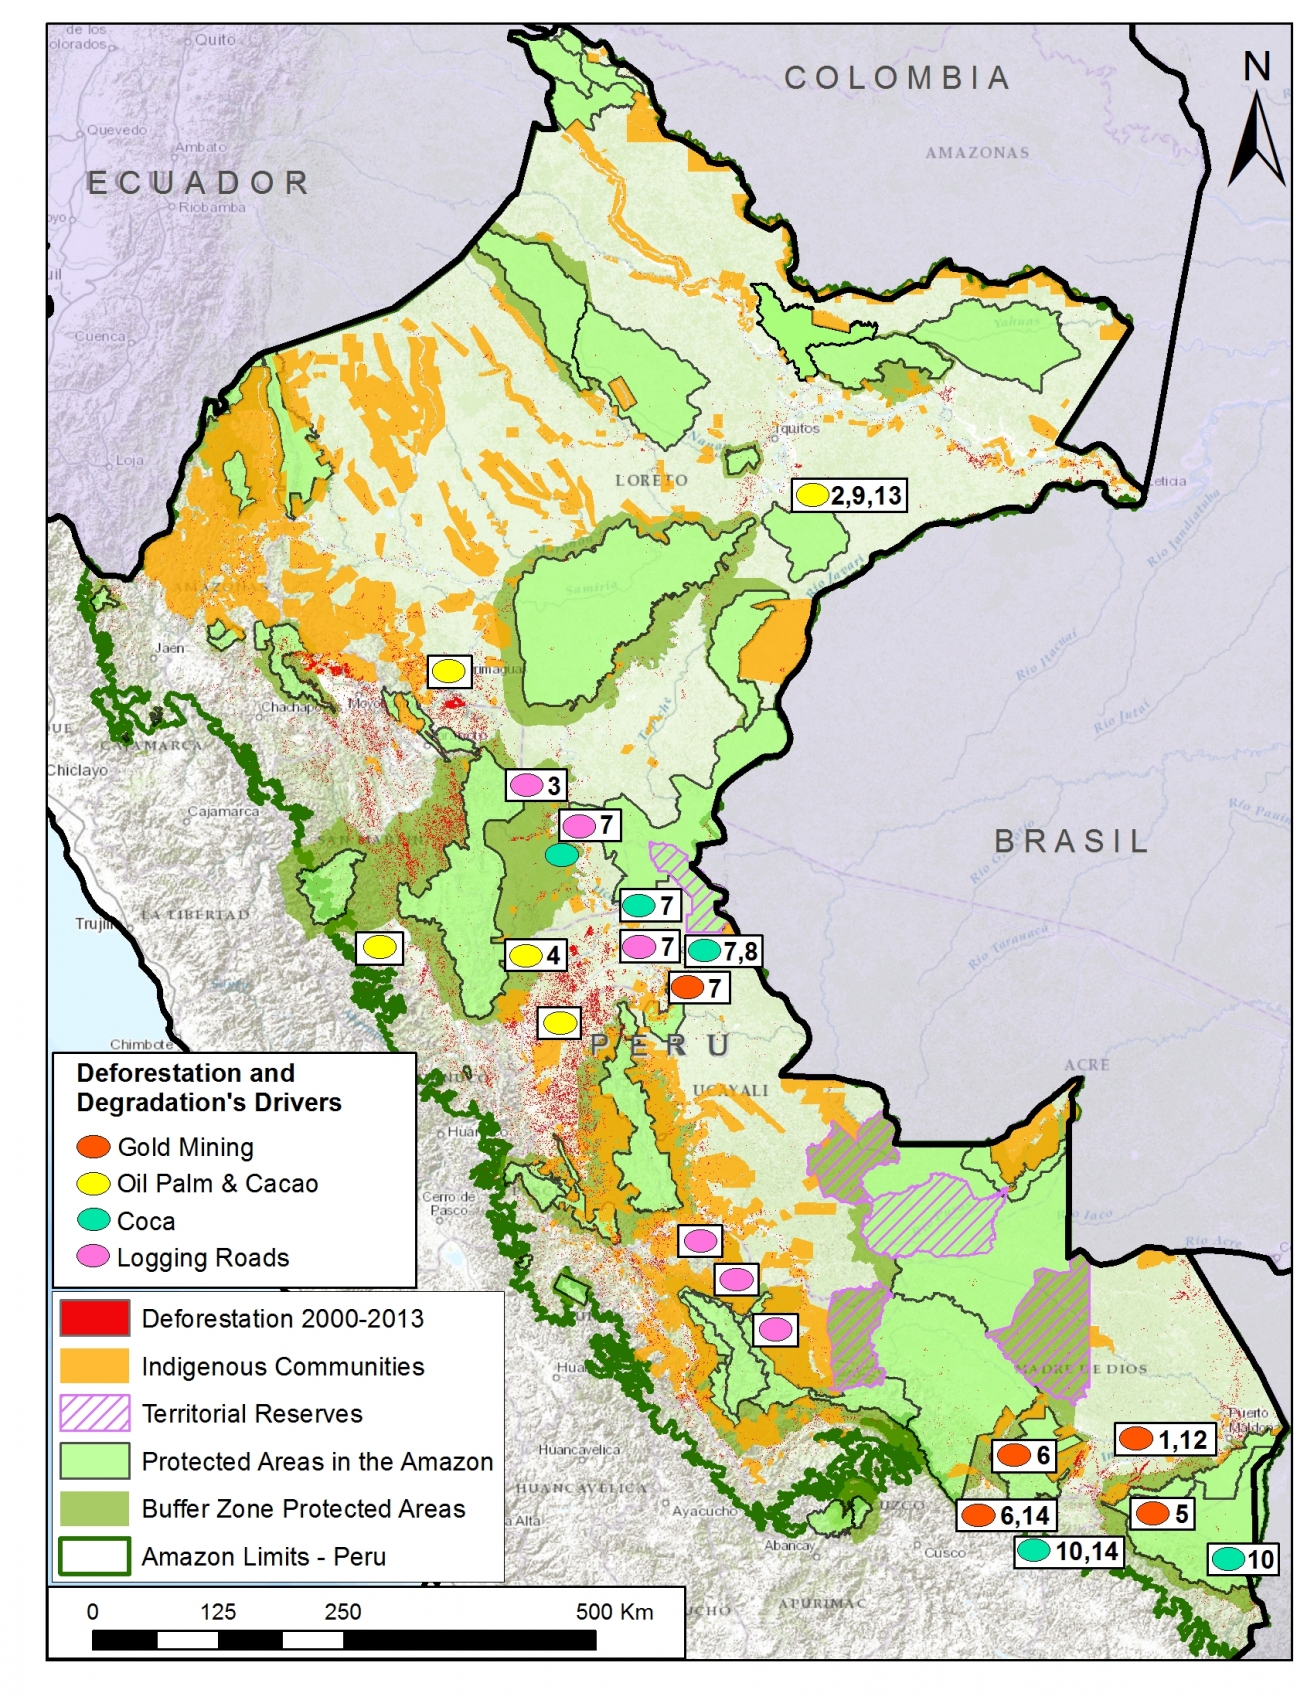
Image S1a. Recent patterns and drivers of deforestation in the Peruvian Amazon. Numbers indicate relevant MAAP article. Data: SERNANP, IBC, MINAM-PNCB/MINAGRI-SERFOR, MAAP.

Introduction & Summary of Key Results

Image S1a illustrates recent (2000 – 2013) patterns of deforestation in the Peruvian Amazon based on data from the Peruvian Ministries of Environment[i] and Agriculture[ii]. These two Ministries have documented a total forest loss of around 1.65 million hectares (ha) in the Peruvian Amazon between 2001 and 2014, with an increasing trend in recent years (2014 had the highest forest loss on record with 177,571 ha)[iii],[iv]. Another recent report by the Peruvian government stated that the majority (75%) of the Amazonian deforestation is due to small-scale clearings related to agriculture and livestock activities, usually near roads or rivers[v].

Building off of that historical and annual information, our goal at MAAP is to monitor deforestation in near real-time. Since April 2015, we have published numerous articles analyzing areas in the northern, central, and southern Peruvian Amazon. In this initial analysis, we have found that three of the most important drivers of deforestation are large-scale oil palm (and cacao) plantations, gold mining, and coca cultivation. We also found a growing network of logging roads that contribute to forest degradation. Image S1a displays the general geographic distribution of these drivers of deforestation and degradation.

We estimate that around 30,000 hectares of primary forest was cleared since 2000 for large-scale oil palm and cacao plantations. Cacao has recently joined oil palm as a deforestation driver due to the arrival of the company United Cacao and their implementation of the large-scale agro-industrial model in place of traditional small-scale plantations on previously degraded lands.

Gold mining has directly caused the deforestation of over 43,000 ha since 2000, mostly in the region of Madre de Dios. In recent years, this deforestation has been concentrated in the Tambopata National Reserve buffer zone.

Although coca cultivation is reportedly declining in Peru, we found that it remains a major driver of deforestation, particularly within and around remote protected areas. For example, we documented 143 ha of coca related deforestation within the Sierra del Divisor Reserved Zone, and an additional 2,638 ha related to shifting agricultural cultivation, which includes coca, within and around Bahuaja Sonene National Park.

We also documented a recent expansion of logging roads in the central Peruvian Amazon. This finding is significant because it is difficult to detect selective logging in satellite imagery, but now we can at least detect the roads that indicate that selective logging is taking place in a given area.

We identified some important geographic patterns related to the four drivers described above. For example, large-scale oil palm (and cacao) are concentrated in the northern Peruvian Amazon, while gold mining deforestation has largely been in the south. Coca-driven deforestation appears to be particularly problematic in the southern Peruvian Amazon, but also exists in the north. The construction of new logging roads is currently most active in the central Peruvian Amazon.

The documented deforestation is caused by both illegal and legal means. For the former, there is extensive deforestation from illegal gold mining and coca cultivation. Regarding the latter, oil palm and cacao companies are exploiting loopholes in the Peruvian legal framework that facilitate large-scale deforestation for agricultural projects.

Large-scale Agriculture (Oil Palm and Cacao)
MAAP_Synthe_Sb_v4_en
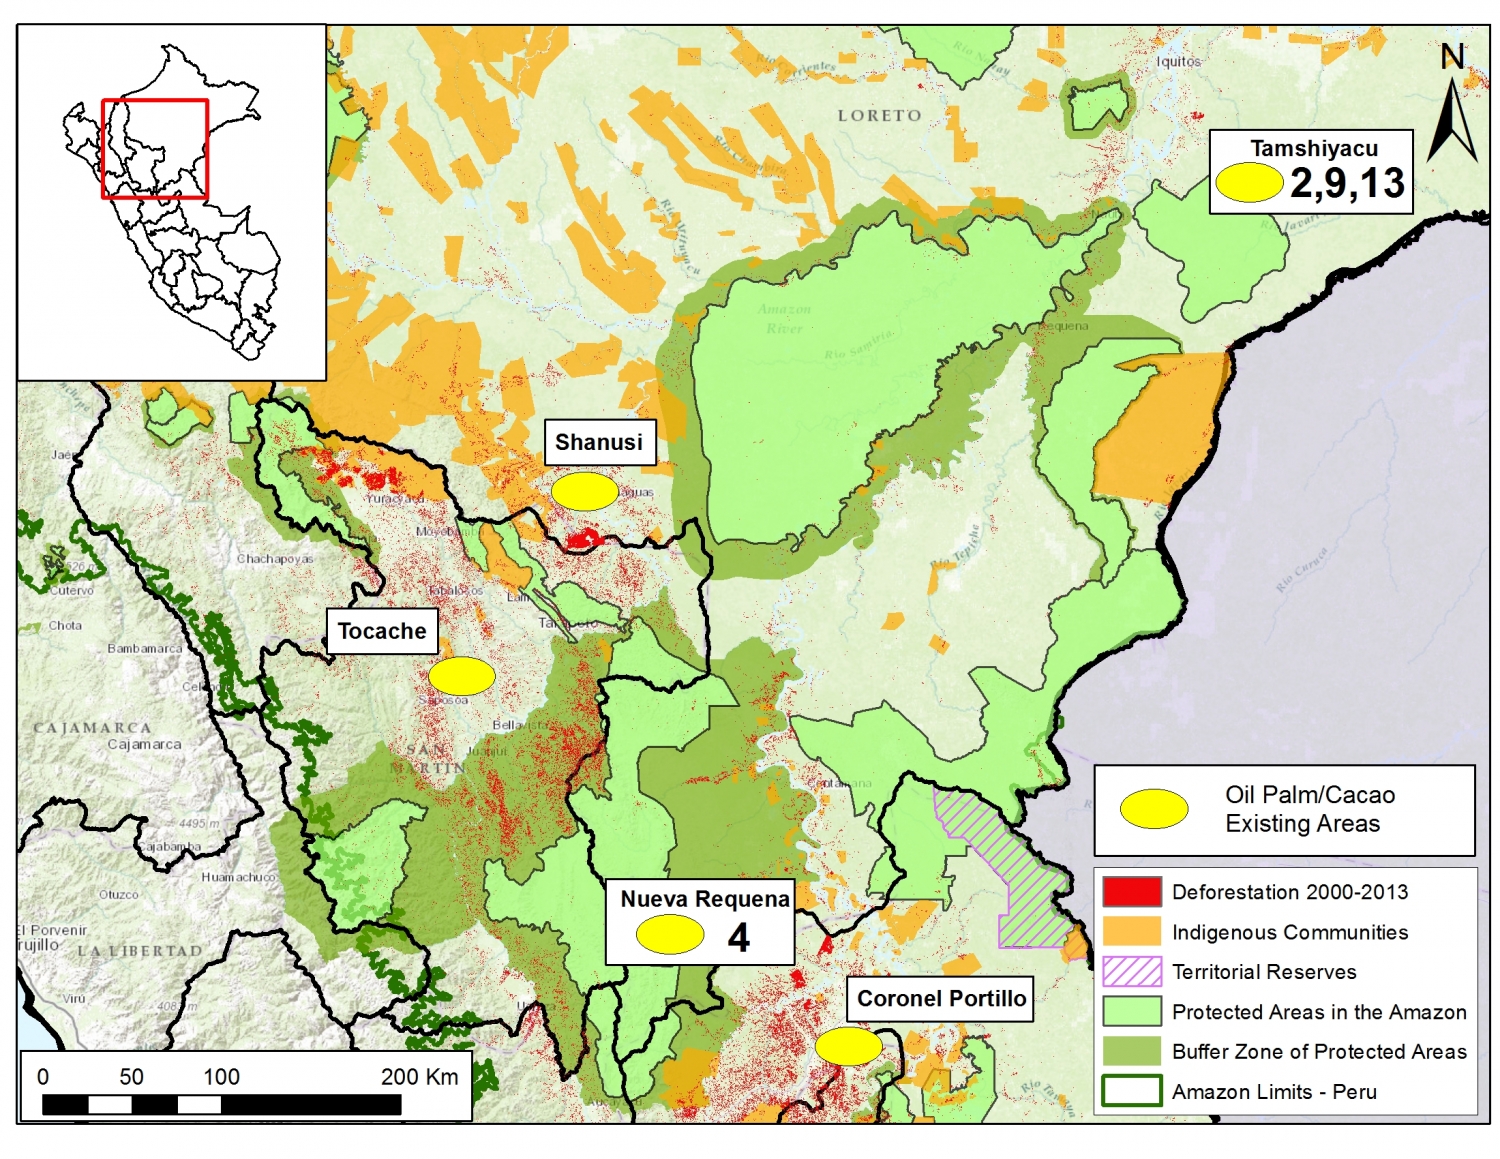
Image S1b. Large-scale agriculture deforestation in the northern Peruvian Amazon. Numbers indicate relevant MAAP article. Data: SERNANP, IBC, MINAM-PNCB/MINAGRI-SERFOR, MAAP.

Image S1b illustrates that large-scale agriculture (namely oil palm and cacao) is an important cause of deforestation in northern Peru.

Importantly, several oil palm and cacao companies are changing the production model in Peru from small-scale to large-scale agro-industrial. For example, in a recent interview, United Cacao CEO Dennis Melka stated that his company is trying to replicate the agro-industrial model used by oil palm companies in Southeast Asia[vi].

This shift is noteworthy because large-scale plantations usually come at the expense of forests, while small-scale plantations are better able to take advantage of previously cleared lands[vii]. We estimate that over 30,000 hectares of primary forest was cleared since 2000 for large-scale oil palm and cacao plantations (see below). Much less primary forest, around 575 ha, was cleared for small-scale oil palm (we have yet to evaluate small-scale cacao).

Note that we emphasize the clearing of primary forest. We conducted an additional analysis to determine whether oil palm (both small and large-scale) and cacao (just large-scale) plantations were originally sited on lands with primary forest, secondary forest, or already deforested. We defined primary forest as an area that from the earliest available Landsat, in this case 1990, was characterized by dense closed canopy forest cover.

The following is a concise breakdown of how we calculated the 30,000 ha of primary forest loss from large-scale plantations.

MAAP articles #2, #9, and #13 demonstrated that 2,276 ha of primary forest was cleared by United Cacao between May 2013 and September 2015 outside of the town of Tamshiyacu in the northern Peruvian Amazon (Loreto region).

MAAP article #4 detailed the deforestation of 9,400 ha of primary forest (plus an additional 2,350 ha of secondary forest) between 2011 and 2015 for two large-scale oil palm projects near the town of Nueva Requena in the central Peruvian Amazon (Department of Ucayali).

In addition, yet unpublished MAAP analysis shows that in Palmas de Shanusi/Oriente (oil palm projects operated by the company Grupo Palmas), 6,974 ha of primary forest were cleared between 2006 and 2011, although the legally mandated 30% forest cover reserves were maintained. An additional 8,225 ha of primary forest was cleared in areas immediately surrounding the concessions.

Finally, although not yet published on MAAP, we also documented nearly 3,500 ha of primary forest loss in other large-scale oil palm projects in San Martin and Ucayali regions.

It is important to emphasize that several oil palm and cacao companies are exploiting various loopholes in the Peruvian legal framework that facilitate large-scale deforestation for agricultural projects[viii]. In fact, these companies argue that according to Peruvian law, they are engaged in legal “forest clearing”, not illegal “deforestation”[ix].

Gold Mining
MAAP_Synthe_Sc_v4_en
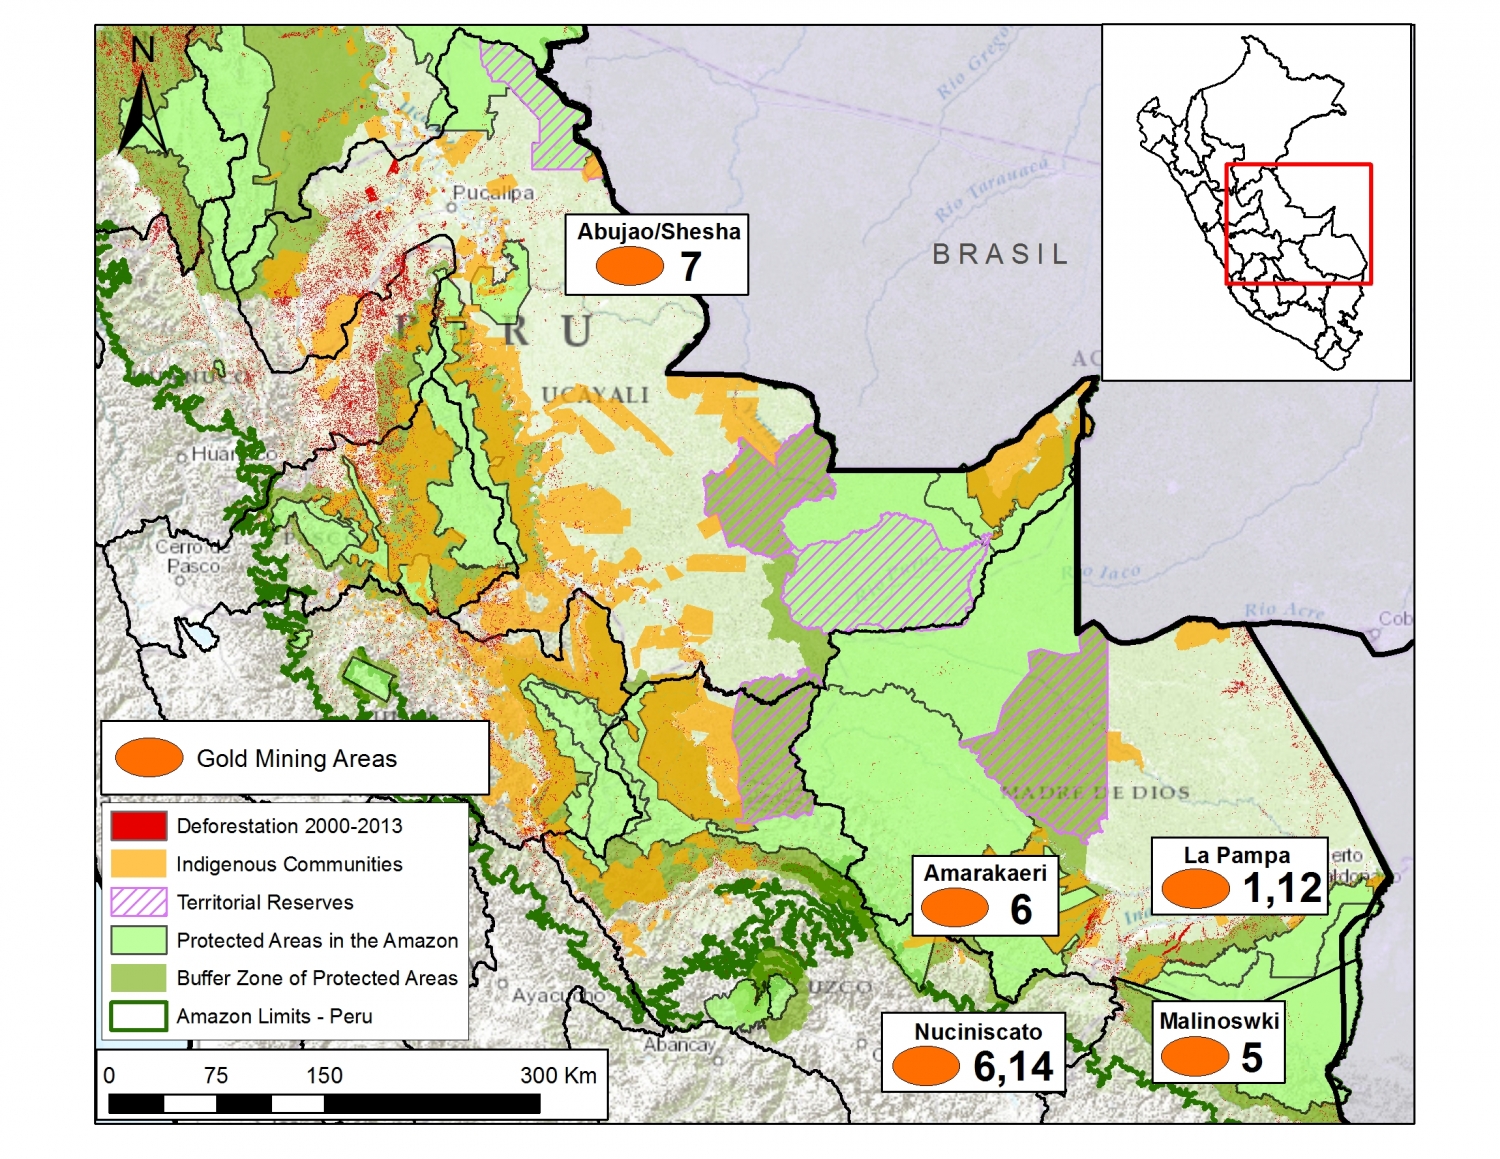
Image S1c. Gold mining deforestation in the Peruvian Amazon. Numbers indicate relevant MAAP article. Data: SERNANP, IBC, MINAM-PNCB/MINAGRI-SERFOR, MAAP.

Image S1c illustrates that gold mining-driven deforestation is largely concentrated in the southern Peruvian Amazon, particularly in the region of Madre de Dios and adjacent Cusco.

According to the scientific literature, gold mining deforestation in Madre de Dios increased from 10,000 ha in 2000 to 50,000 ha in 2012[x]. MAAP articles #1, #5, and #12 documented the deforestation of an additional 2,774 ha between 2013 and 2015 in two gold mining hotspots (La Pampa and Upper Malinowski), both of which are located within the buffer zone of the Tambopata National Reserve. In addition, MAAP #6 showed gold mining deforestation expanding from another Madre de Dios gold mining hotspot (Huepetuhe) into the tip of Amarakaeri Communal Reserve (11 ha).

Much of the Madre de Dios gold mining deforestation described above is illegal because it is occurring within and around protected areas where mining is not permitted under the government-led formalization process.

MAAP articles #6 and #14 detailed recent gold mining deforestation in the region of Cusco. Specifically, we documented the deforestation of 967 ha along the Nuciniscato River and its major tributaries since 2000 (with the vast majority occurring since 2010). Much of this deforestation appears to be linked to gold mining.

Thus, the total documented gold mining deforestation in Madre de Dios and adjacent Cusco is at least 53,750 ha[xi], over 80% of which has occurred since 2000. This total is an underestimate since we have not yet done detailed studies for 2013 – 2015 deforestation in all of the known gold mining zones in these two regions.

In addition, MAAP #7 showed two gold mining zones in the region of Ucayali (along the Sheshea and Abujao Rivers, respectively). Much of this deforestation occurred between 2000 and 2012.

Finally, there are also reports of extensive gold mining in northern Peru (the regions of Amazonas and Loreto) but we do not yet have data showing that it is causing deforestation.

Coca
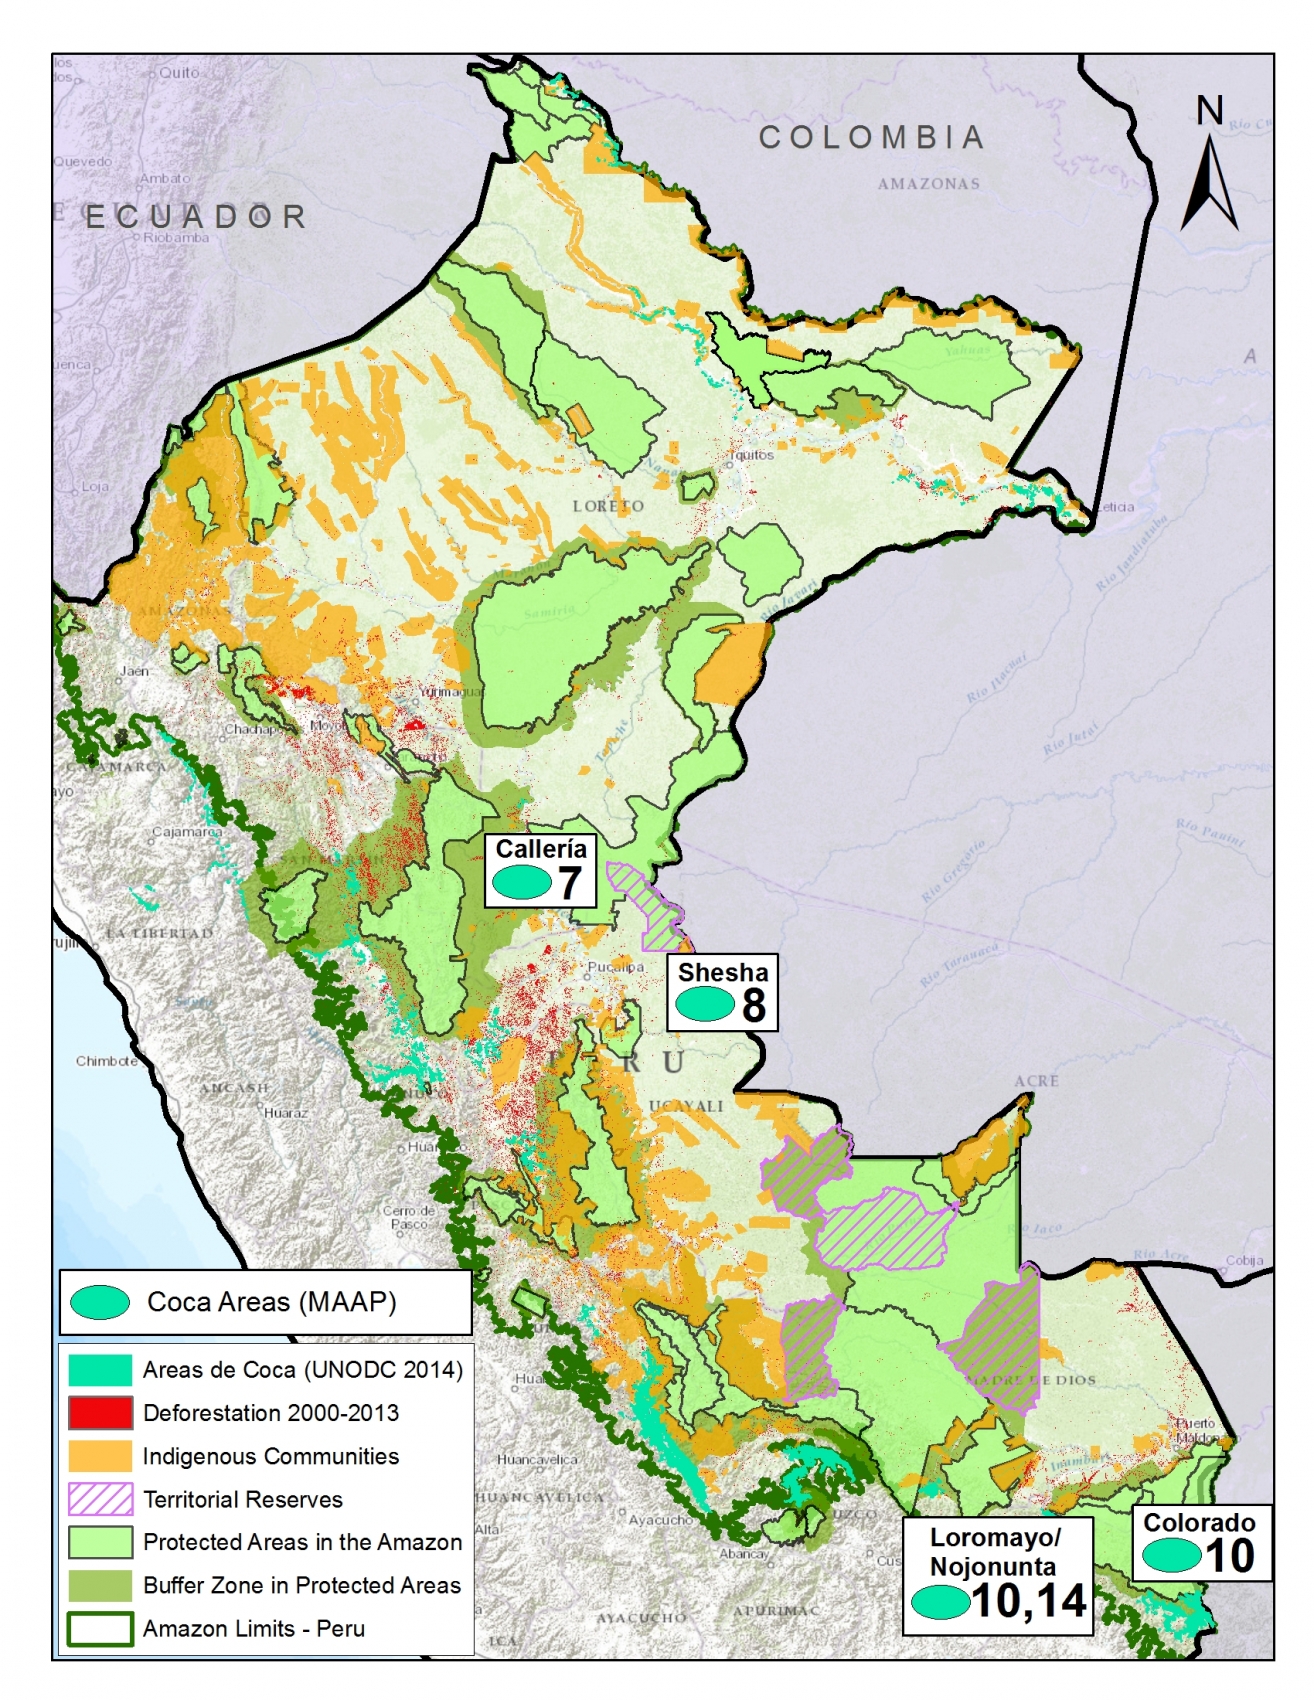
MAAP_Synthe_Sd_v4_en
Image S1d. Coca cultivation areas in the Peruvian Amazon. Numbers indicate relevant MAAP article. Data: UNODC 2014, MINAM-PNCB/MINAGRI-SERFOR, SERNANP, NatureServe.

Although the most recent report from the United Nations Office on Drugs and Crime (UNODC) indicates that overall coca cultivation is declining in Peru[xii], our research finds that it remains a major driver of deforestation in certain areas, particularly within and around several remote protected areas.

Image S1d displays the distribution of current coca-cultivation areas (in relation to protected areas) based on the data from the latest United Nations report. Of these areas, we have thus far focused on the three detailed below.

MAAP articles #7 and #8 show recent coca-related deforestation within the southern section of the Sierra del Divisor Reserved Zone. This area is particularly important because it is soon slated to be upgraded to a national park. Specifically, we documented coca-related deforestation of 130 ha between 2013 and 2014 within the southwestern section of the reserve, and, most recently, a new plantation of 13 ha during June 2015 within the southeast section.

MAAP article #10 revealed that shifting agricultural cultivation, that includes coca, is also a major issue within and around Bahuaja Sonene National Park, located in the southern Peruvian Amazon. Specifically, we found the recent deforestation of 538 hectares within the southern section of the Park, and an additional 2,100 hectares in the surrounding buffer zone. Much of this deforestation is likely linked to coca cultivation since the latest United Nations report indicates these areas contain high coca plantation densities.

MAAP article #14 documents the deforestation of 477 ha along the Nojonunta River in Cusco since 2000 (with a major peak since 2010). Much of this deforestation is likely linked to coca cultivation since the latest United Nations report indicates these areas contain medium to high coca plantation densities. 

Logging Roads
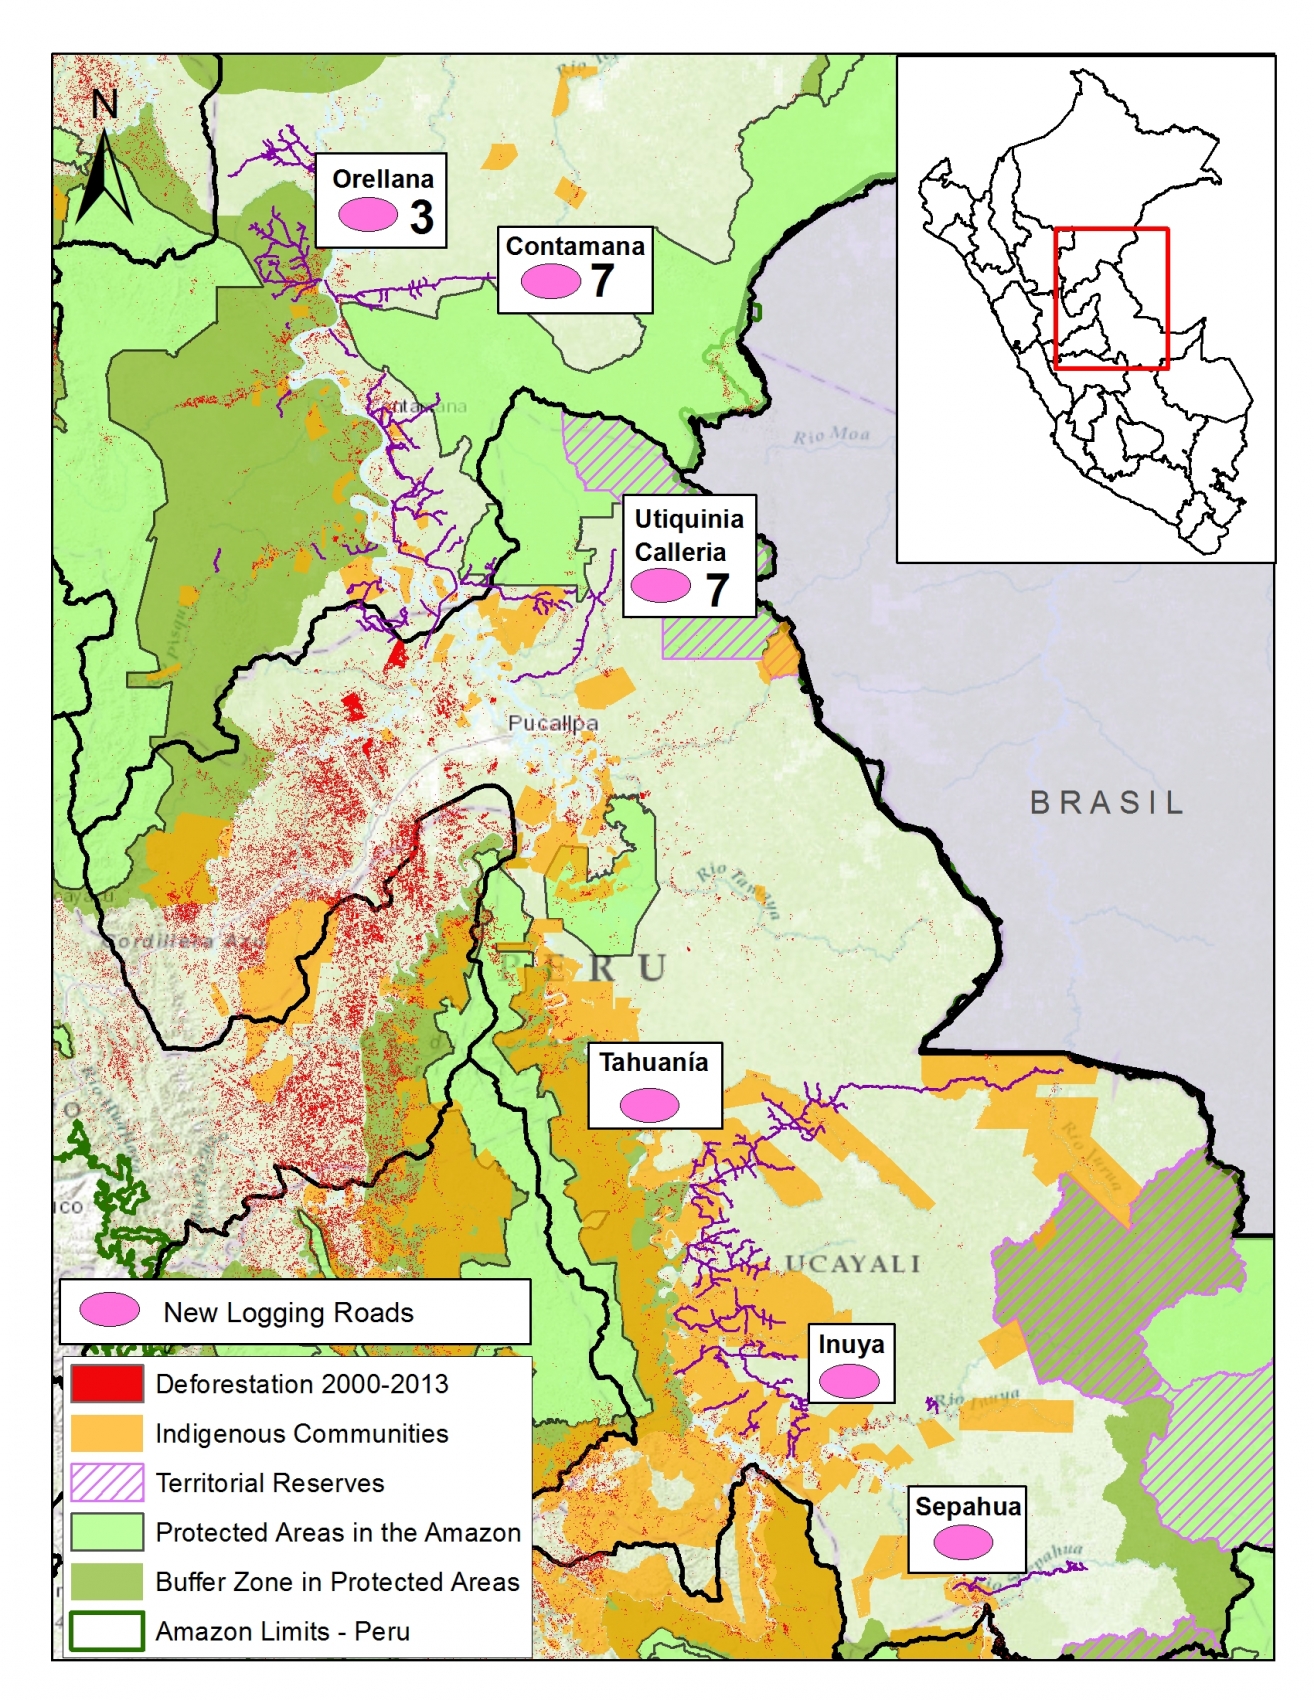
MAAP_Synthe_Se_v4_en
Image S1e. Logging roads in the Peruvian Amazon. Numbers indicate relevant MAAP article. Data: SERNANP, IBC, MINAM-PNCB/MINAGRI-SERFOR, MINAGRI, MAAP.

One of the major advances discovered in this work is the ability to identify the expansion of new logging roads. This advance is important because it is extremely difficult to detect illegal logging in satellite imagery because loggers in the Amazon often selectively cut high value species and do not produce large clearings. But now, although it remains difficult to detect the actual selective logging, we can detect the roads that indicate that selective logging is taking place in that area.

Image S1e illustrates the likely logging roads that we have recently detected. Of these areas, we have thus far focused on the two detailed below.

MAAP article #3 shows the rapid proliferation of two new road networks in the northern Peruvian Amazon (Loreto region). Most notably, it highlights the construction of 148 km of new roads, possibly illegal logging roads, through mostly primary forest between 2013 and 2014. One of the roads is within the buffer zone of the Cordillera Azul National Park.

In addition, MAAP article #7 shows the expansion of new logging roads near both the southern and northwestern sections of the Sierra del Divisor Reserved Zone. In both cases, the expansion is very recent (between 2013 and 2015).


[i] National Program of Forest Conservation for the Mitigation of Climate Change – PNCB.

[ii] Servicio Nacional Forestal y de Fauna Silvestre – SERFOR

[iii] MINAGRI-SERFOR/MINAM-PNCB (2015) Compartiendo una visión para la prevención, control y sanción de la deforestación y tala ilegal.

[iv] Note that some of the documented forest loss may come from natural causes, such as landslides or meandering rivers.

[v] MINAM (2013) Fondo Cooperativo Para El Carbono de los Bosques (FCPF) Plantilla de Propuesta para la Fase de Preparación para REDD+ (Readiness Plan Proposal – RPP). Link: http://www.minam.gob.pe/cambioclimatico/wp-content/uploads/sites/11/2014/03/R-PP-Per%C3%BA-Final-Dec-2013-RESALTADO_FINAL_PUBLICADA-FCPF_24-febrero.pdf

[vi] NF Joan (2015) United Cacao replicates Southeast Asia’s plantation model in Peru, says CEO Melka. The Edge Singapore.Link: http://www.unitedcacao.com/images/media-articles/20150713-the-edge-united-cacao.pdf

[vii] Gutiérrez-Vélez VH, DeFries R, Pinedo-Vásquez M, et al. (2011) High-yield oil palm expansion spares land at the expense of forests in the Peruvian Amazon. Environ. Res. Lett., 6, 044029. Link: http://iopscience.iop.org/article/10.1088/1748-9326/6/4/044029/pdf

[viii] Environmental Investigation Agency (2015) Deforestation by Definition. Washington, DC. Link: http://eia-global.org/news-media/deforestation-by-definition

[ix] Tello Pereyra R (2015) Situacion legal, judicial, y administrativa de  Cacao del Peru Norte SAC. Link: https://www.youtube.com/watch?v=p_YIe70u1oA

[x] Asner GP, Llactayo W, Tupayachia R, Ráez Luna E (2013) PNAS 110 (46) 18454-18459. Link: http://www.pnas.org/content/110/46/18454.abstract

[xi] That is, 50,000 ha from the literature and 3,750 ha from MAAP analysis.

[xii] UNODC (2015) Monitoreo de cultivos ilícitos Perú 2014. Link: https://www.unodc.org/documents/crop-monitoring/Peru/Peru_Informe_monitoreo_coca_2014_web.pdf

Citation

Finer M, Novoa S (2015) Patterns and Drivers of Deforestation in the Peruvian Amazon. MAAP Synthesis #1. Link: https://www.maaproject.org/2015/09/maap-synthesis1/
MAAP #13: Clearing of Primary Forest for Cacao Resumes in Tamshiyacu (Loreto, Peru)

As confirmed in MAAP #9, the company United Cacao (through its subsidiary in Peru, Cacao Peru North) cleared 2,126 hectares of primary forest between May 2013 and August 2014 to establish a large-scale cacao plantation outside the town of Tamshiyacu, in northeastern Peru (Loreto region). New satellite imagery reveals that the forest clearing has recently resumed in 2015. We detected the cutting of 150 hectares in recent months, bringing the total area cleared as part of the United Cacao project to 2,276 hectares.

Tamshiyacu 3panel Ingles_v2

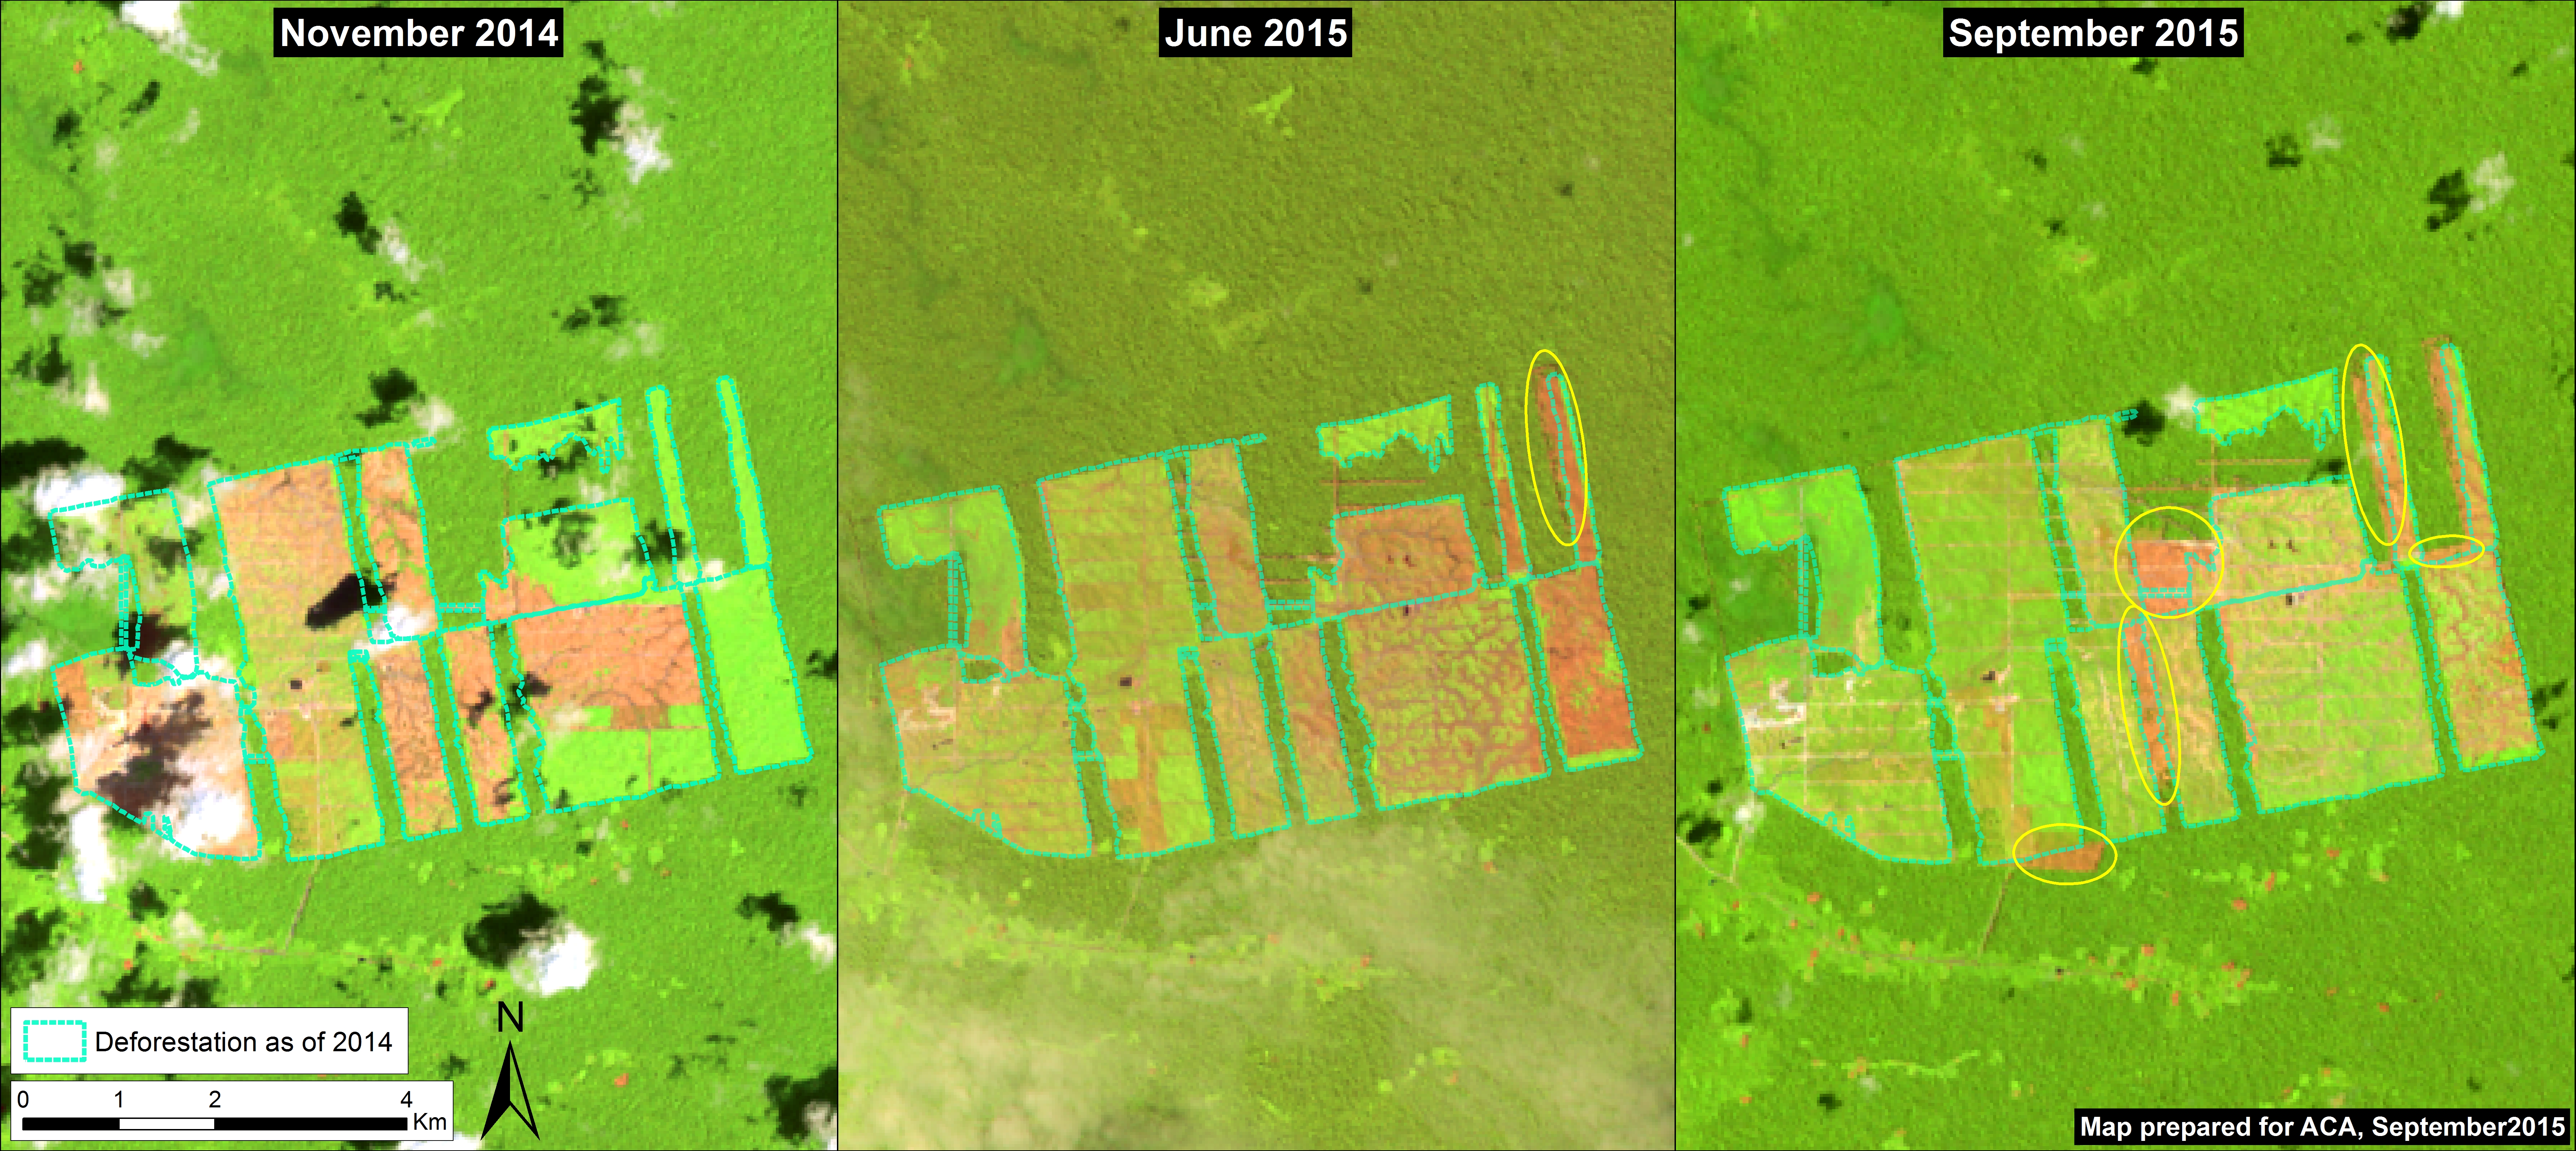
Image 13a shows a series of satellite images (NASA Landsat) taken between November 2014 and August 2015. In these images, a clearing of 24 hectares was detected in the period from November 2014 to June 2015. This reduction in forest clearing was possibly because of the Resolution issued by the Ministry of Agriculture, which temporarily paralyzed the agricultural activities of United Cacao.

However, more recent images have revealed a large increase in forest clearing – 126 hectares – between June and August 2015.

This brings to 2,276 ha the total forest clearing generated by the United Cacao project between May 2013 and August 2015.

In the Landsat images, the dark green color indicates forest cover, the light green secondary vegetation, the pink color indicates exposed ground (a key indicator of forest clearing), while scattered patches in black and white indicate clouds and their shadows.

Forest clearing between June and August 2015

MAAP13_Tam_13d_v4
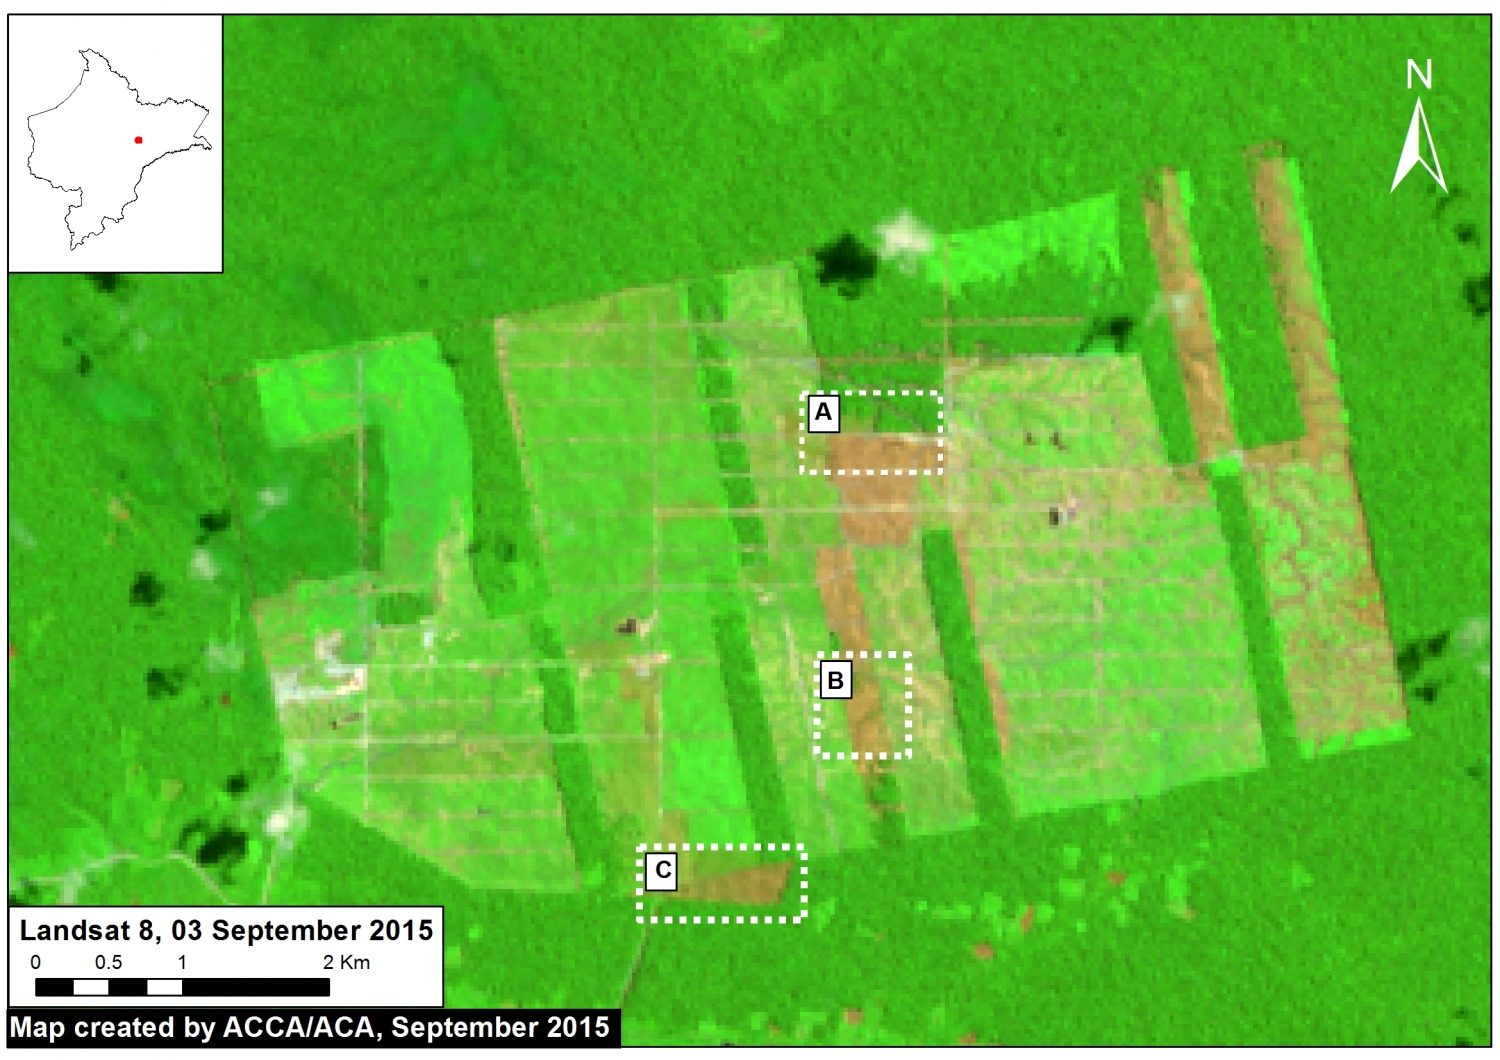
Image 13b Base map indicating the location of a series of zooms. Data: USGS.

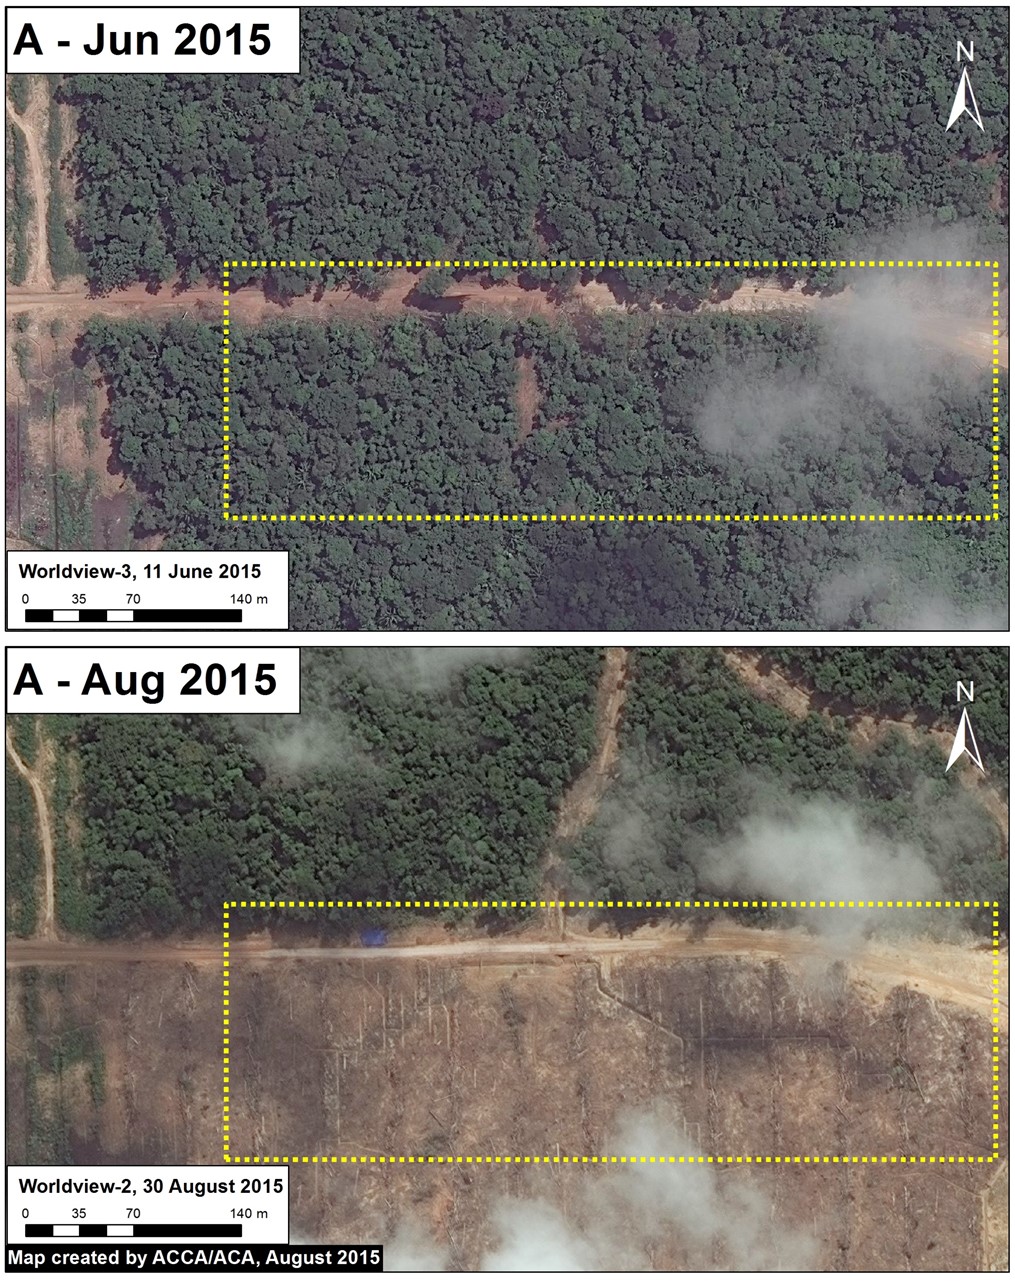
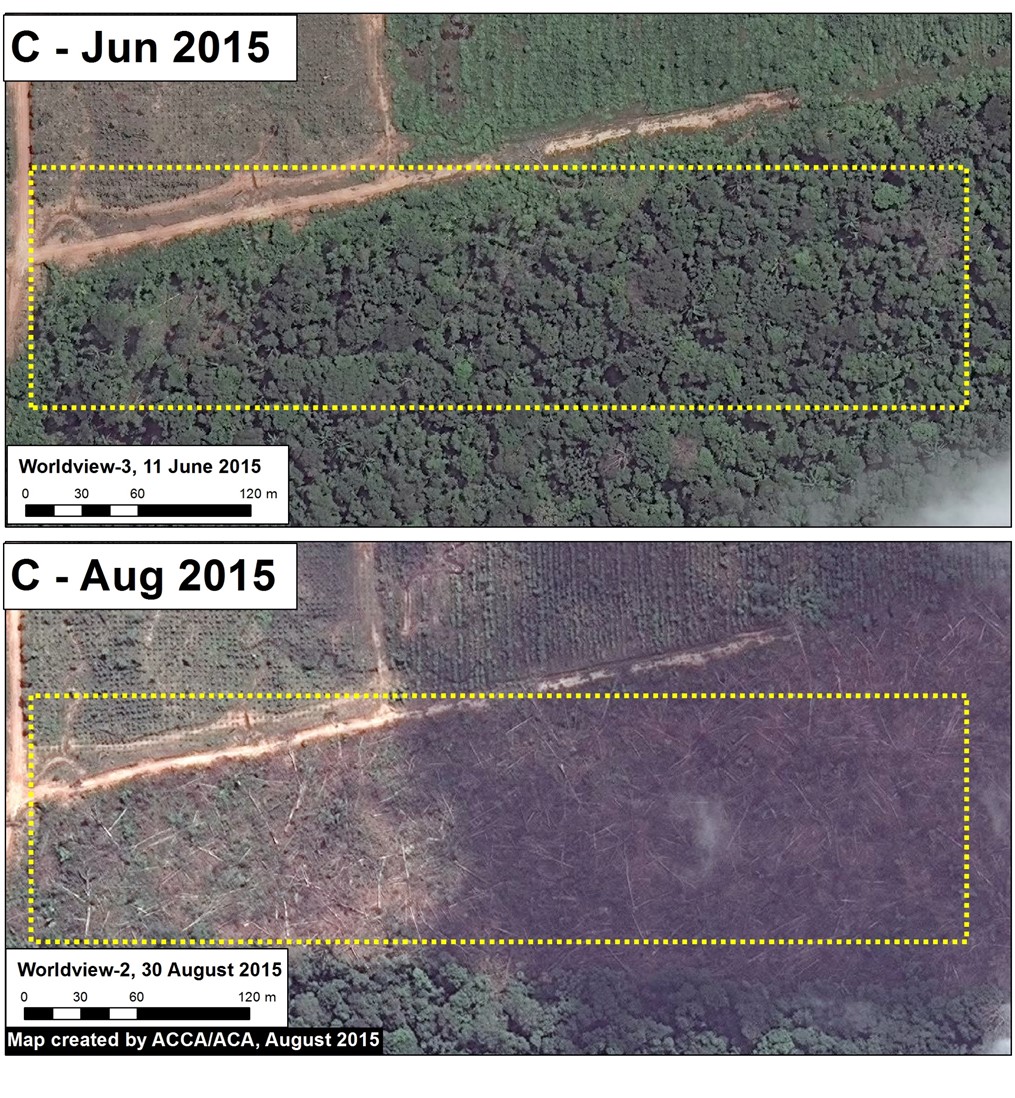
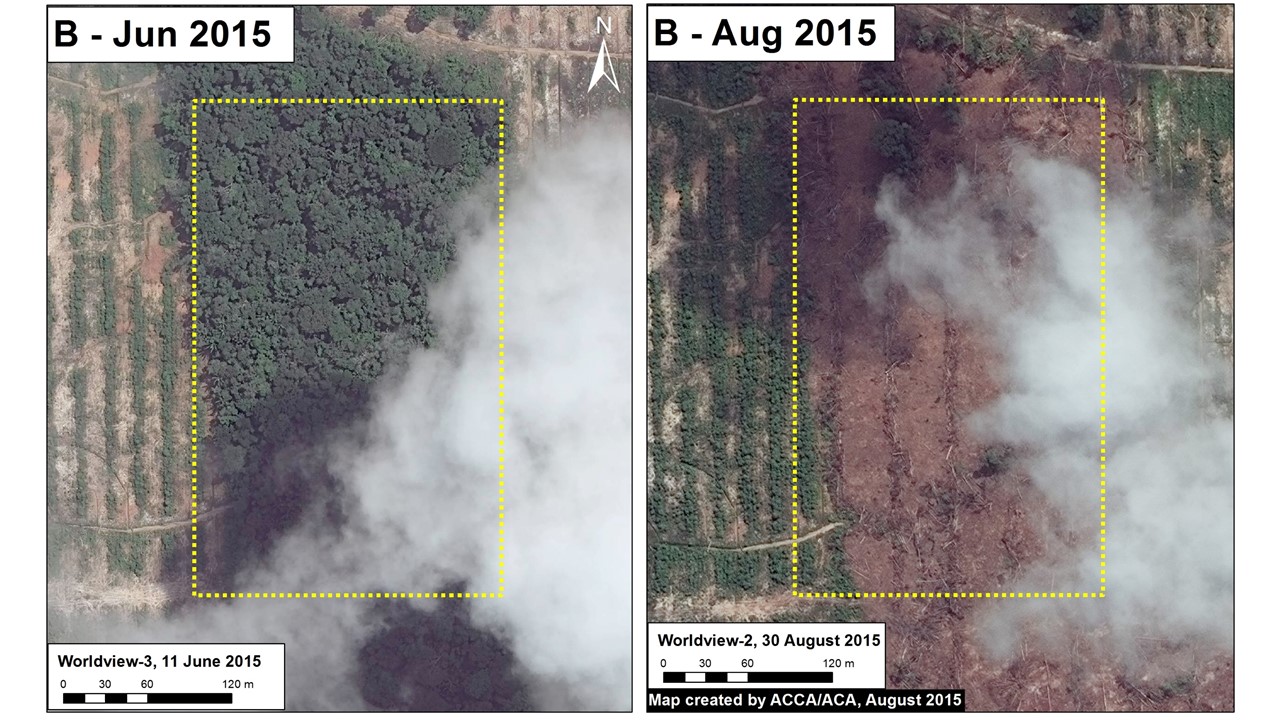
Image 13b indicates the location of a number of zooms (see below) that clearly illustrate the forest clearing that occurred between June and August 2015. The images 13c  13e are of each respective zoom and show each area before and after the forest clearing. Note that Worldview-3 imagery resolution is 33 cm and Worldview-2 imagery resolution is 50 cm.


MAAP13_Tam_13e_a_m_v3
Imagen 13c. Zoom A. Data: WorldView from Digital Globe (NextView).
MAAP13_Tam_13e_b_m_v3
Image 13d. Zoom B. Data: WorldView from Digital Globe (NextView).
MAAP13_Tam_13e_c_m_v2
Image 13e. Zoom C. Data: WorldView from Digital Globe (NextView).

Changing the Cacao Production Model in Peru

According to a recent interview with the President of United Cacao, the company is adopting the agro-industrial model. In other words, it is changing cacao production in Peru from the traditional small-scale model sited on long-deforested land for the agro-industrial model that requires large land parcels that are normally occupied by forests.

MAAP #9: Confirming Forest Clearing for Cacao in Tamshiyacu (Loreto, Peru) came from Primary Forest

Recall that in Image #2 we documented the rapid clearing of 2,126 hectares of primary forest between May 2013 and August 2014 for a new cacao project outside of the town of Tamshiyacu in the northern Peruvian Amazon (Department of Loreto).

However, the company that carried out the forest clearing (United Cacao, through its wholly-owned subsidiary in Peru, Cacao del Peru Norte) has responded “that this area had been used for farming since the late 1990s, and thus it was not primary forest…There was no high-conservation-value forest on that land (Cannon JC, 2015, mongabay.com).” In addition, the company’s website states that “The site was heavily logged of all tropical hardwoods in the 1980s.”

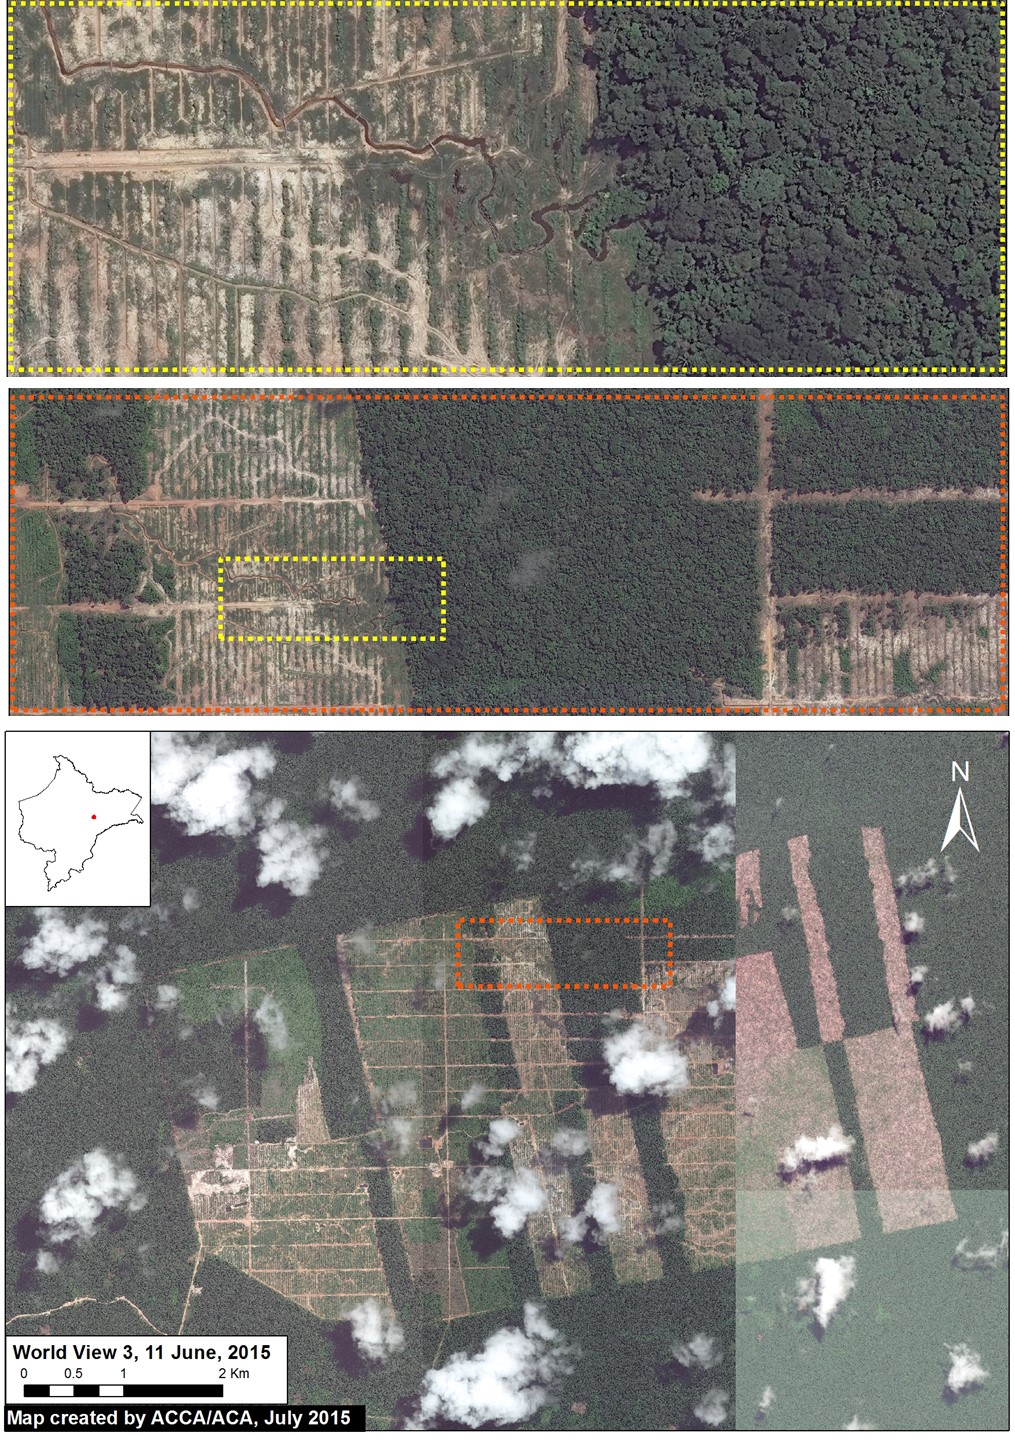
Here, in Image #9, we 1) publish new high-resolution (33 cm) satellite imagery that shows how the cacao project is expanding into dense, closed-canopy forest and 2) detail exactly how we determined that the vast majority of the clearing indeed came from primary forest. These findings are critically important because the company has major expansion plans.

Tam_MAAP_Mapa_9a_p_v4
Image of the Week 9a. Mosaic of very high-resolution (33 cm) images of the United Cacao plantation near Tamshiyacu, Peru, in June 2015. Colors indicate insets. Data: WorldView-3 from Digital Globe (NextView).

Key Results:

We obtained very high-resolution (33 cm) satellite imagery taken over the United Cacao plantation in June 2015 (see Image 9a). In this imagery, one can clearly see that the cacao project is embedded and expanding into dense, closed-canopy forest.

We analyzed a series of satellite (Landsat) images dating back to 1985 to determine that, prior to the arrival of United Cacao in 2013, the project area 1) had NOT been used for major farming activities, 2) was NOT heavily logged of all tropical hardwoods, and 3) was dominated (98%) by primary forest (see Image 9b). In fact, by analyzing spectral signatures in the Landsat images, we confirm that the area cleared by United Cacao in 2013 was dominated by primary forest (see Image 9c).

We show data from the Carnegie Airborne Observatory showing that the majority of the United Cacao project area had the highest possible value of carbon (over 150 tons per hectare) immediately prior to the forest clearing in 2013.

Finally, we present information indicating that  the current documented forest clearing of 2,126 hectares may soon double or triple.

Landsat Time-series

Tam_MAAP_Mapa_9b_p_v3
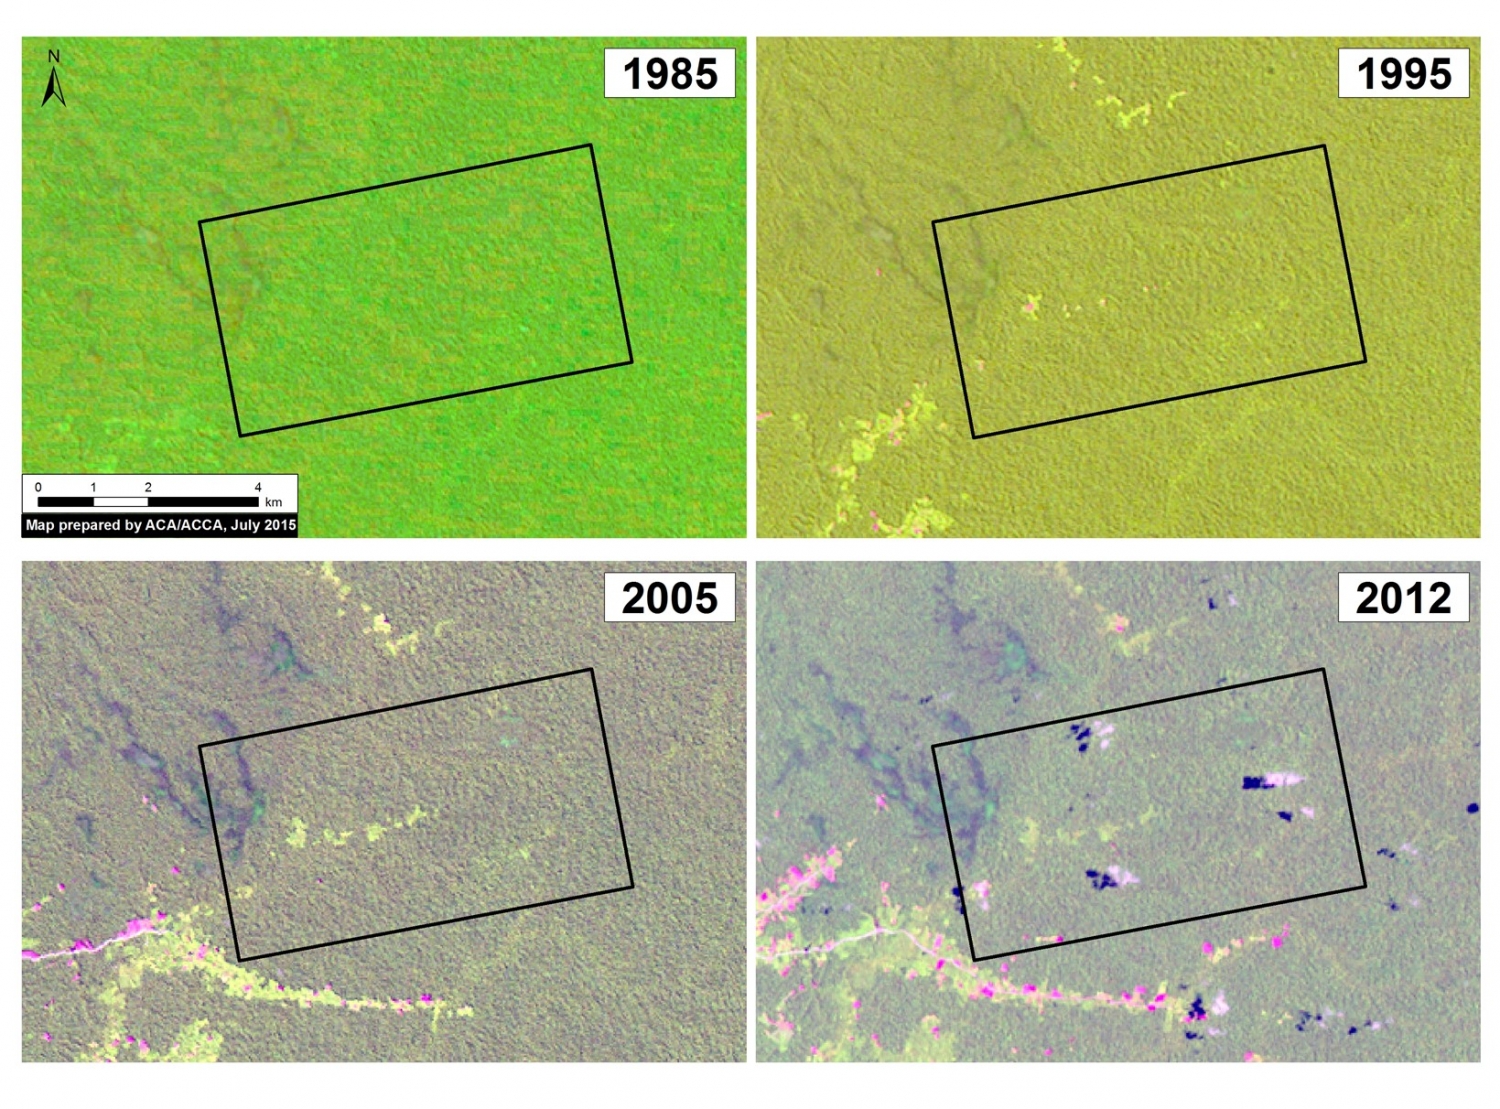
Image 9b. Landsat time-series (1985-2012) of the future United Cacao plantation area (indicated by black box) prior to arrival of the company. Data: USGS

Image 9b displays a series of Landsat images dating back to 1985 showing that, prior to the arrival of United Cacao, the area was dominated (nearly 98%) by primary forest and NOT used for major agriculture activities or heavily logged of all tropical hardwoods.

In these Landsat images, dark green indicates forest cover, light green indicates secondary vegetation, pink indicates exposed ground (and is therefore a key indicator of recent forest clearing), and the scattered white and black spots indicate clouds and their shade.

In 1985, the future cacao project area (indicated by black box) was completely covered by forest with no signs of clearing, major logging, or farming. By 1995, there were a few scattered areas of cleared forest in the center of the future project area. By 2005, there was a slight expansion of these cleared areas in the center of the future project area. By 2012, immediately before the start of forest clearing, the future project area appeared much the same: a few scattered areas of cleared forest in the center, but the vast majority of the area was primary forest.

 We defined primary forest as an area that from the earliest available image (in this case, from 1985) was characterized by dense closed-canopy coverage and experienced no major clearing events.

NDVI Analysis

Tam_MAAP_Mapa_9c_p_v3
Image 9c. NDVI analysis of the United Cacao plantation area prior to arrival of the company. Letters indicate significance (i.e., “a” values are significantly different than “b” values). Data: USGS.

To further investigate the issue of primary forest, we used the Landsat imagery to conduct an NDVI (Normalized Difference Vegetation Index) analysis. NDVI is a common index of photosynthetic activity, or “greenness,” based on the fact that different surfaces (primary forest, secondary forest, water, bare ground, etc…) reflect light (visible and near-infrared) differently.

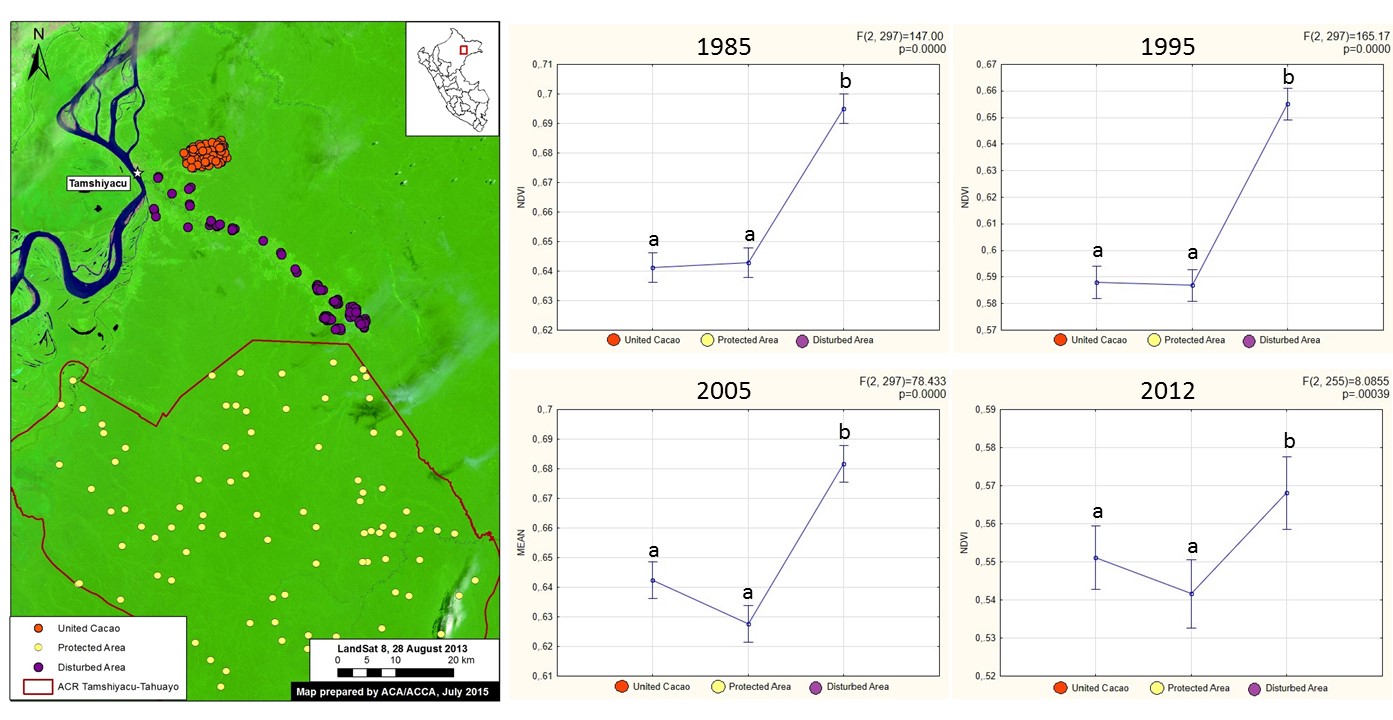
As seen in Image 9c, we obtained NDVI measurements across four different years (1985, 1995, 2005, and 2012) for 100 random points from each of three different areas: 1) area cleared by United Cacao in 2013 (orange dots), 2) nearby protected area that is proxy for primary forest (yellow dots), and 3) disturbed area along a major river that is proxy for secondary forest (purple dots).

For all four years, we found that the NDVI values for the area cleared by United Cacao in 2013 were similar to those of the nearby protected area (in fact, these values were nearly identical in 1985 and 1995), but significantly different than the disturbed area along the major river. In other words, the forest cleared by United Cacao was nearly identical to our proxy for primary forest and significantly different than our proxy for secondary forest. Thus, we conclude that United Cacao cleared over 2,000 hectares of primary forest in 2013.

Carbon Data Tells the Same Story

Tam_MAAP_Mapa_9d_v2
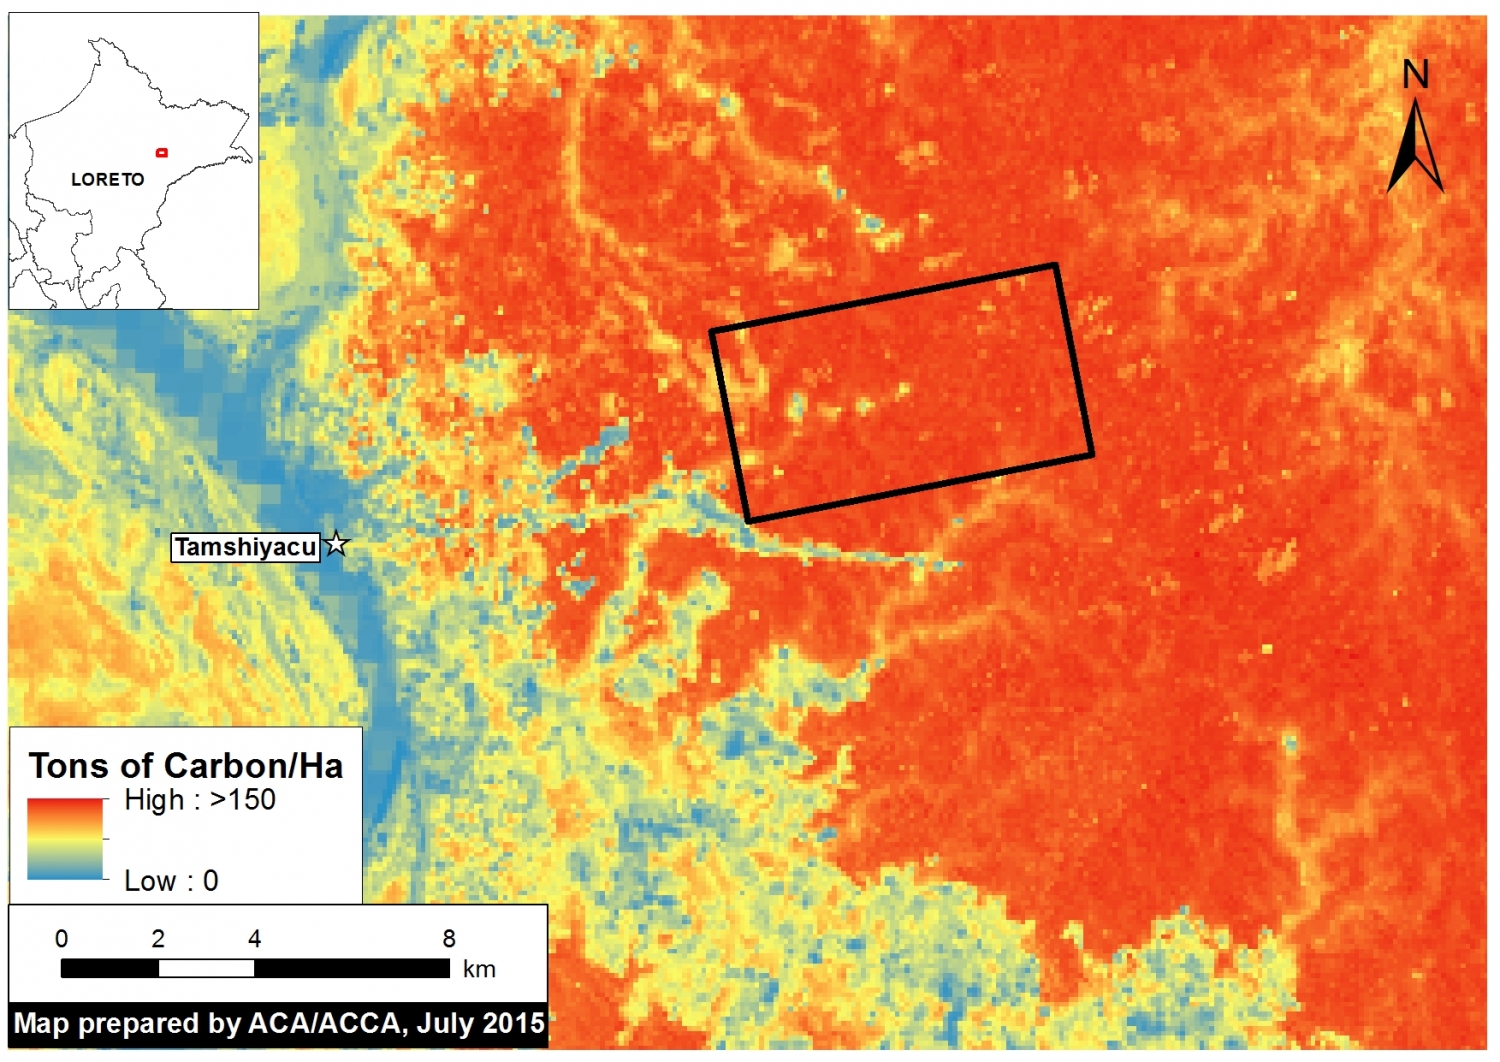
Image 9d. High-resolution carbon map of United Cacao plantation area (indicated by black box) prior to forest clearing. Data: Asner et al (2014) The high-resolution carbon geography of Peru. Berkeley, CA: Minuteman Press.

The Carnegie Airborne Observatory, led by Dr. Greg Asner, and the Peruvian Ministry of Environment, recently produced a high-resolution carbon geography of Peru. Interestingly, they mapped the carbon content of the United Cacao plantation area immediately prior to the forest clearing.

As seen in Image 9d, the vast majority of the United Cacao project area had the highest possible value of carbon (over 150 tons per hectare) immediately prior to the forest clearing in 2013. The only exceptions were the scattered previously cleared areas identified in Image 9b.

According to Asner, “The carbon levels were extremely high, indicating that they were large, intact forests that we normally picture when we think of primary Amazon forest.”

More Forest Clearing Coming…

Image8f
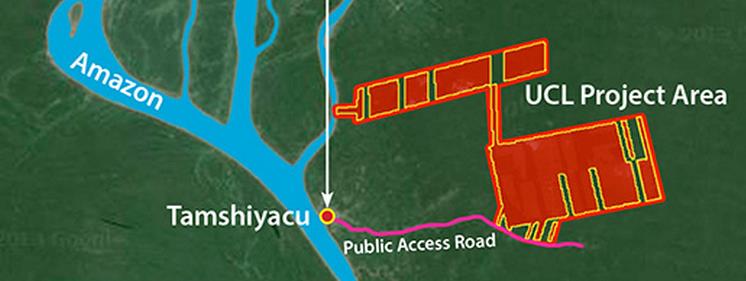
Image 9e. Project area map from the United Cacao website.

According to its website, United Cacao owns around 3,250 hectares near Tamshiyacu, and this total may soon increase to 4,000 hectares. In addition, the company has started an initiative with local farmers that may include an additional 3,250 hectares.

Thus, the current documented forest clearing of 2,126 hectares may soon double or triple.

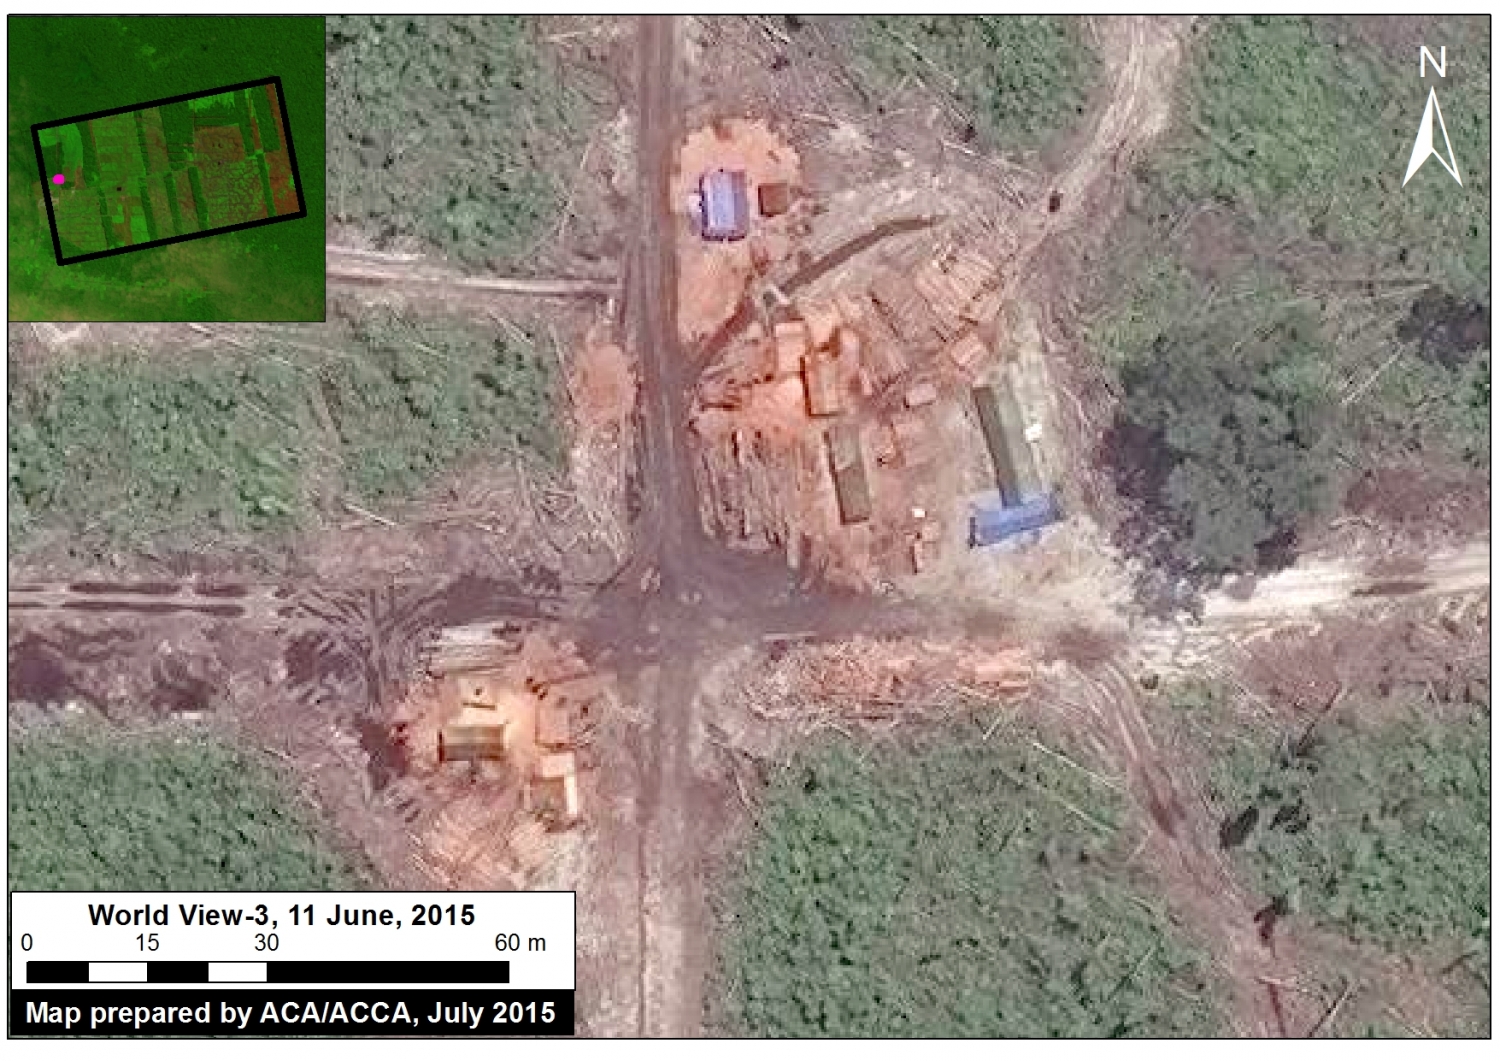
Finally, it is worth mentioning that we detected a sawmill within the project area. This discovery raises the question, Has the company obtained the necessary permits for this activity?

Tam_MAAP_Mapa_9e_v3
Image 9f. A sawmill detected within the cacao project area. Inset: The pink dot indicates location of sawmill within the project area. Data: WorldView-3 de Digital Globe (NextView).

Citation

Finer M, Novoa S (2015) Demonstrating that Forest Clearing for Cacao in Tamshiyacu (Loreto, Peru) came from Primary Forest. MAAP: Image #8. Link: https://www.maaproject.org/2015/06/image-9-cacao-tamshiyacu/
MAAP #2: Large-scale Forest Clearing for Cacao in Tamshiyacu, Peru

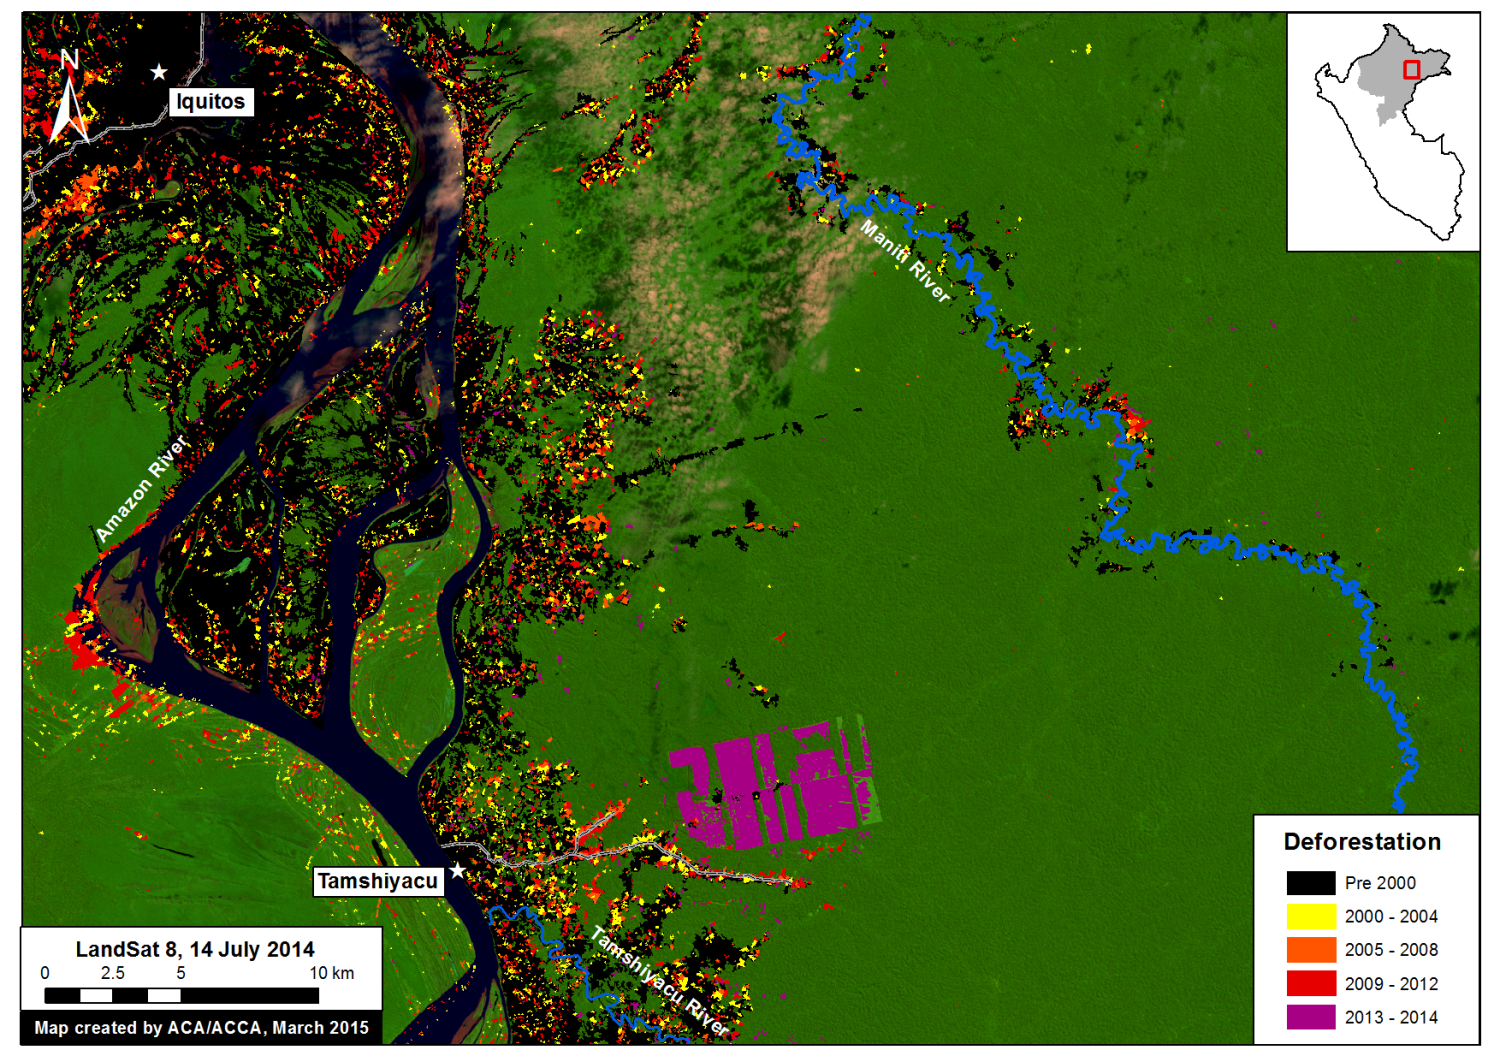
Image of the Week #2 shows the recent and rapid forest clearing for a new cacao project outside of the town of Tamshiyacu in the northern Peruvian Amazon (Department of Loreto). Specifically, we found that over 2,100 hectares (ha) were cleared between May 2013 and August 2014 in an area known as Fundo Tamshiyacu.

Tamshiyacu_MAAP_Mapa_3a_v6
Image of the Week 2a. Rapid clearing for large-scale agriculture in Tamshiyacu (Loreto, Peru). Key data sources: MINAM, Hansen/UMD/Google/USGS/NASA, USGS.

Map Description 

Background map is a Landsat 8 image (30 m resolution) from July 14, 2014. Green indicates forest cover. Note there is some cloud cover. Data is from USGS.

Black indicates areas that were cleared as of 2000 according to data from the Peruvian Environment Ministry (MINAM 2009). Yellow, orange, and red indicate areas that were cleared from 2000 to 2012 (each color covers a four year period) (Hansen MC et al. 2013 Science 342: 850–53; Data download).

Purple indicates areas that were cleared in 2013 and 2014 based on our analysis of Landsat imagery using CLASlite forest monitoring softwareUsing CLASlite, we found that 2,126 ha were cleared between May 2013 and August 2014 in the cacao project area known as Fundo Tamshiyacu. That is the equivalent to 2,900 soccer fields.

See this article published on mongabay.com for more information on the company that carried out the forest clearing (United Cacao, through its subsidiary in Peru, Cacao del Peru Norte). See this article, also published on mongabay, for more information on the legality of the forest clearing.

Landsat Time-series

Tamshiyacu_MAAP_Mapa_3b_v4
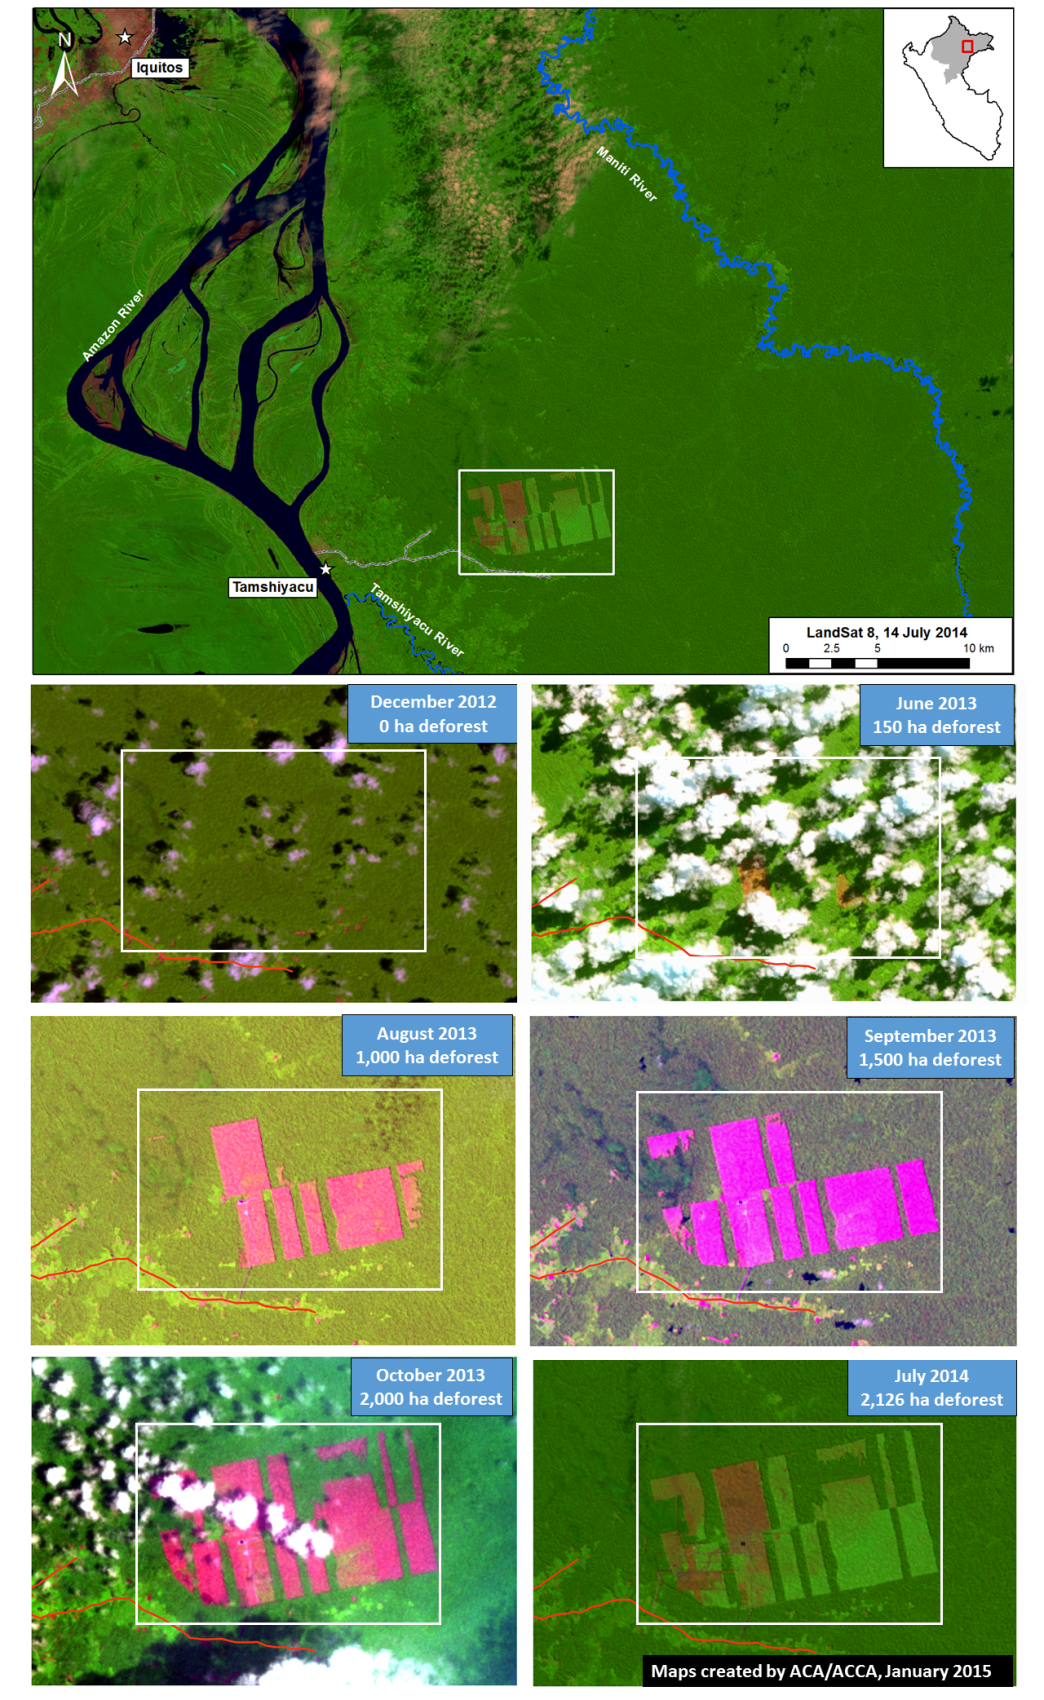
Image 2b. Results of Landsat time series analysis, December 2012 – August 2014. Key sources: USGS.

Image 2b is a series of Landsat images (30 meter resolution) of the recently cleared area that illustrates how the forest clearing unfolded.

In December 2012, the area was predominantly covered by closed-canopy forest.

In June 2013, although the image is cloudy, we detected the first signs of major forest clearing (about 150 ha).

In August 2013, a cloud-free image clearly revealed that forest clearing jumped to 1,000 ha.

Subsequent images in September and October 2013 revealed that forest clearing continued to 1,500 ha and 2,000 ha, respectively.

During the peak clearing between June and September 2013, the clearing rate was approximately 100 ha per week.

The forest clearing halted between November 2013 and June 2014, but in July 2014 we detected some new clearing. This additional clearing in 2014 raised the total cleared area to 2,126 ha.


Cutting Primary Forest 

Tamshiyacu_MAAP_Mapa_3c_v2
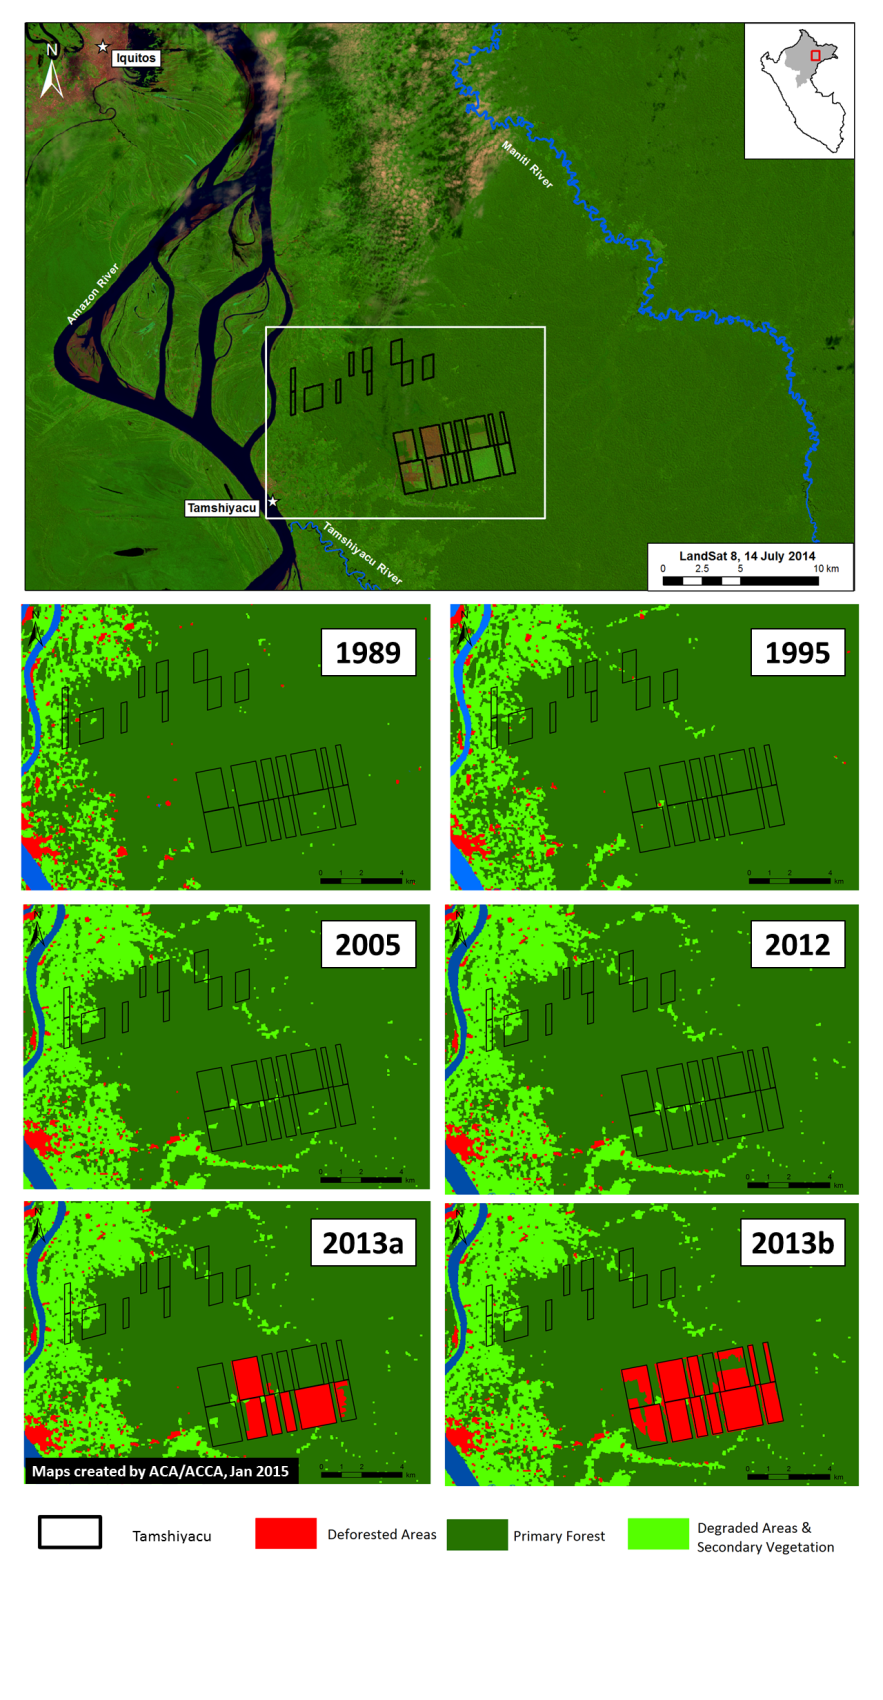
Image 2c. Tamshiyacu Landsat time series, 1989 – 2013. See text for definition of primary forest. Key sources: USGS.

Image 2c shows the results of our analysis of another series of Landsat images of the recently cleared area that go further back in time, until 1985. We conducted this analysis to determine whether the clearing described above came at the expense of primary forest.

We defined primary forest as an area that from the earliest available Landsat (in this case an image from 1985) was characterized by dense closed canopy coverage and having a similar spectral signature (NDVI) as areas in remote areas of the Amazon known to be undisturbed.

Using this methodology, we found that nearly 98% of the recently cleared area in Tamshiyacu was primary forest at the start clearing around May 2013.


Much More Forest Clearing to Come?

Tamshiyacu_MAAP_Mapa_3d_v1
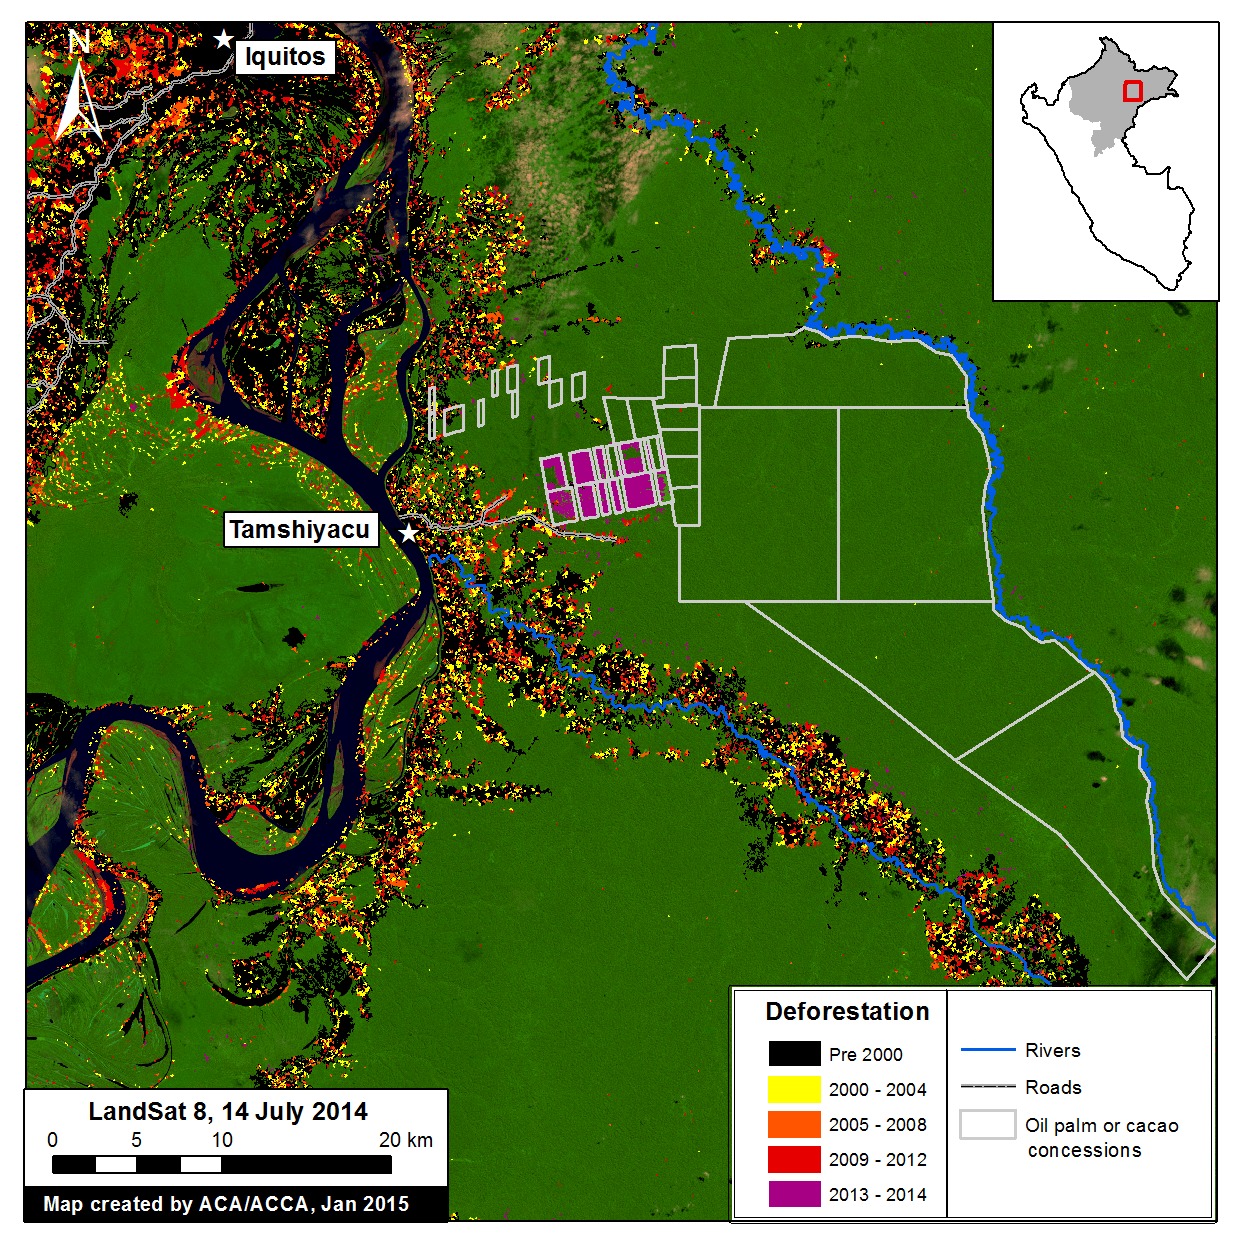
Image 2d. Rapid clearing for large-scale agriculture in Tamshiyacu (Loreto, Peru). Key sources: MINAM, Hansen/UMD/Google/USGS/NASA, GOREL, USGS.

Image 2d includes spatial information on proposed cacao and oil palm projects in the Tamshiyacu area (indicated by grey lines). This data was obtained from the Regional Government of Loreto (GOREL). The total area for proposed cacao and oil palm projects around Tamshiyacu is greater than 50,000 ha.


Tamshiyacu_MAAP_Mapa_3e_v1
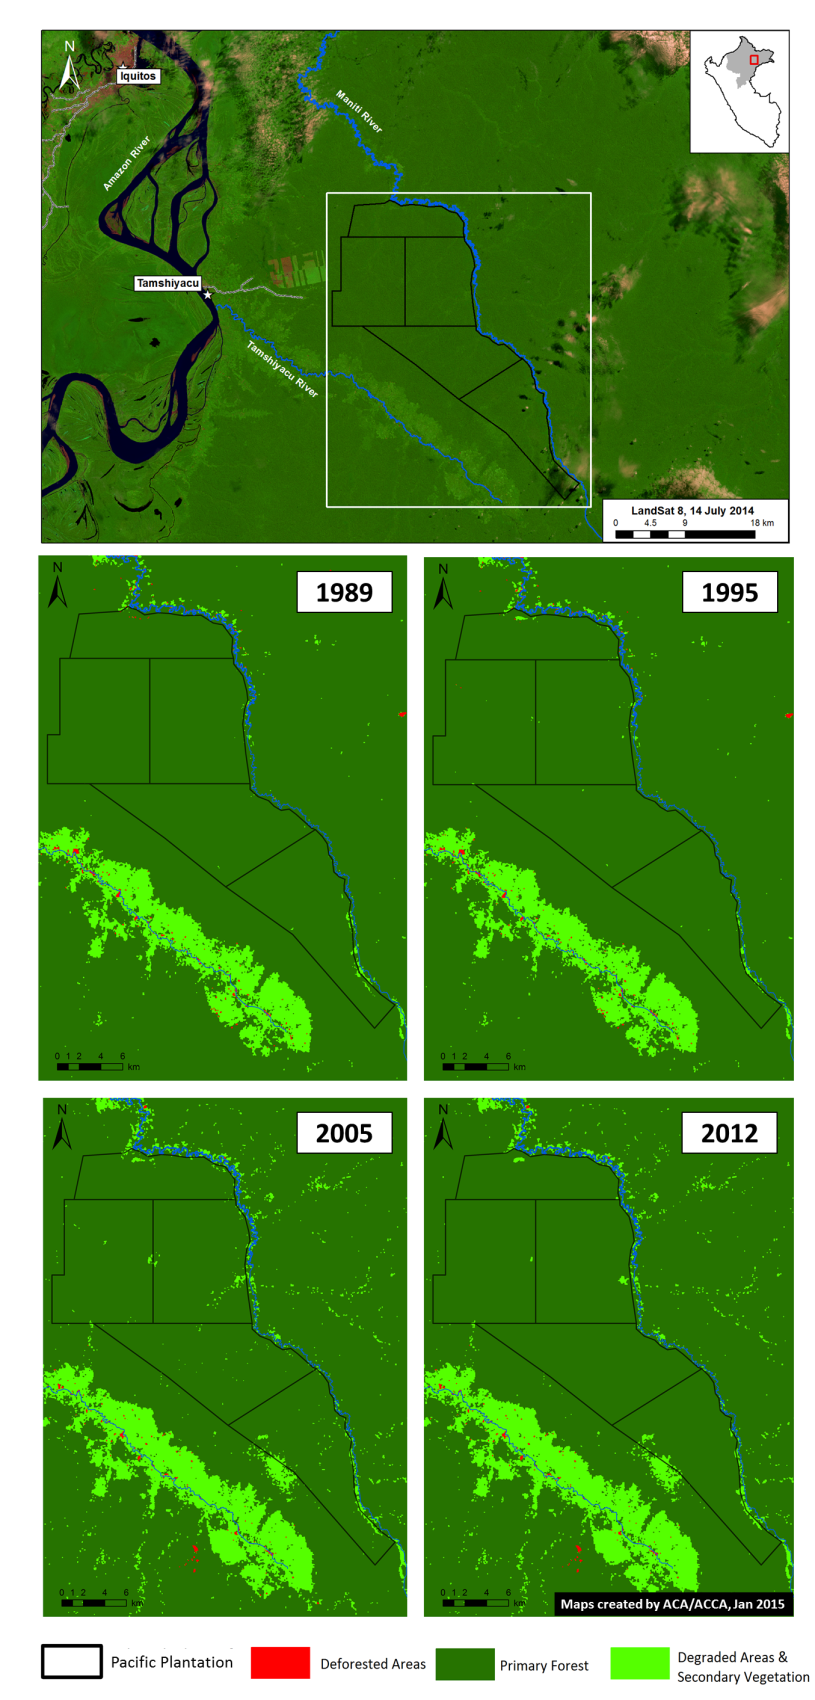
Image 2e. Landsat time series (1989 – 2012) for Pacific Plantation. See text for definition of primary forest. Key sources: USGS, GOREL.

We conducted a Landsat time-series analysis for the proposed oil palm projects noted above. We refer to these proposed projects as Pacific Plantation because this is how they are labelled in the information obtained from GOREL. As seen in Image 2e, our analysis indicates that 99.3% of the Pacific Plantation project area, or 44,685 ha, is primary forest.


Citation

Finer M, Novoa S (2015) Large-scale Forest Clearing for Cacao and Oil Palm in Tamshiyacu, Peru. MAAP: Image #2. Link: https://www.maaproject.org/2015/03/image-3-rapid-clearing-for-large-scale-agriculture-in-tamshiyacu-_/