MAAP Interactive: Deforestation Drivers in the Andean Amazon

Since its launch in April 2015, MAAP has published over 70 reports related to deforestation (and natural forest loss) in the Andean Amazon. We have thus far focused on Peru, with several reports in Colombia and Brazil as well.

These reports are meant to be case studies of the most important and urgent deforestation events. We often use forest loss alerts (known as GLAD) to guide us, and satellite imagery (from Planet and DigitalGlobe) to identify the deforestation driver.

Here we present an interactive map highlighting the drivers identified in all published MAAP reports. These drivers include gold mining, agriculture (e.g. oil palm and cacao), cattle pasture, roads, and dams (see icon legend below map). We also include natural causes such as floods and blowdowns (fire included under agriculture since most human caused). Furthermore, we highlight deforestation events within protected areas. Note that you can filter by driver by checking boxes of interest.

We hope the result is one of the most detailed and up-todate resources on patterns and drivers of deforestation in the Andean Amazon. Over the coming year we will continue to focus on Peru and Colombia, and begin to include Ecuador and Bolivia as well.

To view the interactive map, please visit:

MAAP Interactive: Deforestation Drivers in the Andean Amazon
https://www.maaproject.org/interactive/

For more information on patterns and drivers of deforestation in the Peruvian Amazon, see our latest Synthesis report 

MAAP 59: Power of “Small Satellites” from Planet

Image 59a. Source: Planet

The company Planet is pioneering the use of high-resolution “small satellites” (Image 59a). They are a fraction of the size and cost of traditional satellites, making it possible to produce and launch many as a large fleet. Indeed, Planet now operates 149 small satellites, known as Doves, the largest fleet in history. The Doves capture color imagery at 3-5 meter resolution, and will line up (like a string of pearls) to cover everywhere on Earth’s land area every day.

Over the past year, MAAP* has demonstrated the power of Planet imagery to monitor deforestation and degradation in near real-time in the Amazon. A consistent flow of new, high-resolution imagery is needed for this type of work, making Planet’s fleet model ideal. Below, we provide a recap of key MAAP findings based on Planet imagery, for a diverse set of cases including gold mining, agriculture deforestation, logging roads, wildfire, blowdowns, landslides, and floods.**

*MAAP has been fortunate to have access to Planet imagery via the Ambassador program.
**Note: In the images below, the red dot () indicates the same location across time between panels.

Illegal Gold Mining

Image 59b. Data: Planet, SERNANP

We used Planet imagery to closely track the recent illegal gold mining invasion of Tambopata National Reserve, a mega-diverse protected area in the southern Peruvian Amazon. Image 59b is a GIF showing the full invasion: from the initial invasion in January 2016, to subsequent deforestation advances in July and November 2016, and the most recent image in March 2017. The total deforestation from the invasion is over 1,235 acres. These images were an important resource for authorities, civil society, and the media responding to the situation.

Illegal Agriculture Deforestation
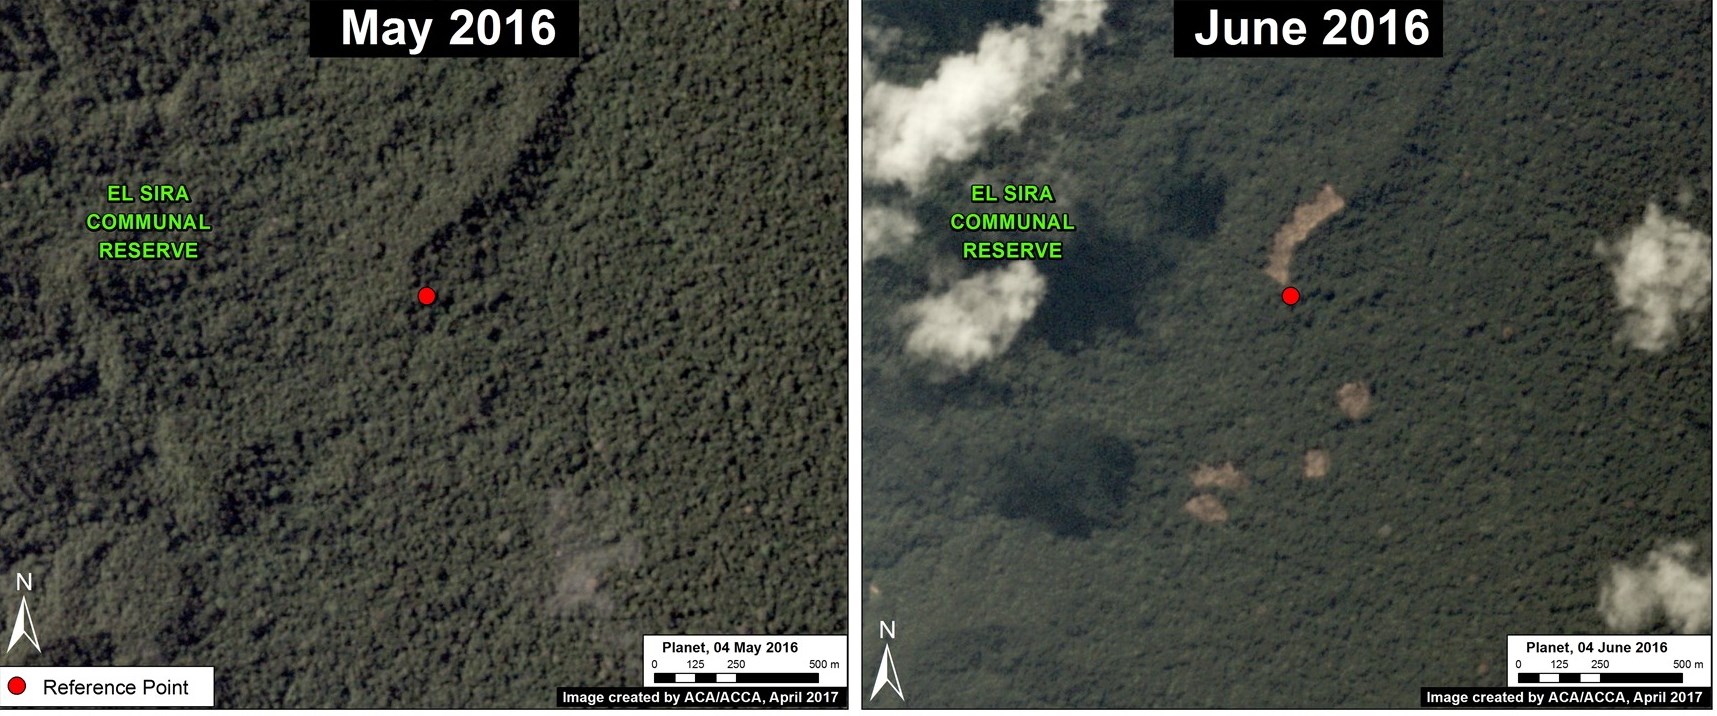
Image 59c. Data: Planet, SERNANP

We used Planet imagery to document numerous cases of small-scale deforestation for illegal agricultural practices. These examples are important because, cumulatively, small-scale deforestation represents the vast majority (80%) of forest loss events in the Peruvian Amazon (see MAAP Synthesis #2). Image 59c shows the rapid appearance of several new agricultural plots between May (left panel) and June (right panel) 2016 within an important natural protected area in the central Peruvian Amazon, El Sira Communal Reserve.

Logging Roads
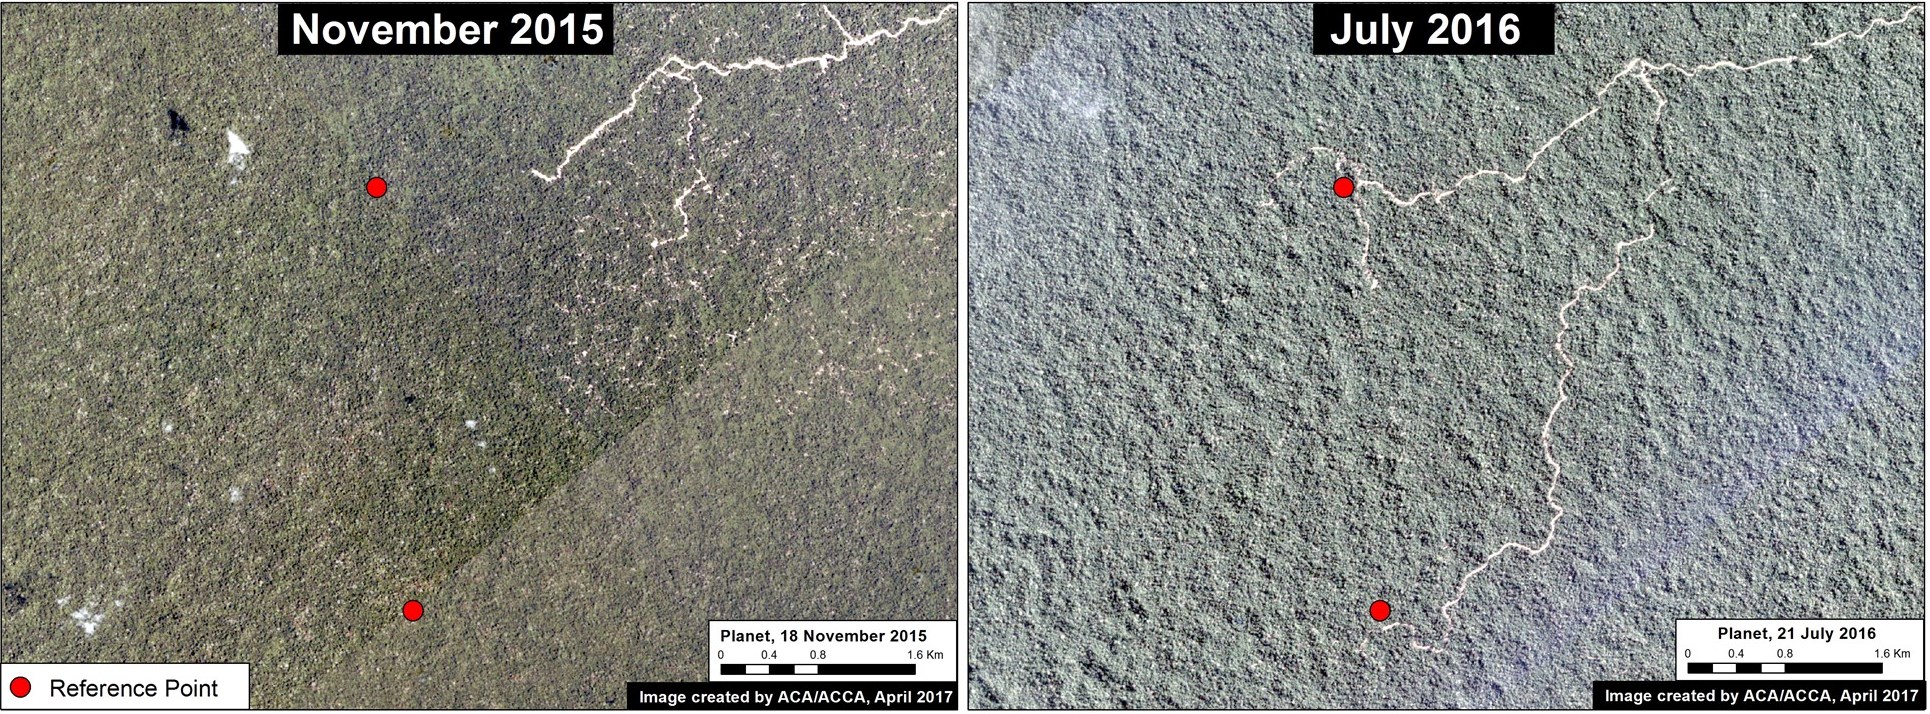
Image 59d. Data: Planet

We used Planet imagery to show the rapid construction of logging roads. For example, Image 59d shows the construction of a logging road in the buffer zone of an important national park in the central Peruvian Amazon (Cordillera Azul) between November 2015 (left panel) and July 2016 (right panel).

Wildfire

Image 59e. Data: Planet

Planet imagery was also an important resource to monitor the intense wildfires in Peru last year. Image 59e shows forest loss from an escaped agricultural fire in the northern Peruvian Amazon between May (left panel) and October (right panel) 2016. Note the imagery even caught the smoke from the fires in September (middle panel).

Blowdowns
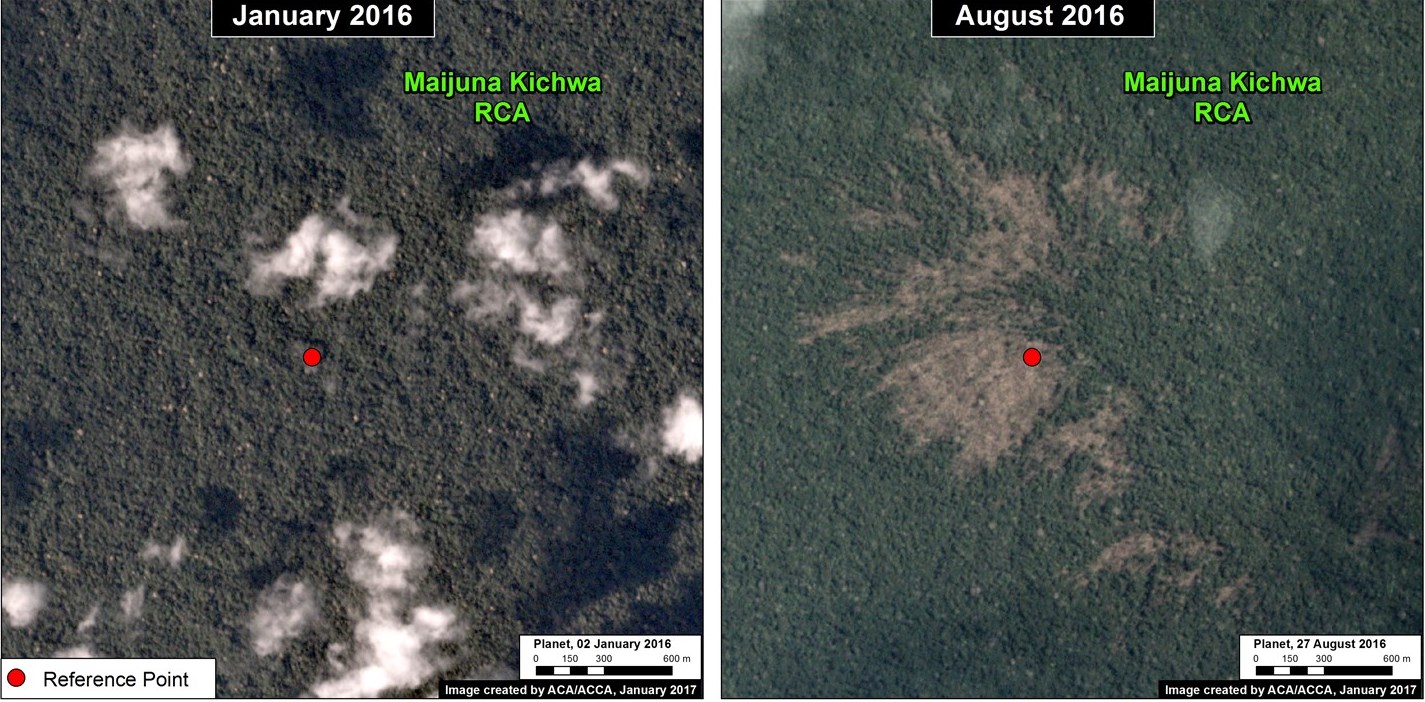
Image 59f. Data: Planet

We used Planet to help document a little-known, but important, type of natural forest loss in the Peruvian Amazon: blowdown due to strong winds from localized storms known as “hurricane winds.” Image 59f shows a high-resolution view of a recent major blowdown event between January (left panel) and August (right panel) 2016 in the northern Peruvian Amazon.

Landslides
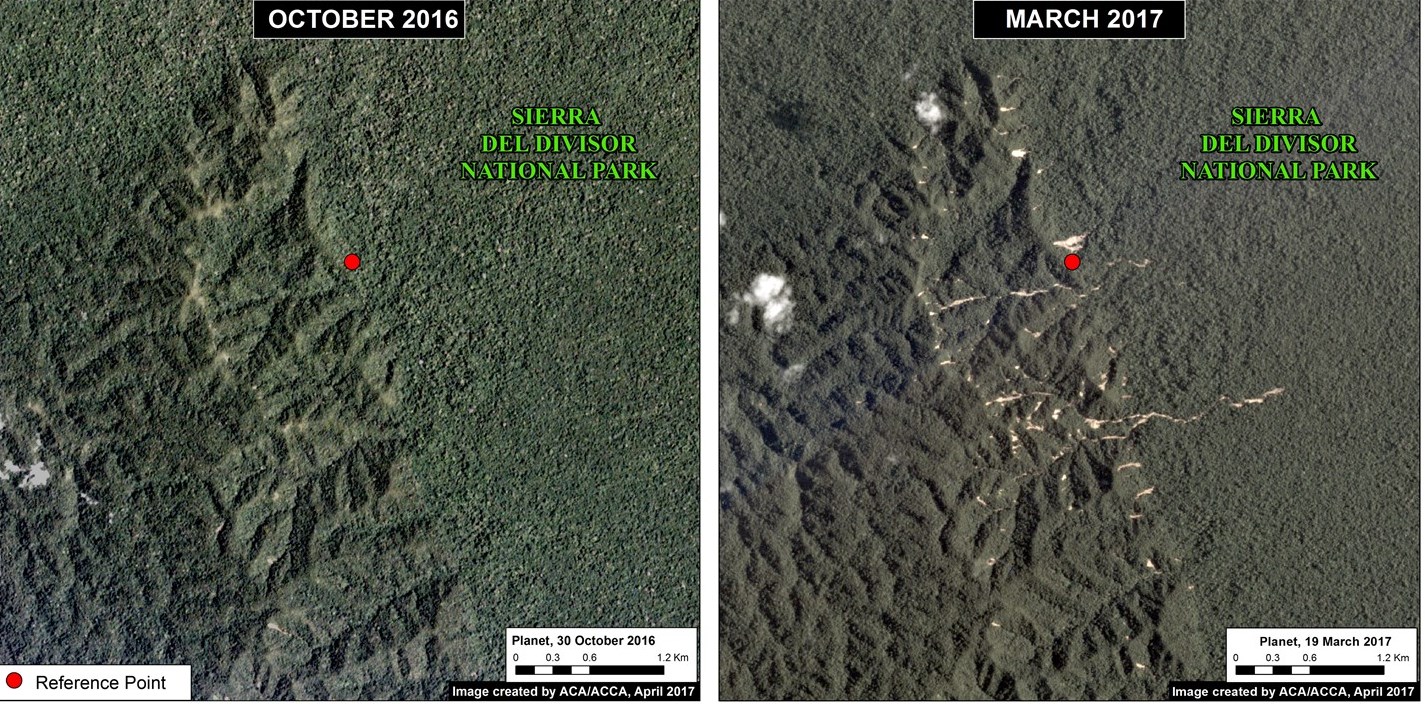
Image 59g. Data: Planet

Planet imagery recently revealed an interesting natural phenomenon: a major landslide within a remote, rugged section of Peru’s newest national park, Sierra del Divisor. Image 59g shows the area between October 2016 (left panel) and March 2017 (right panel).

Floods
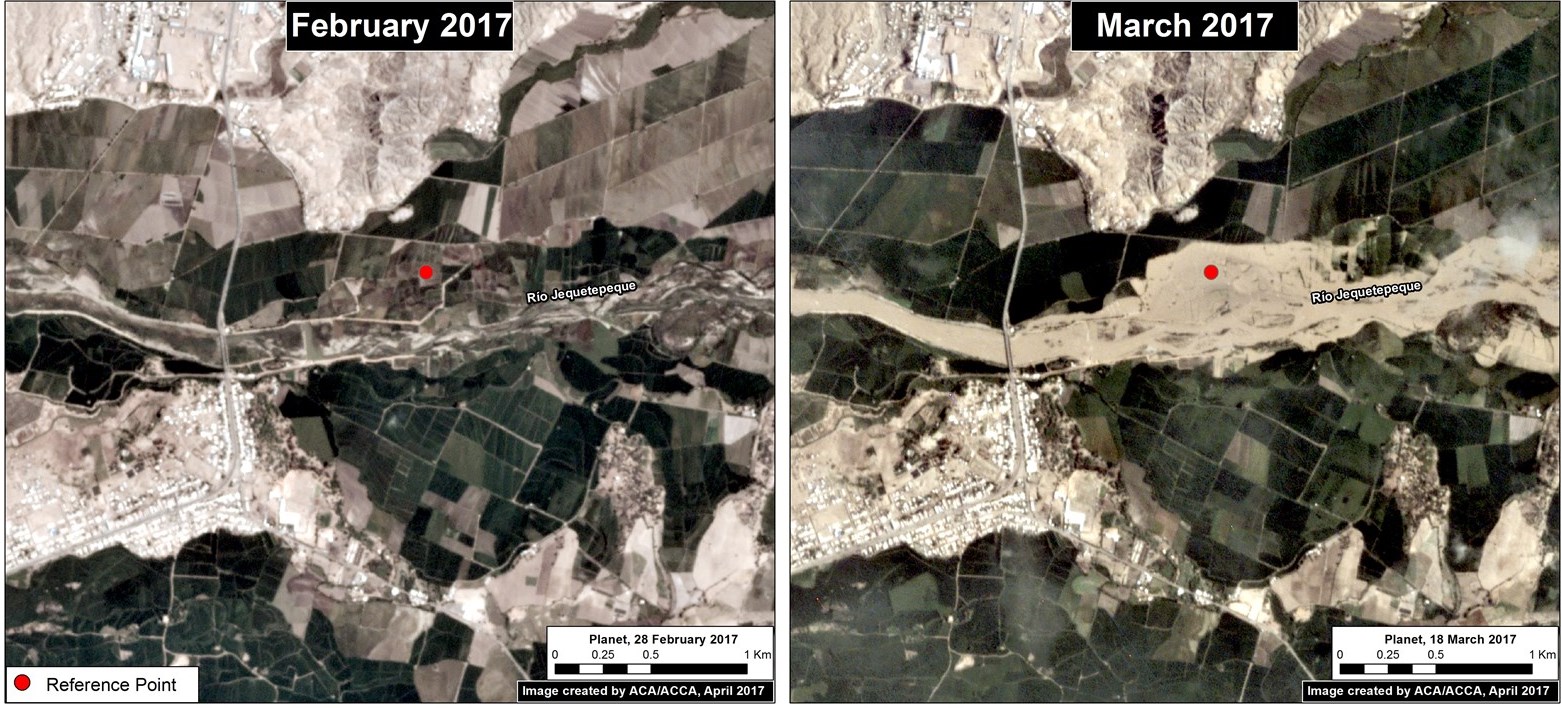
Image 59h. Data: Planet

Finally, Planet imagery played a key role in monitoring the impacts of the recent deadly floods that hit the northern Peruvian coast. Image 59h shows the rapid flooding of agricultural plots along a river in northern Peru between February (left panel) and March (right panel) 2017.

References

Planet Team (2017). Planet Application Program Interface: In Space for Life on Earth. San Francisco, CA. https://api.planet.com

Citation

Finer M, Novoa S, Mascaro J (2017) Power of “Small Satellites” from Planet. MAAP: 59.

MAAP #58: Link between Peru’s Flooding and Warm Coastal Waters

In previous articles MAAP #56 and MAAP #57, we presented a series of striking satellite images of the recent deadly floods in northern Peru. Satellites provide additional types of data critical to better understanding events such as extreme flooding. Here, we present two more types of satellite data related to the flooding: ocean water temperature and precipitation.


Warming Coastal Waters

Image 58a. Data: NOAA

Satellite data from NOAA (the U.S. National Oceanic and Atmospheric Administration) clearly shows the warming of the northern Peruvian coastal waters immediately before and during the heavy rains and flooding (1, 2). Specifically, Image 58a shows the sudden warming in January, followed by intensifying warming in February and March (white inset box indicates primary flooding zone). Peruvian experts have referred to this phenomenon as “coastal El Niño”.

Heavy Rains

Image 58b. Data: Senamhi, GPM/NASA

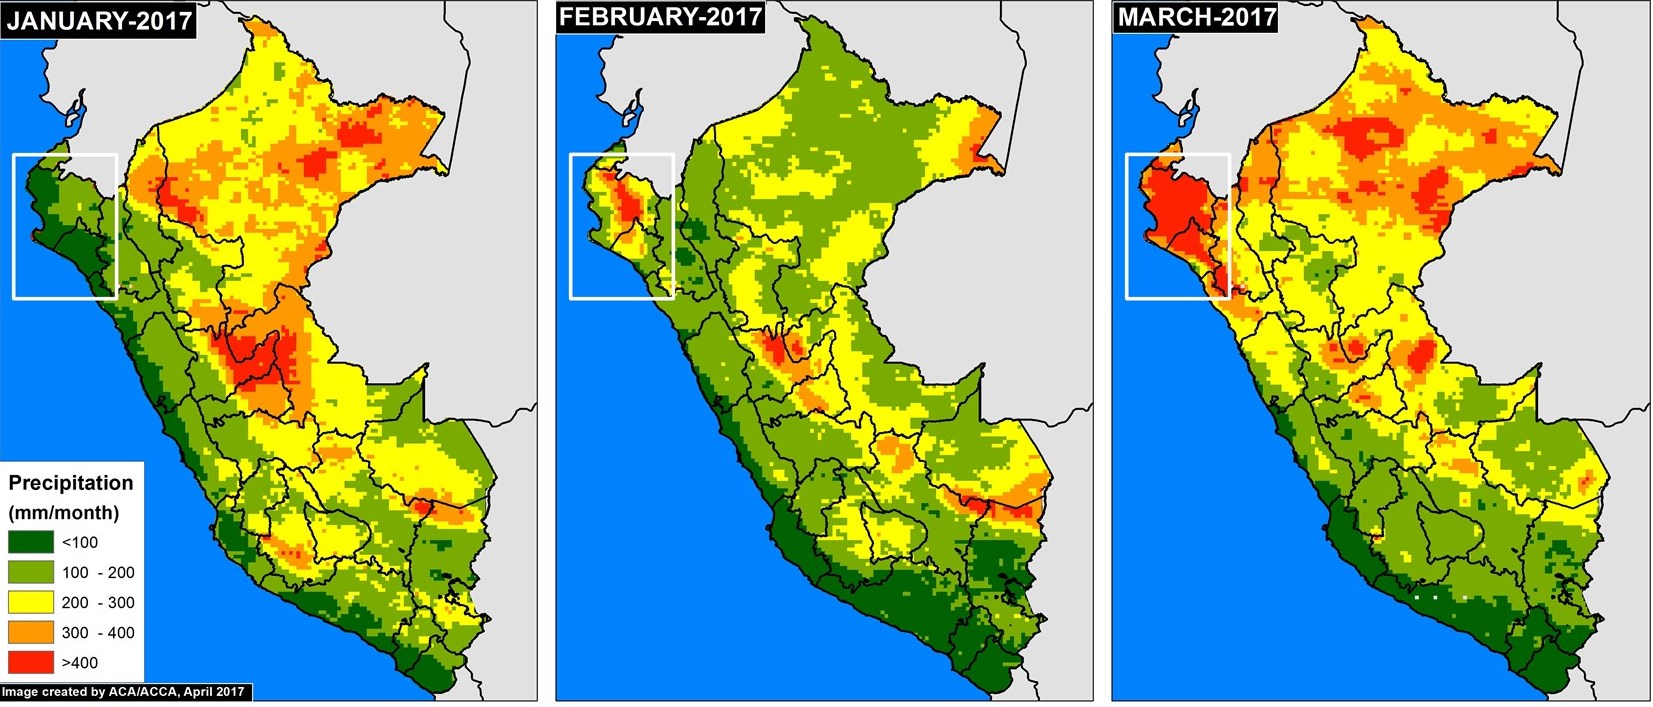
Image 58b shows the resulting accumulated monthly precipitation totals (white inset box indicates primary flooding zone). In January, as expected, the dry northern coast had much lower precipitation than the Amazon region to the east. In February and March, however, the northern coast experienced abnormally intense rainfall, even more than many parts of the Amazon.

Floods linked to Climate Change?

Questions have emerged regarding the link between the deadly Peruvian floods and climate change (3). As seen in the images above, the sudden appearance of warm coastal waters coincides with intense rains in the primary flooding zone. Additional analysis is needed to better understand the link between the Peruvian floods and climate change, but such events are consistent with predictions related to heavy rains fueled by ocean warming due to climate change (3). Climate change could also increase the frequency or intensity of El Niño events (4).

References

  1. Villa, L. (27 de marzo 2017). Radar Sentinel-1: Evaluación Preliminar del Impacto del Niño Costero en Perú (Parte II). [Mensaje en un blog]. Recuperado de: http://luciovilla.blogspot.com/2017/03/radar-sentinel-1-evaluacion-preliminar_27.html
  2. Villa, L. (17 de marzo 2017). Radar Sentinel-1: Evaluación Preliminar del Impacto del Niño Costero en Perú (Parte I). [Mensaje en un blog]. Recuperado de: http://luciovilla.blogspot.com/2017/03/radar-sentinel-1-evaluacion-preliminar.html
  3. Berwyn B (2017) Peru’s Floods Follow Climate Change’s Deadly Extreme Weather Trend. Inside Climate News. Link: https://insideclimatenews.org/news/24032017/peru-floods-extreme-weather-climate-global-warming-el-nino
  4. Fraser B (2017) Coastal El Niño catches Peru by surprise. EcoAmericas March 2017.

Citation

Finer M, Novoa S, Gacke S (2017) Link between Peru’s Flooding and Warm Coastal Waters. MAAP: 58.

MAAP: What satellites show us about Peru’s flooding

Image 57. Data: ESRI, INEI, MINAM. Click to enlarge.

Satellites provide unique information that is critical to understanding events on Earth, including the recent deadly flooding in northern Peru.

In the previous MAAP #56, we showed a series of satellite images of the deadly floods that recently hit northern Peru.

Here, we highlight how satellites can show us the extent, indicators, impacts, and causes of the flooding.

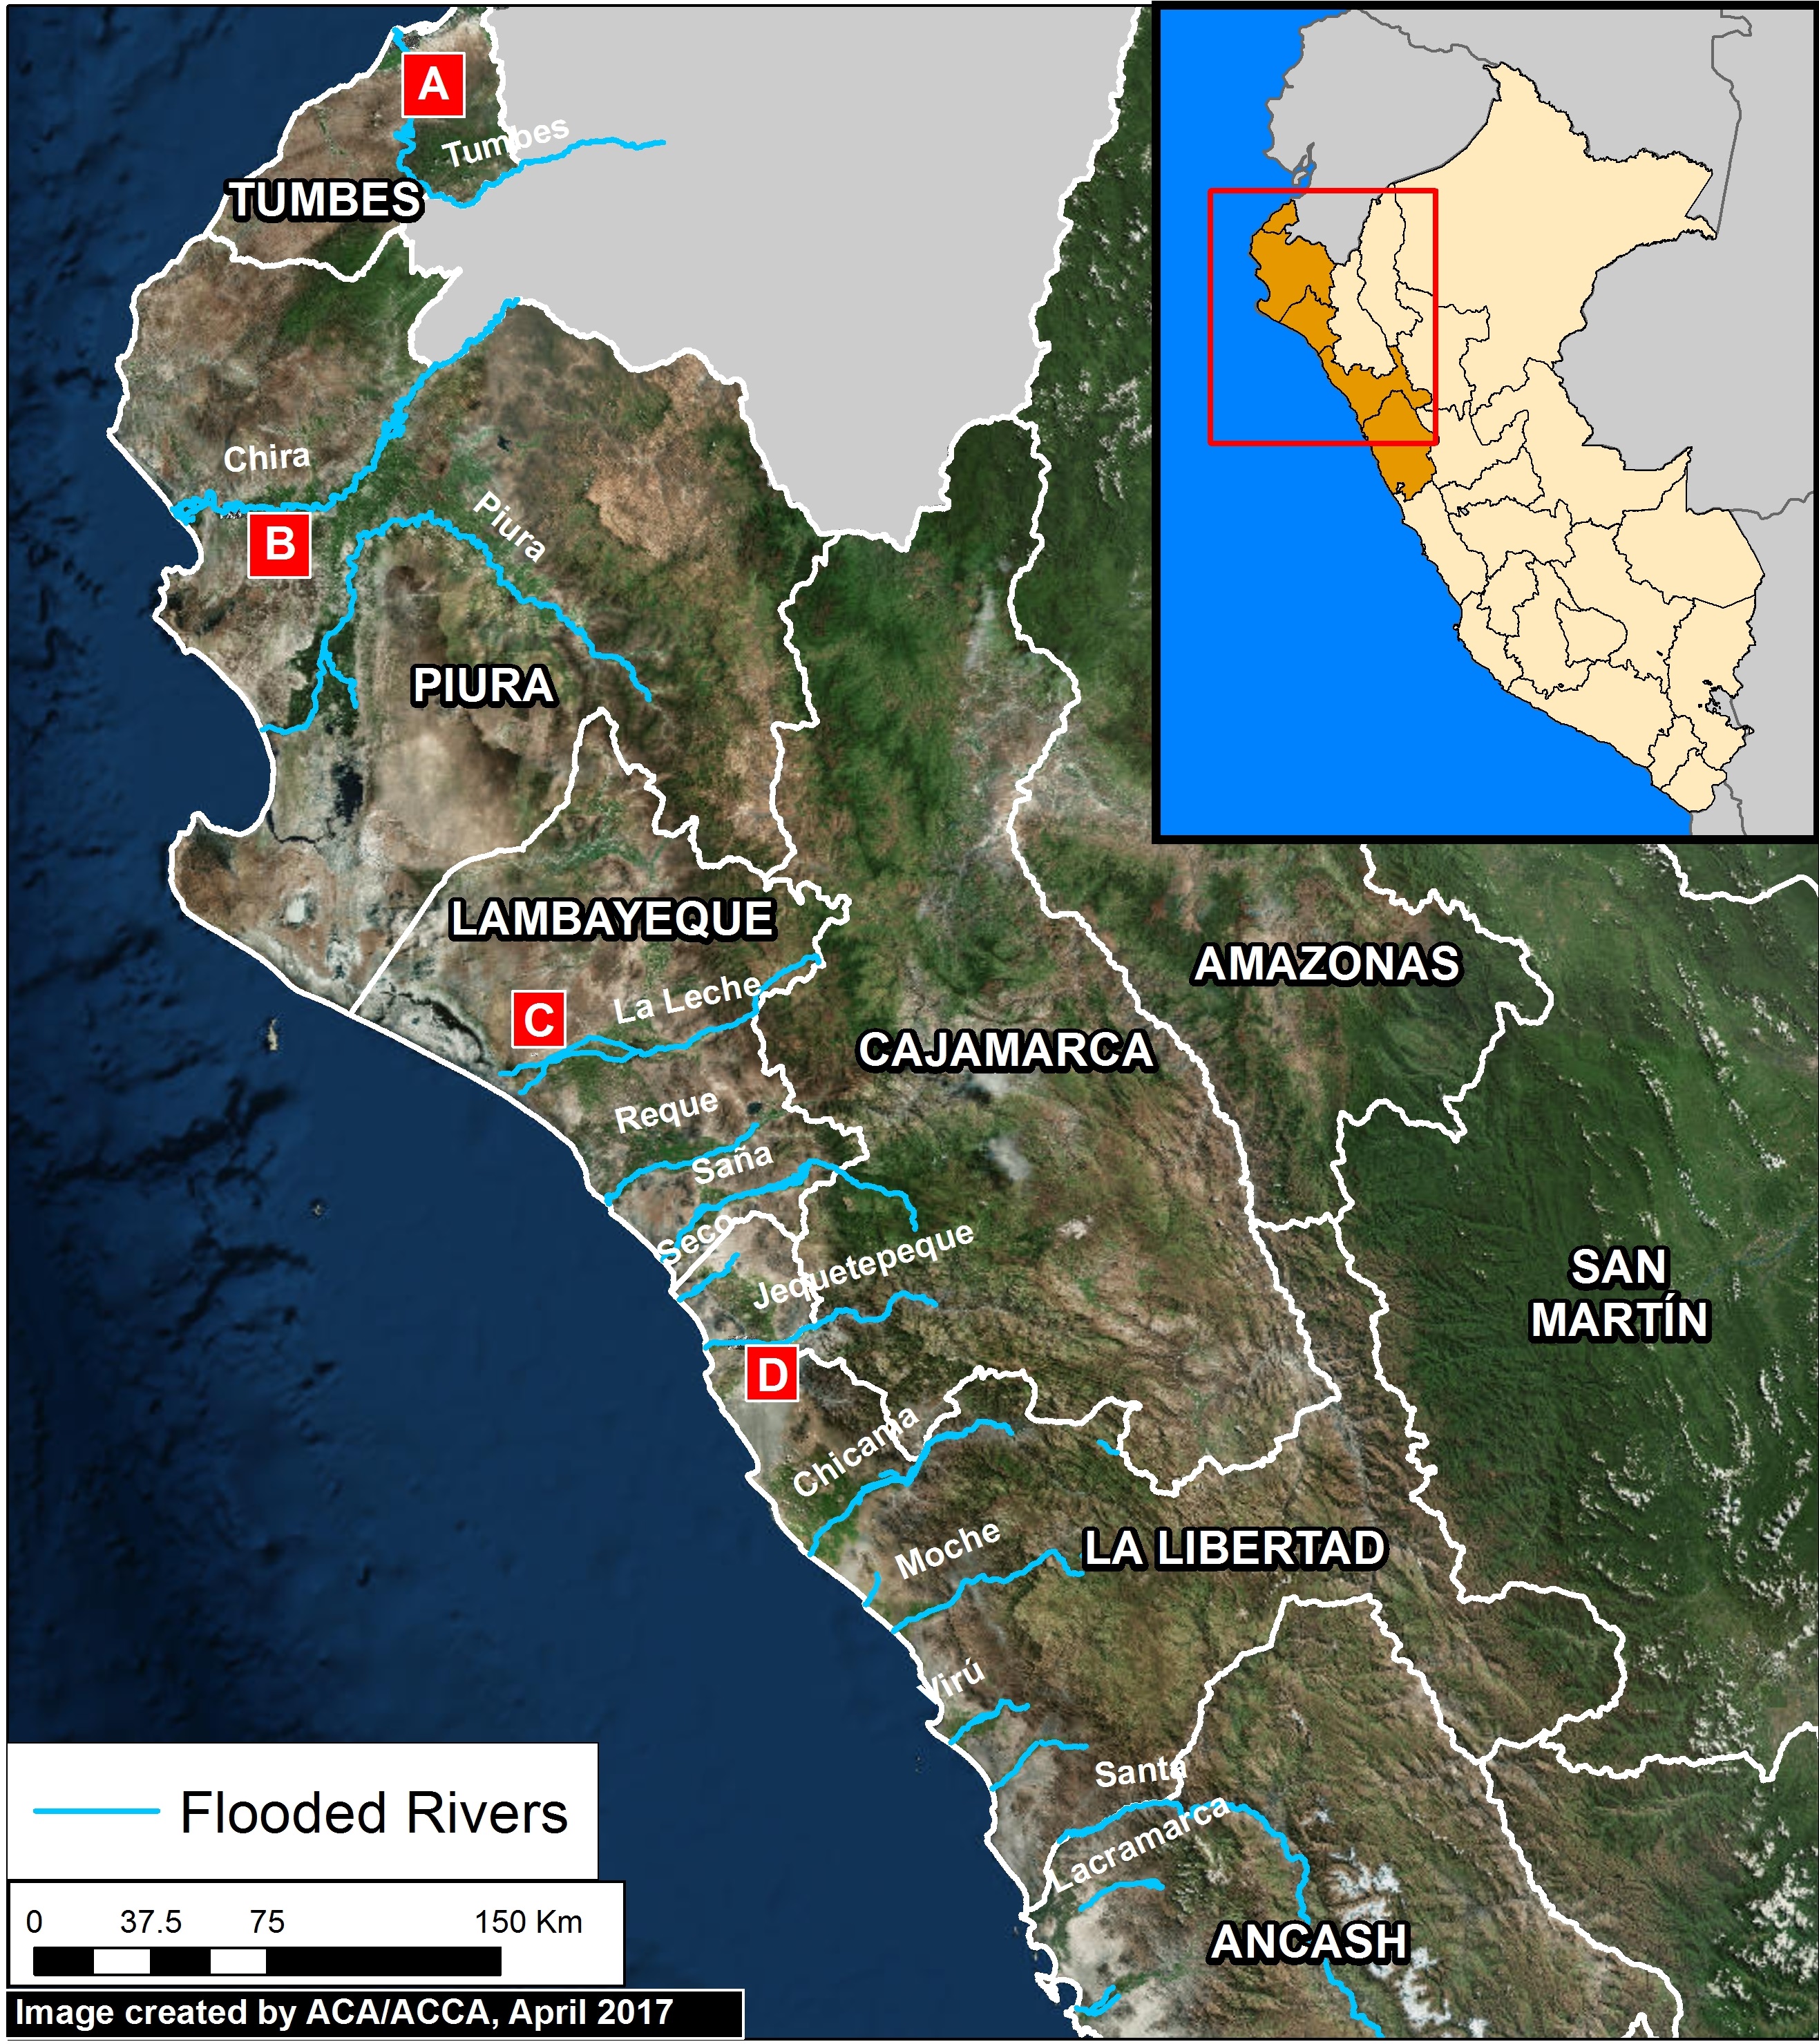
Image A (see left) shows the general extent of the flooding in northern Peru. Analyzing satellite imagery, we identified 13 major rivers that flooded, indicated in blue.


Indicators of Flooding

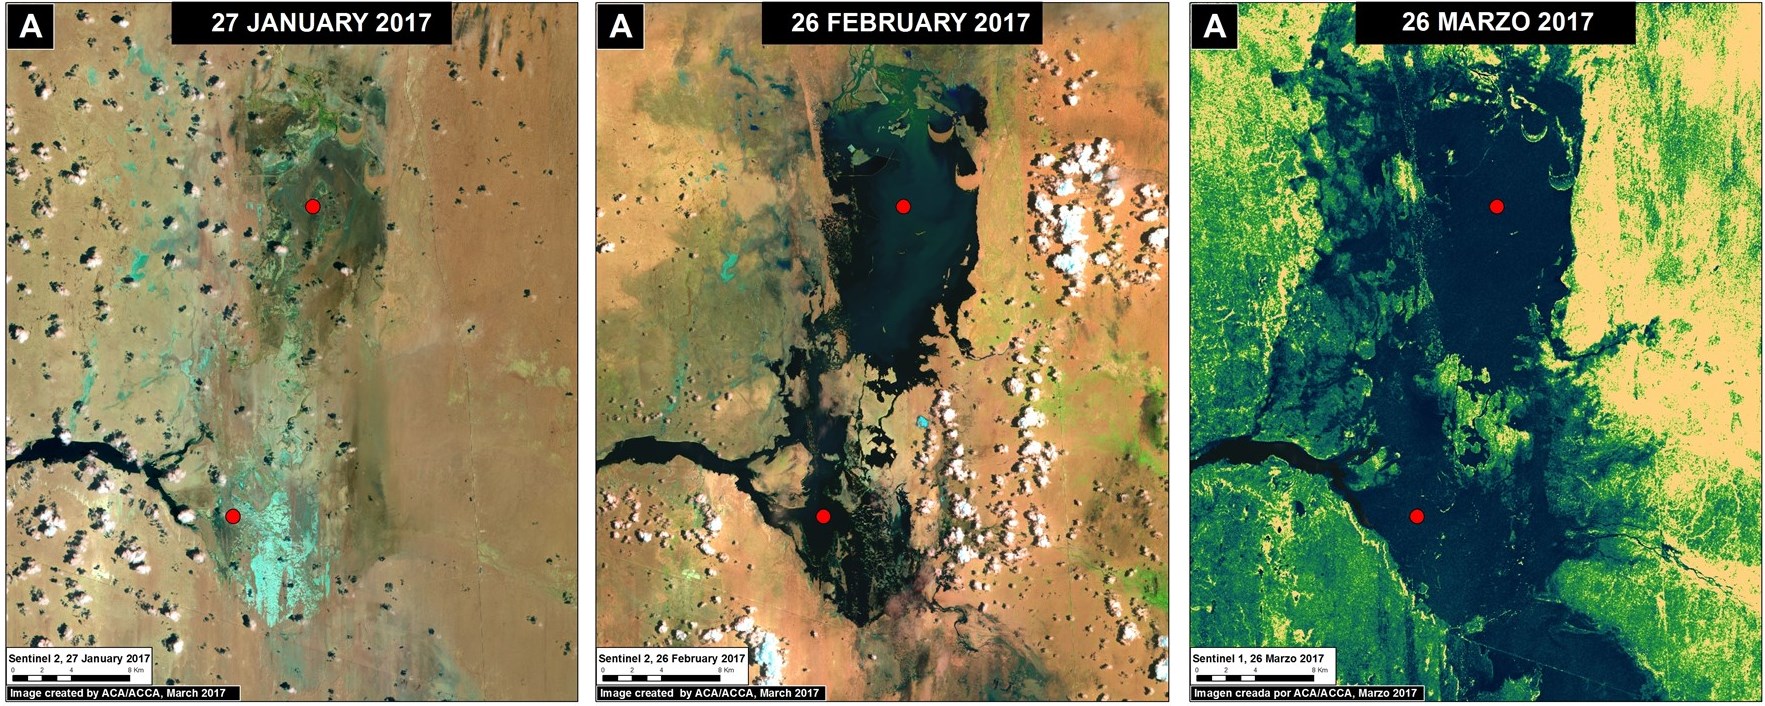
An indicator of intense rains and flooding in northern Peru is the formation of the temporary lagoons La Niña and La Niña Sur, in the region of Piura. Image B shows the rapid formation of the lagoons between late January (left panel) and March 2017 (right panel).

Image B. Data: ESA

Impact of Flooding

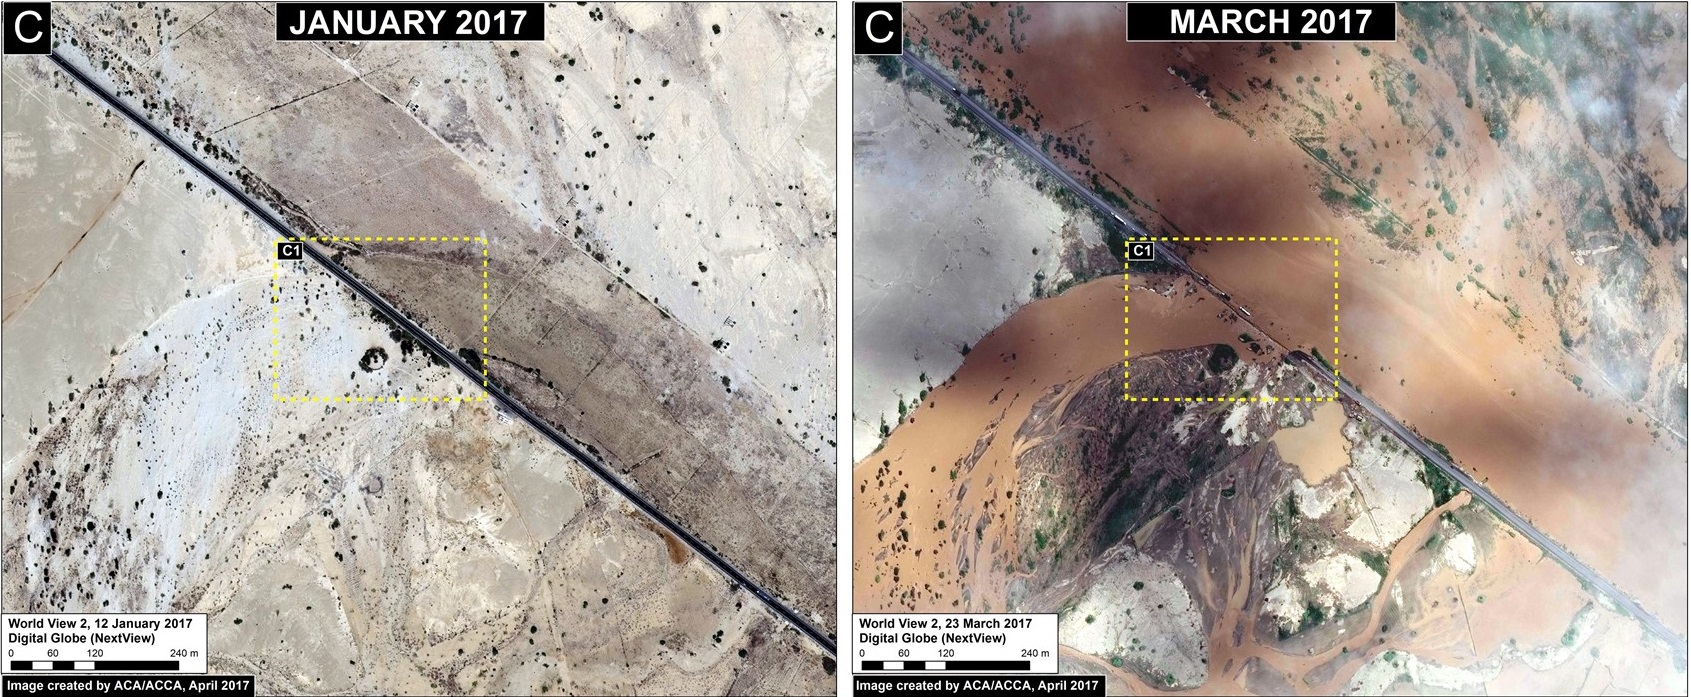
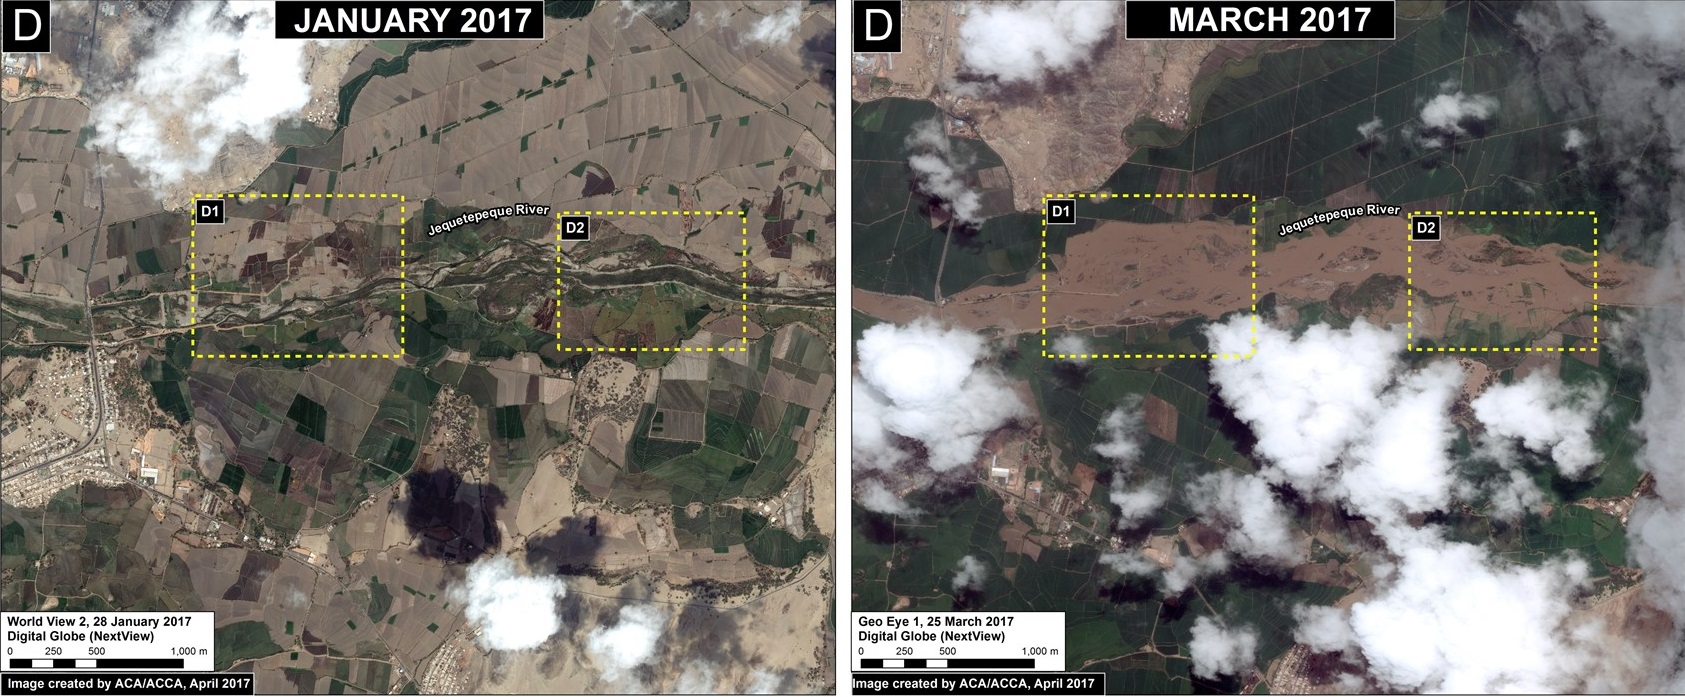
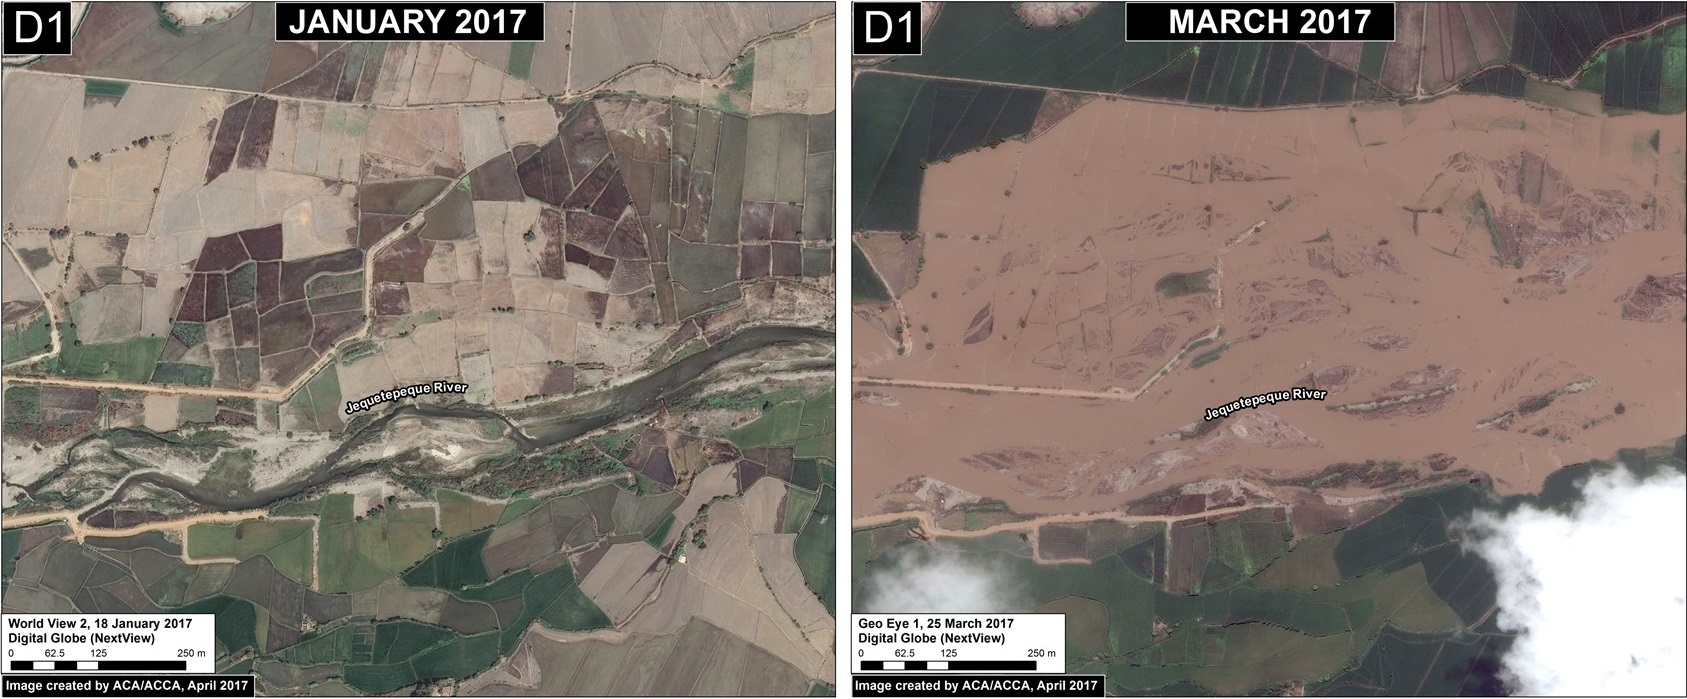
The centerpiece of our analysis is a series of high resolution satellite images of the flooding. Images C and D show, in striking detail, some of the local impacts to the Panamerican Highway and croplands between January (left panel) and March (right panel) 2017.

Image C. Data: DigitalGlobe (Nextview)
Inset C1. Data: DigitalGlobe (Nextview)
Image D. Data: DigitalGlobe (Nextview)
Inset D1. Data: DigitalGlobe (Nextview)

Causes of Flooding

Satellites also provide data about the link between ocean water temperature and the heavy rains causing the floods. Image E shows the warming of the northern Peruvian coastal waters immediately before and during the heavy rains and flooding. Peruvian experts have referred to this phenomenon as “coastal El Niño”.

Image E. Data: NOAA


Image F shows  the resulting accumulated monthly precipitation totals (white inset box indicates primary flooding zone). In January, as expected, the dry northern coast had much lower precipitation than the Amazon region to the east. In February and March, however, the northern coast experienced abnormally intense rainfall, even more than many parts of the Amazon.

Image F. Data: Senamhi, GPM/NASA

Citation

Novoa S, Finer M (2017) What satellites show us about Peru’s flooding. MAAP.

MAAP #57: High Resolution Satellite Images of the Flooding in Peru

Image 57. Data: ESRI, INEI, MINAM. Click to enlarge.

In the previous MAAP #56, we showed a series of satellite images of the deadly floods that recently hit northern Peru.

In this report, we show a series of new, very high resolution satellite images (50 cm) of the flooding. They show, in striking detail, some of the local impacts, including to croplands and the Panamerican Highway.

Image 57 shows the 13 rivers that recently overflowed in northern Peru.

Below, we show images of the flooding around four of the rivers, labelled A-D.


Tumbes River

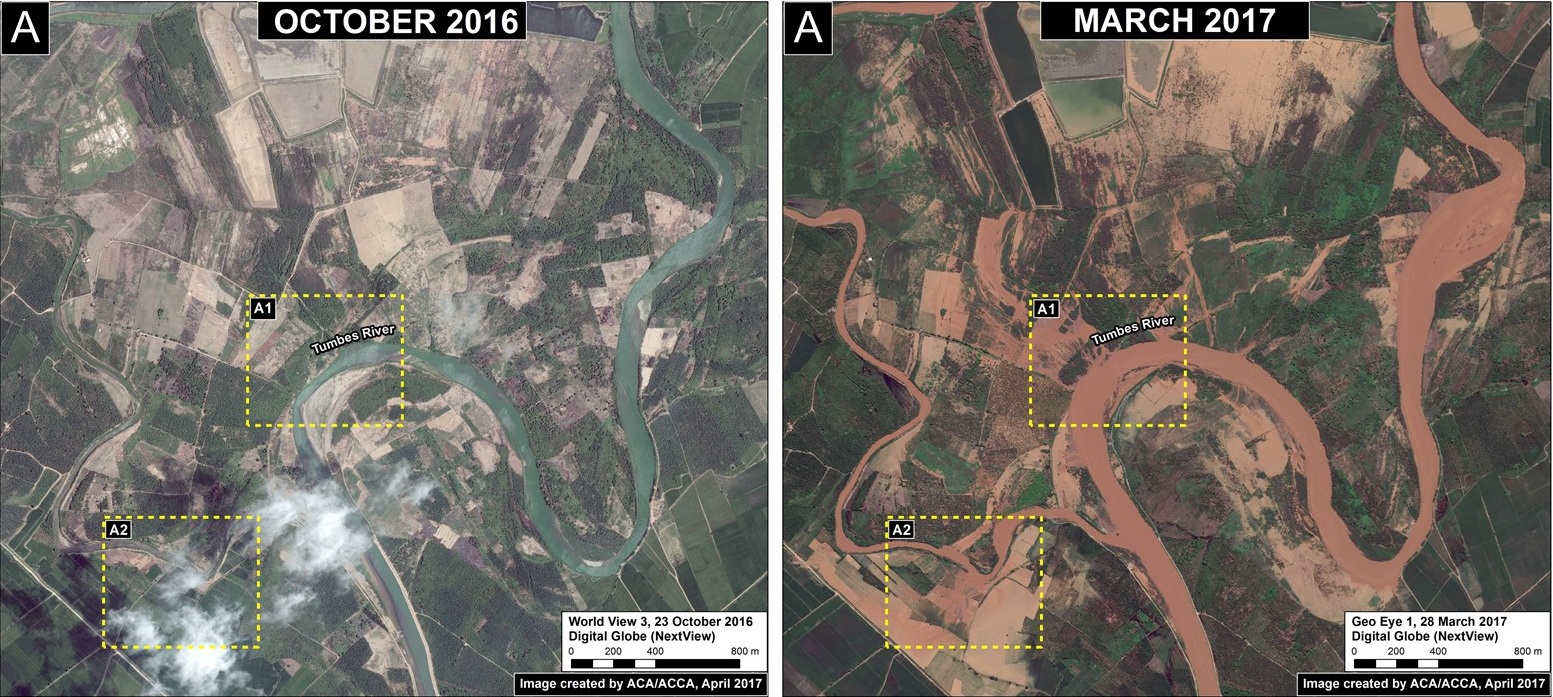
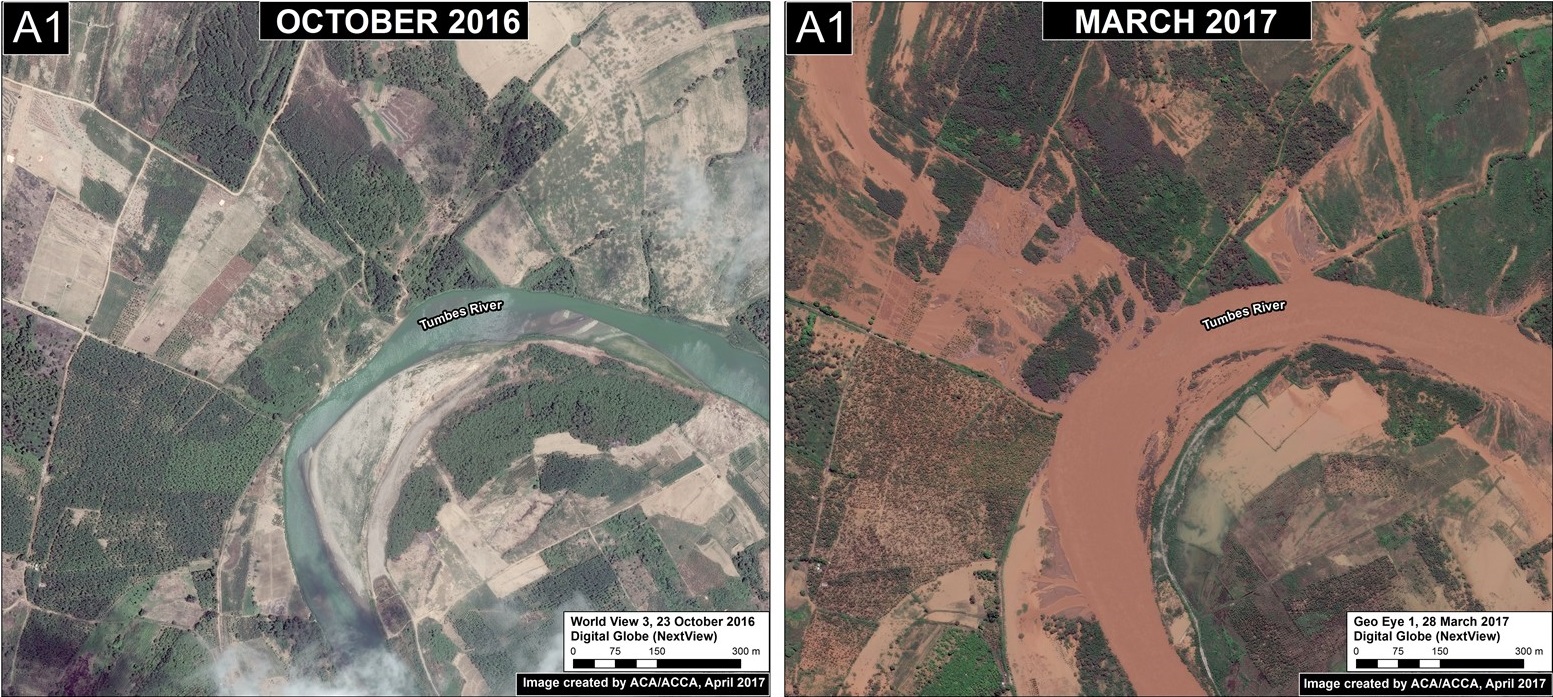
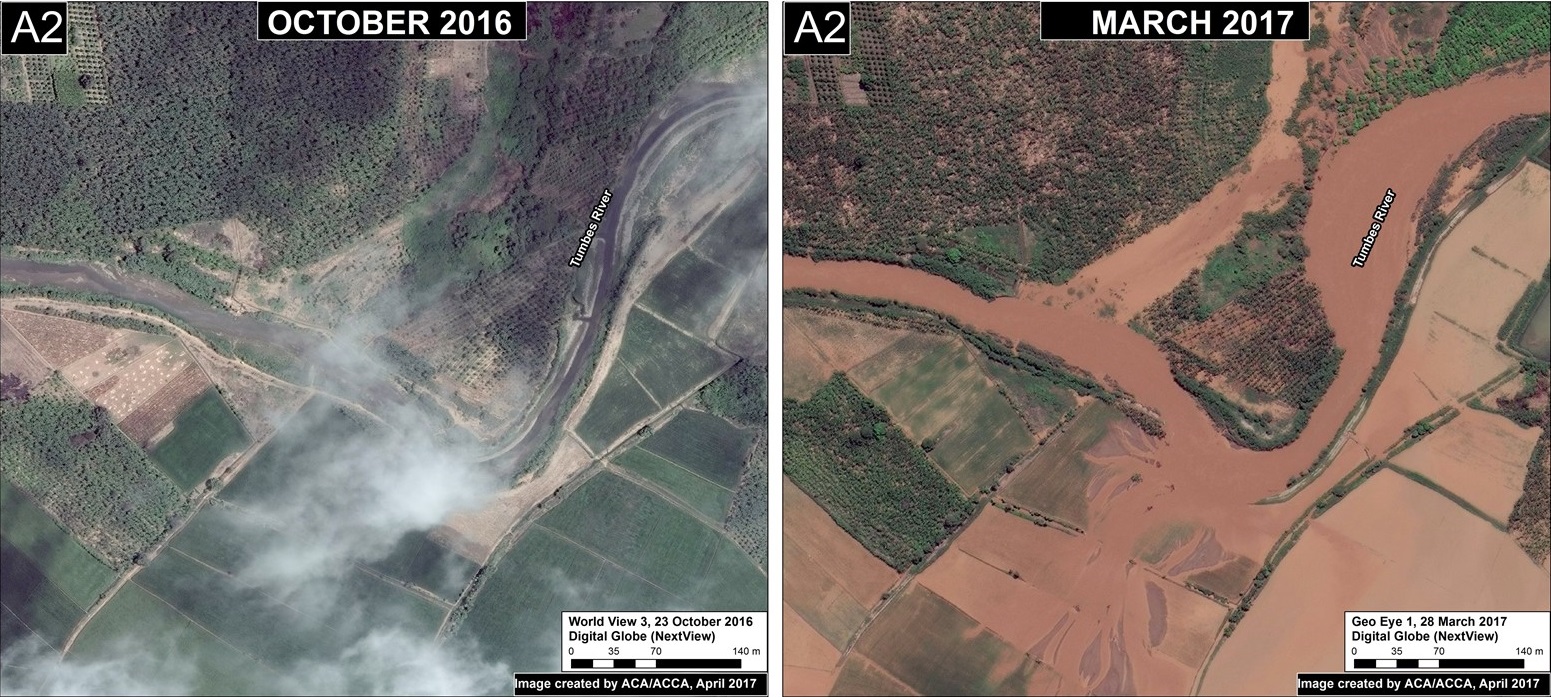
Image 57a shows the flooding along a stretch of the Tumbes River between October 2016 (left panel) and March 2017 (right panel). The yellow inset boxes indicate the areas of the follow-up zooms.

Image 57a. Data: Digital Globe (Nextview)
Inset A1. Data: Digital Globe (Nextview)
Inset A2. Data: Digital Globe (Nextview)

Chira River

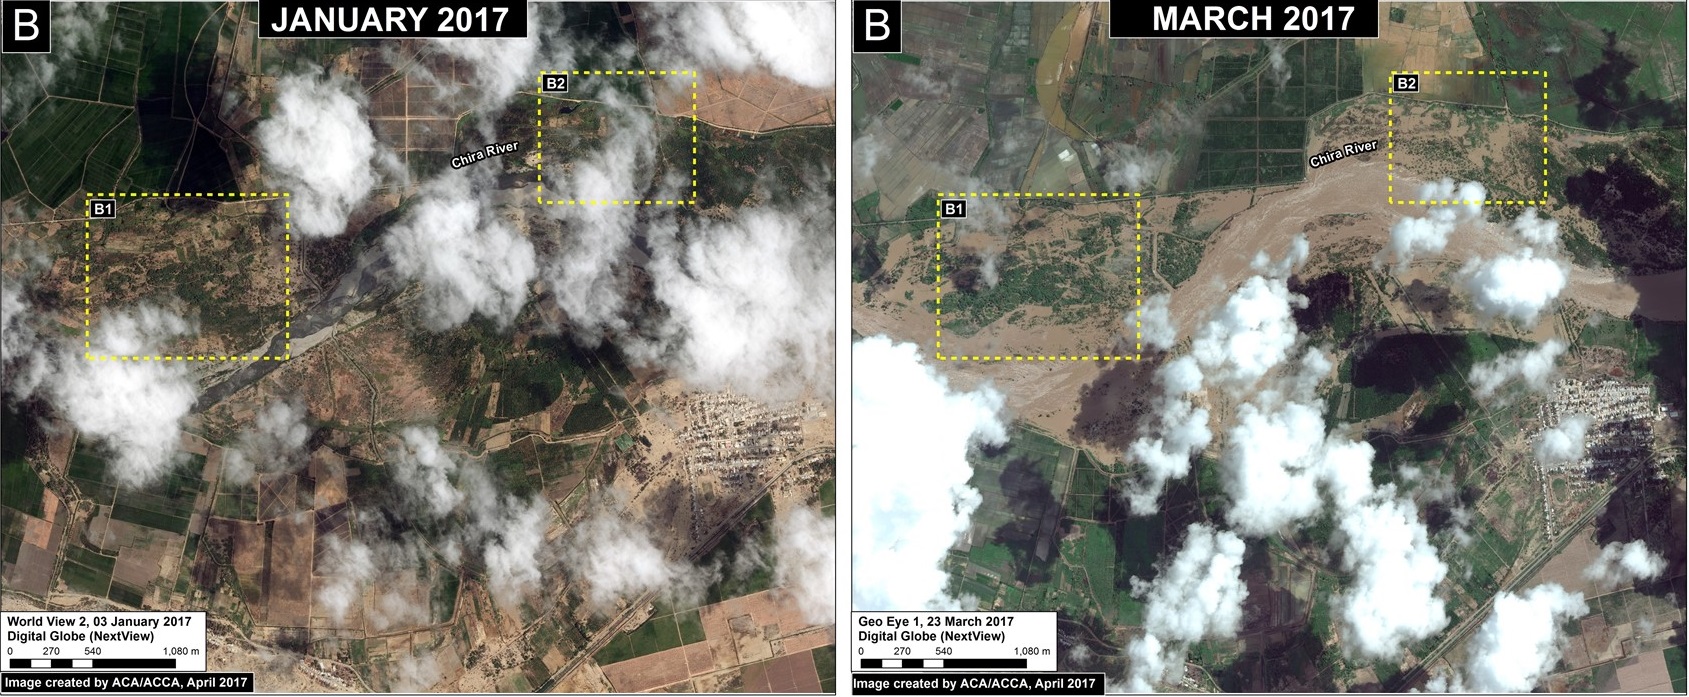
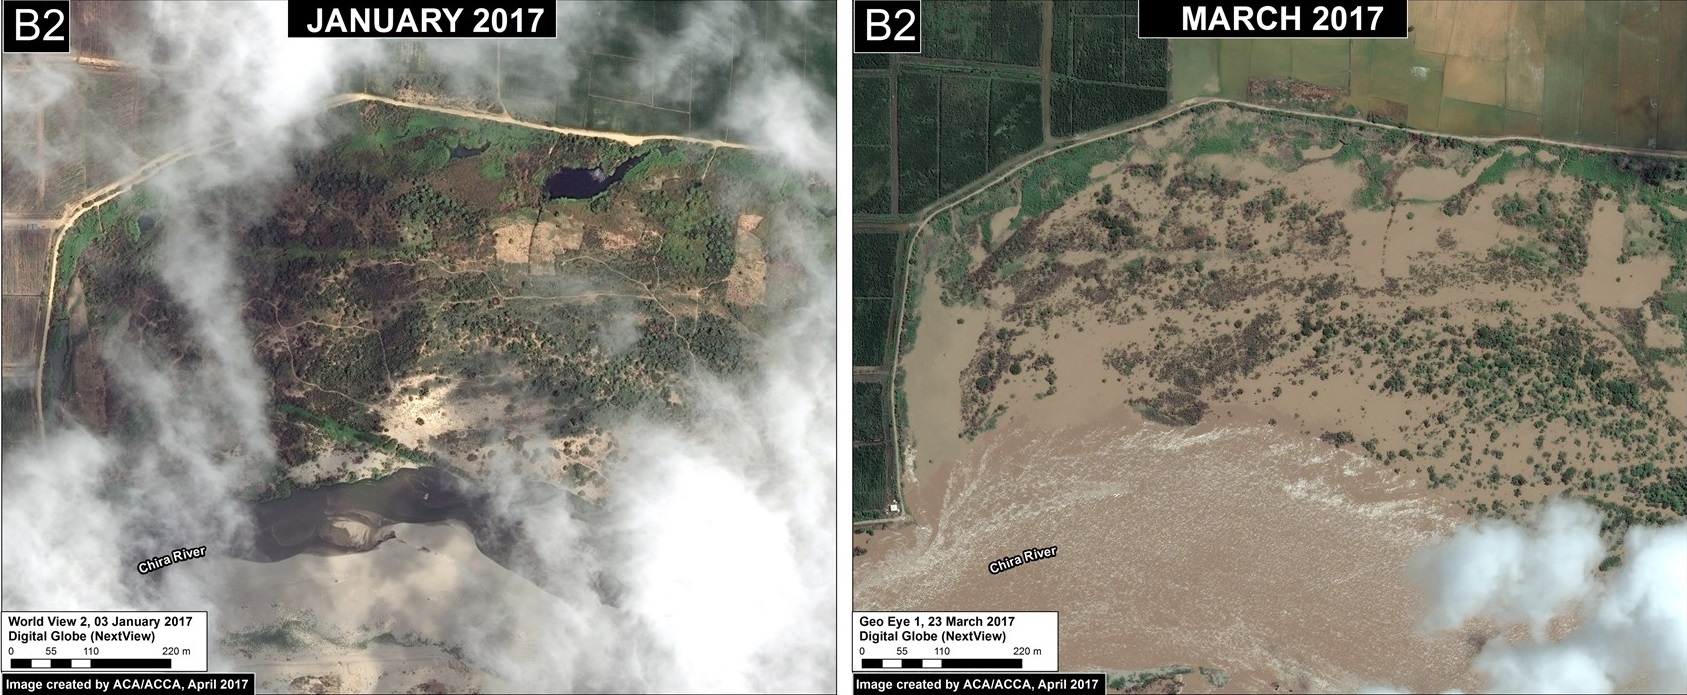
Image 57b shows the flooding along a stretch of the Tumbes River between January (left panel) and March 2017 (right panel). The yellow inset boxes indicate the areas of the follow-up zooms.

Image 57b. Data: Digital Globe (Nextview)
Inset B1. Data: Digital Globe (Nextview)
Inset B2. Data: Digital Globe (Nextview)

La Leche River

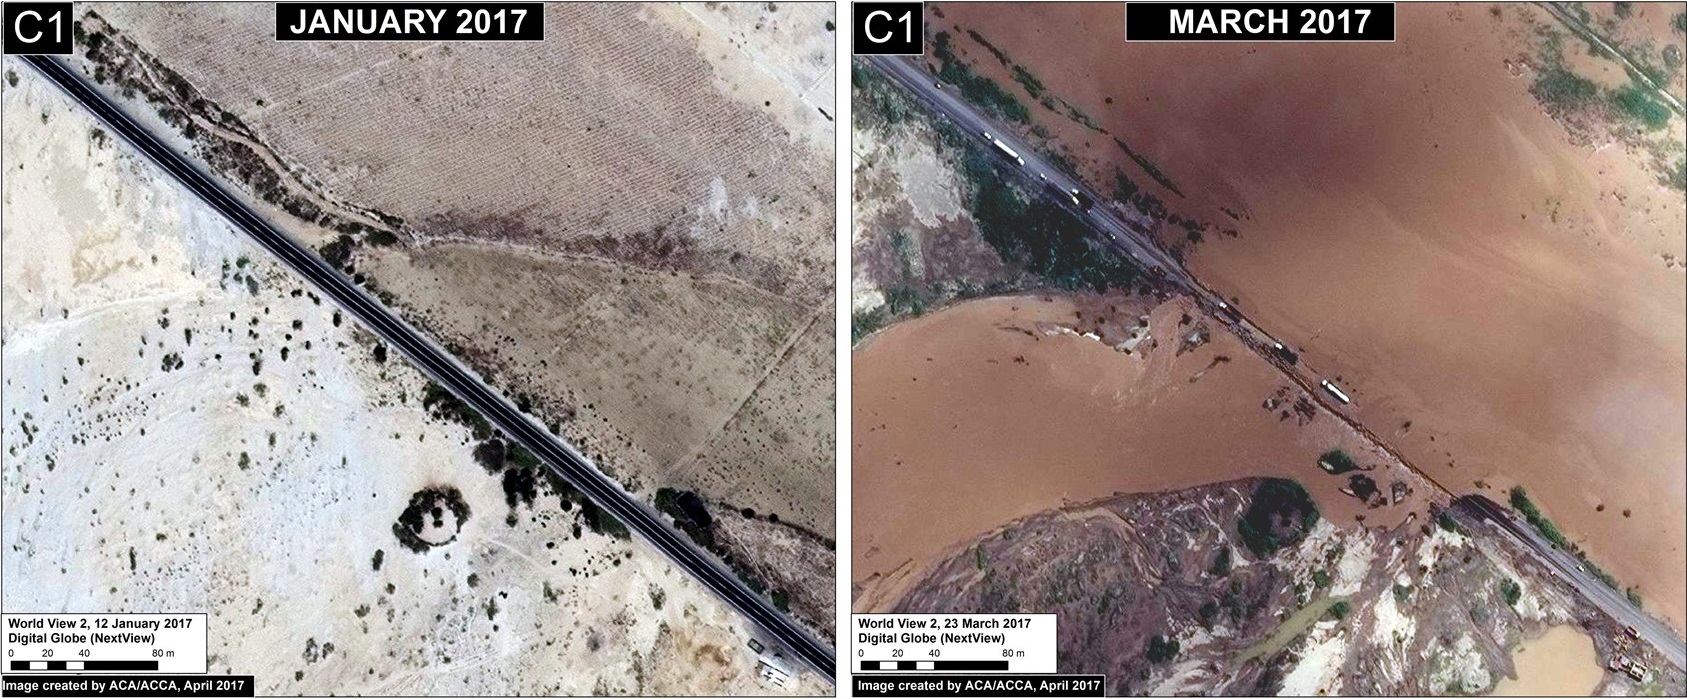
Image 57c shows the flooding along a stretch of the La Leche River between January (left panel) and March 2017 (right panel). The yellow inset boxes indicate the areas of the follow-up zooms. Note the flooding of the PanAmerican Highway.

Image 57c. Data: Digital Globe (Nextview)
Inset C1. Data: Digital Globe (Nextview)

Jequetepeque River

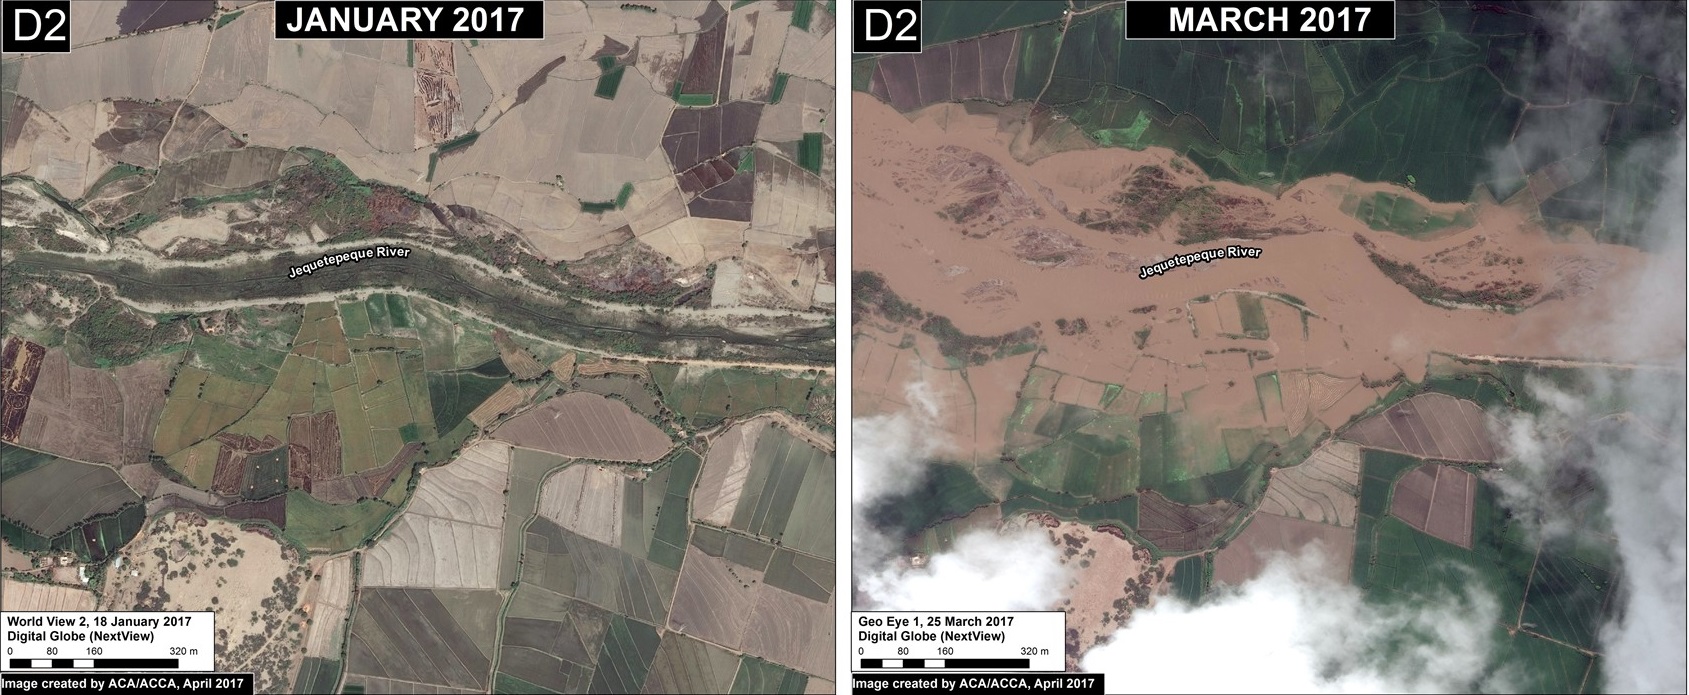
Image 57d shows the flooding along a stretch of the Jequetepeque River between January (left panel) and March 2017 (right panel). The yellow inset boxes indicate the areas of the follow-up zooms.

Image 57d. Data: Digital Globe (Nextview)
Inset D1. Data: Digital Globe (Nextview)
Inset D2. Data: Digital Globe (Nextview)

References

UNOSAT, 2017. Efectos del Niño Costero: Inundaciones en Perú, Departamentos de La Libertad & Ancash. _Marzo_20170321

UNOSAT, 2017. Efectos del Niño Costero: Inundaciones en Perú, Departamentos de La Libertad & Ancash. _Marzo_20170321

UNOSAT, 2017. Efectos del Niño Costero: Inundaciones en Perú, Departamentos de Piura. Marzo_20170320

Citation

Novoa S, Finer M (2017) High Resolution Images of the Flooding in Peru. MAAP: 57

MAAP #56: Major Flooding in Northern Peru from Coastal El Niño

Image 56. Datos: NASA, ESA, JRC/Google

Intense rainfall is causing severe and deadly flooding along the northern coast of Peru.

The cause is likely “coastal El Niño,” a phenomenon produced by abnormal ocean warming along the equatorial coast of the Pacific Ocean.

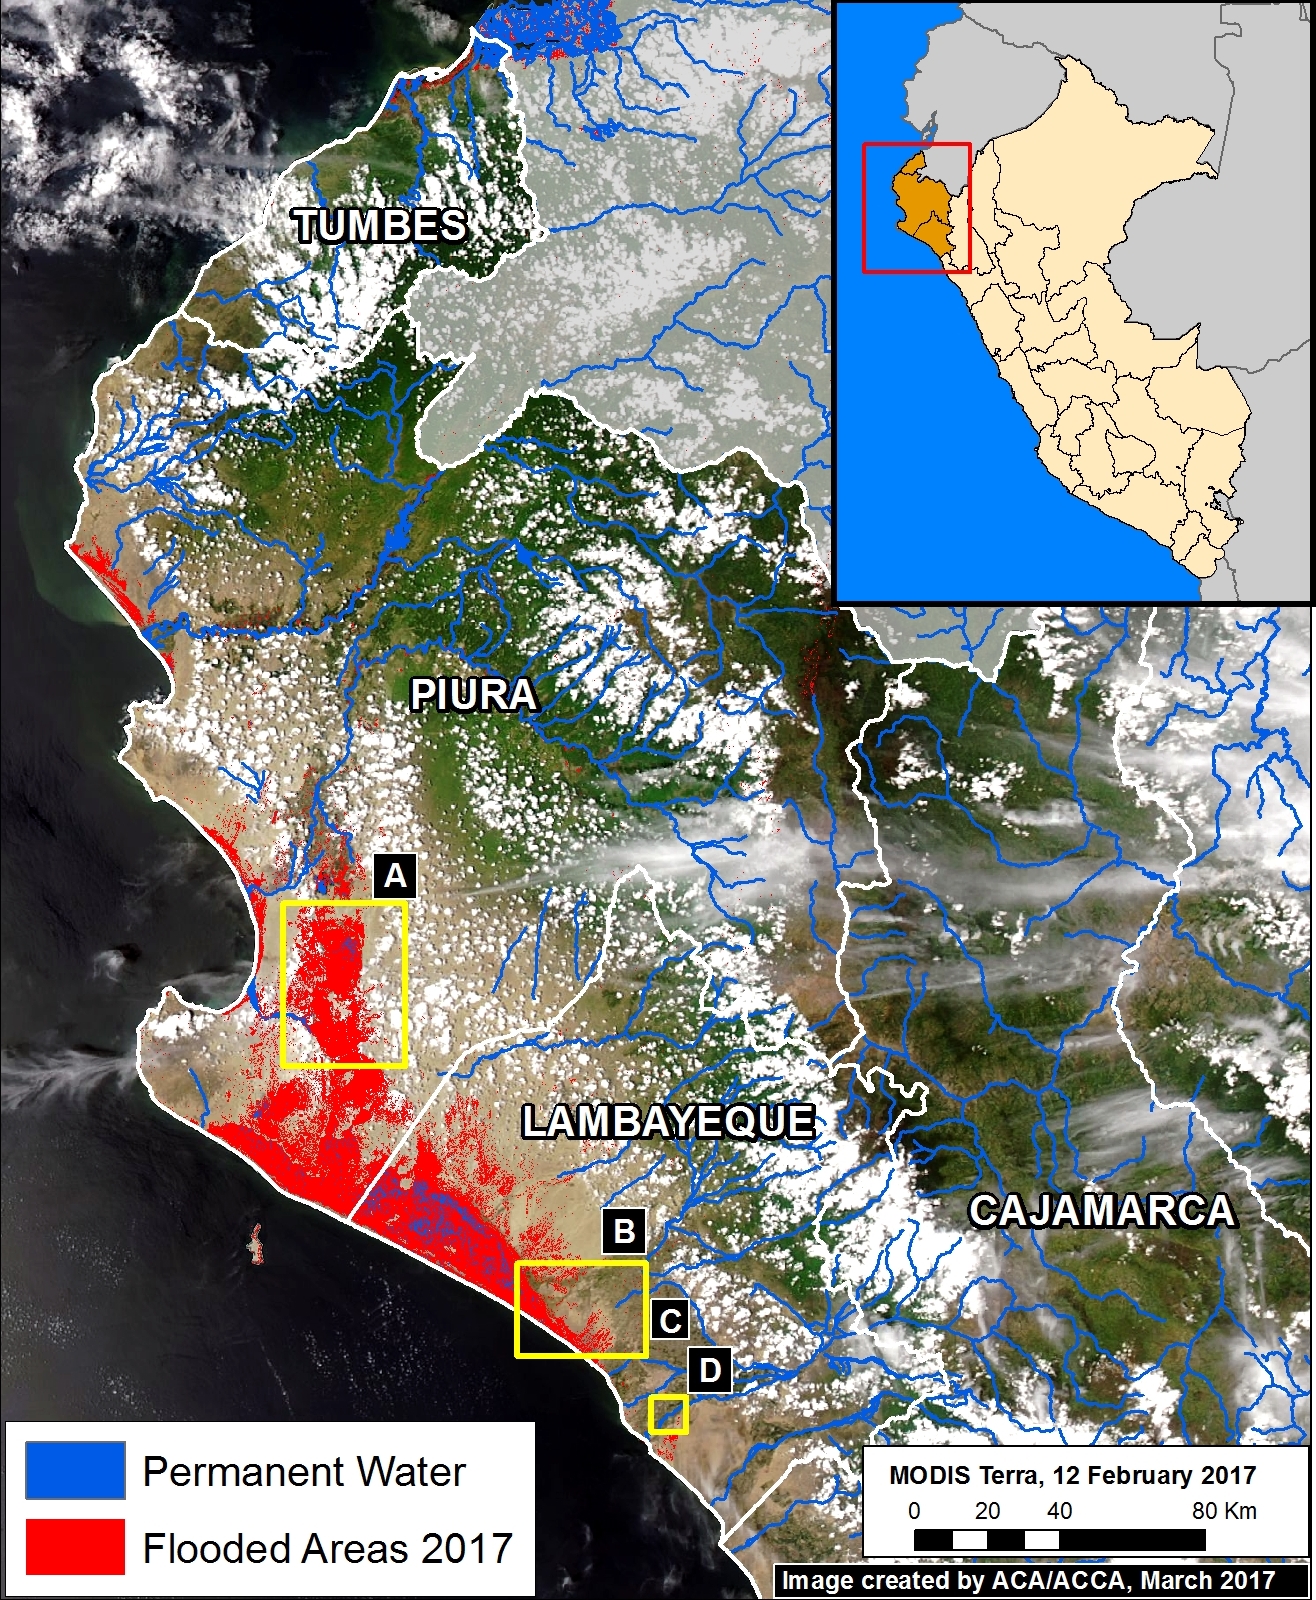
Image 56 shows a preliminary estimate of the flooded areas along the northern coast (in red). We created this estimation via an analysis of radar images (Sentinel-1) that identified areas saturated with water.

Below, we show satellite images of the areas indicated by Insets A-D, which represent examples of flooding events.

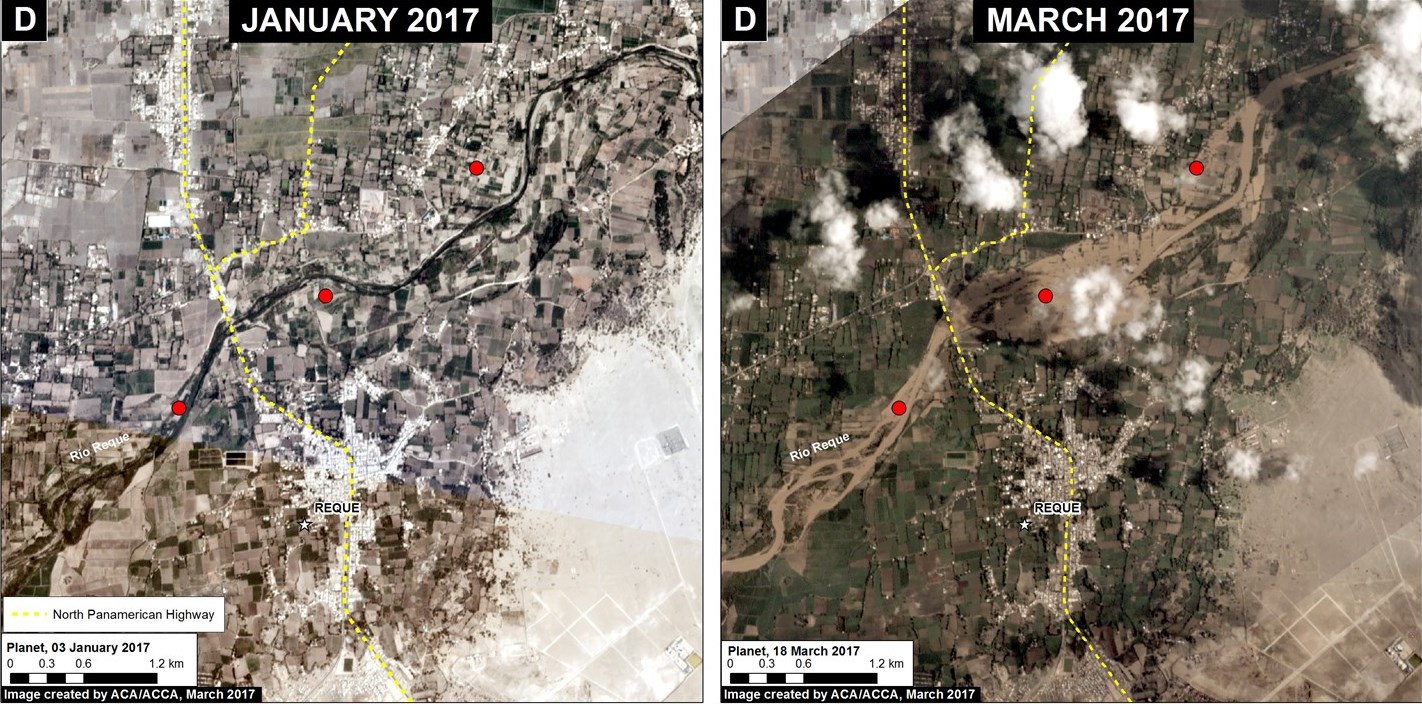
Note that the red points indicate the same spots between panels.


Formation of Temporary Lagoons

An indicator of intense rains in northern Peru is the formation of the temporary lagoons La Niña and La Niña Sur, in the region of Piura. Image 56a shows the rapid formation of the lagoons between late January (left panel) and March 2017 (right panel).

Image 56a. Data: ESA

Floods that affect Towns, Infrastructure, and Crops

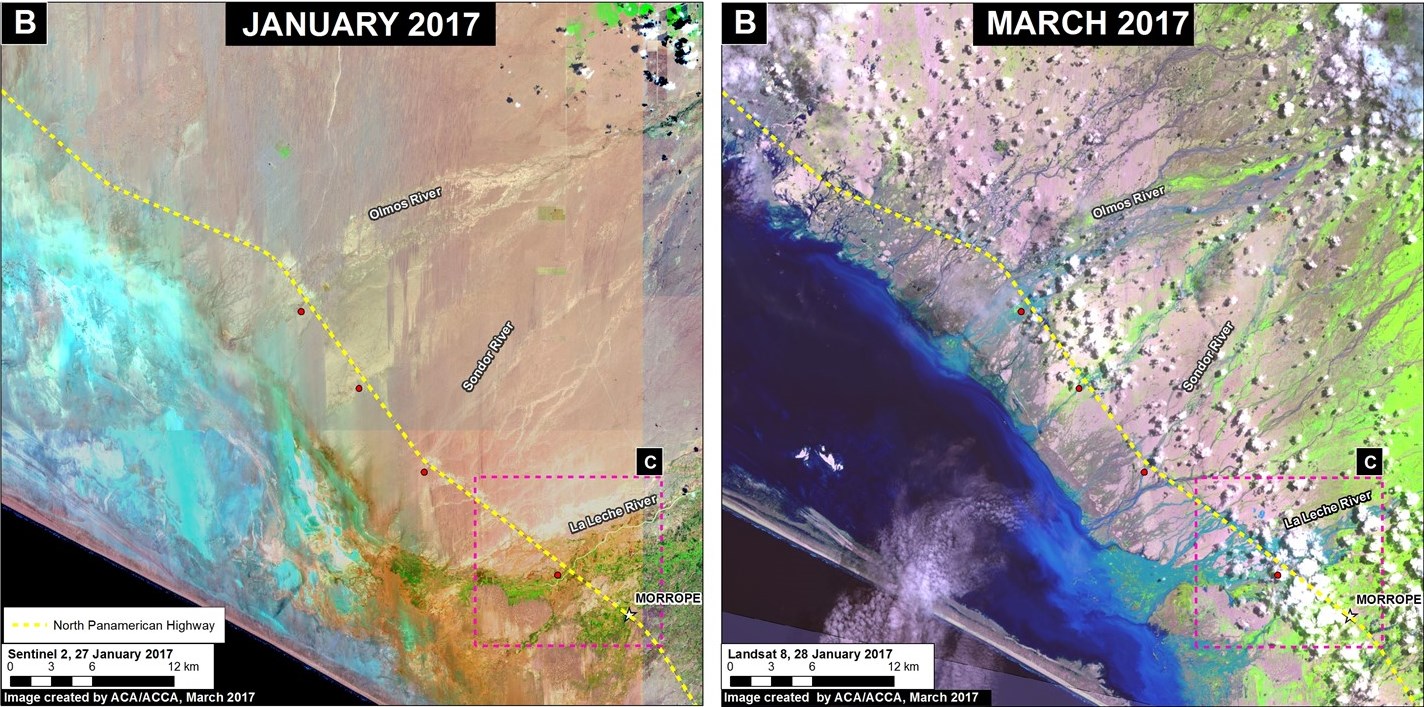
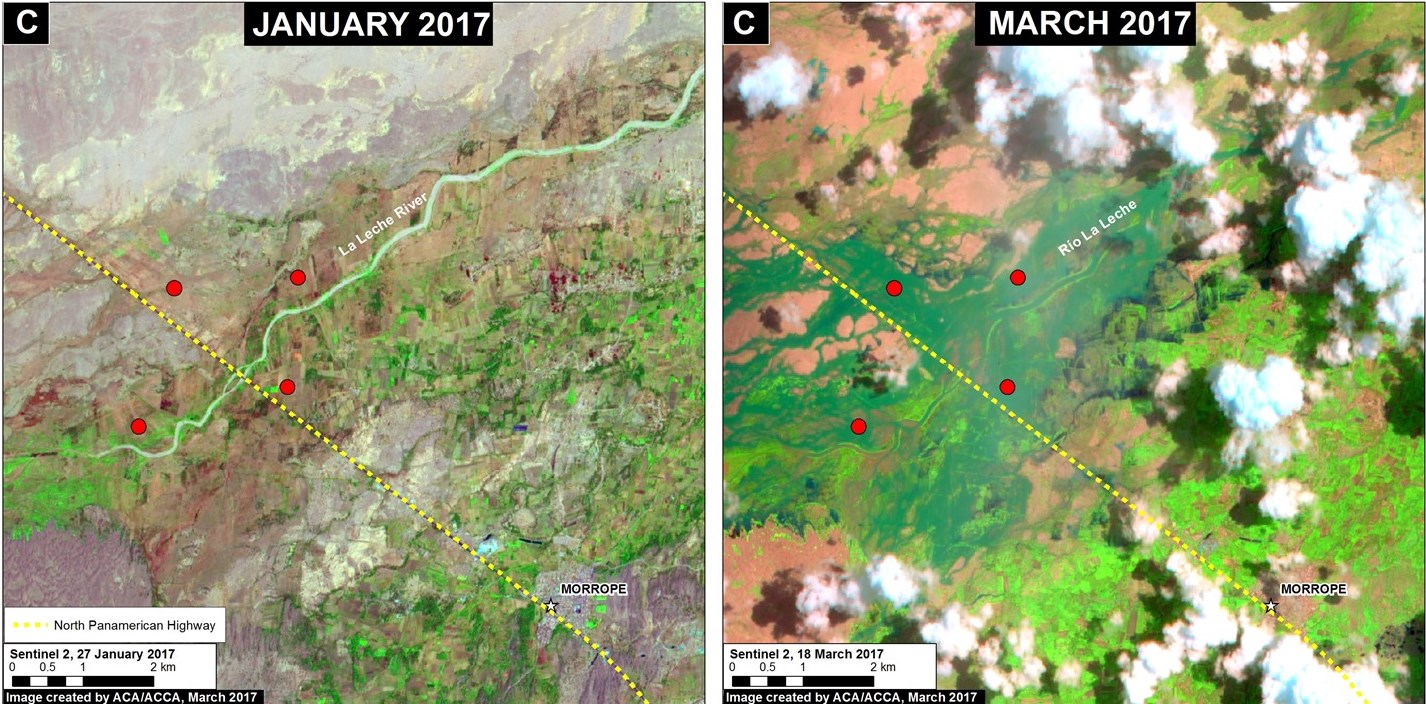
Image 56b shows areas where flooding has affected the Pan-American highway between January (left panel) and March (right panel) in the Lambayeque region. Image 56c shows a zoom of the overflowing La Leche River and the flooding of agricultural areas around the highway. Image 56d shows the flooding of the Reque River and the impact on agricultural areas and urban zones.

Image 56b. Data: ESA, NASA/USGS
Image 56c. Data: ESA
Image 56d. Data: Planet

References

Planet Team (2017). Planet Application Program Interface: In Space for Life on Earth. San Francisco, CA. https://api.planet.com

Citation

Novoa S, Finer M (2017) Major Flooding in Northern Peru from Coastal El Niño. MAAP: 56.