MAAP #189: Amazon Fire Season Heats Up

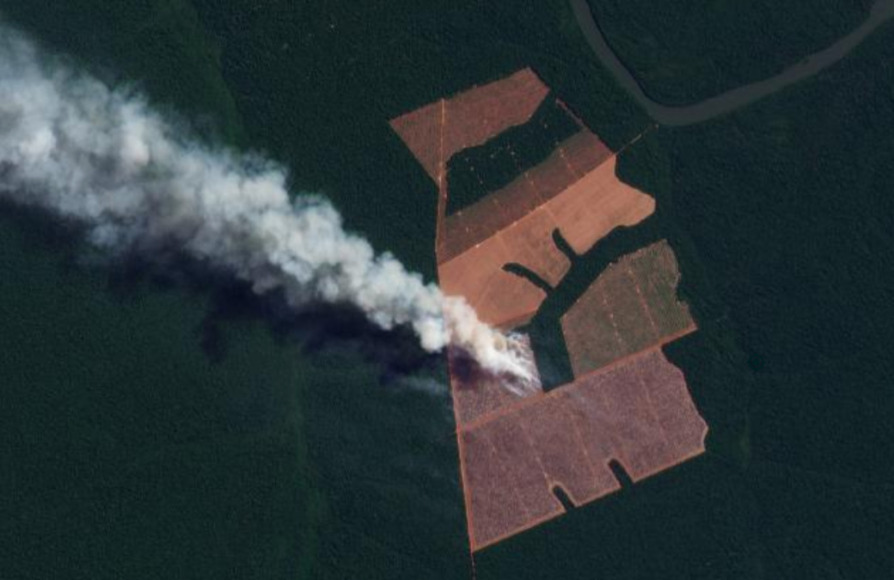
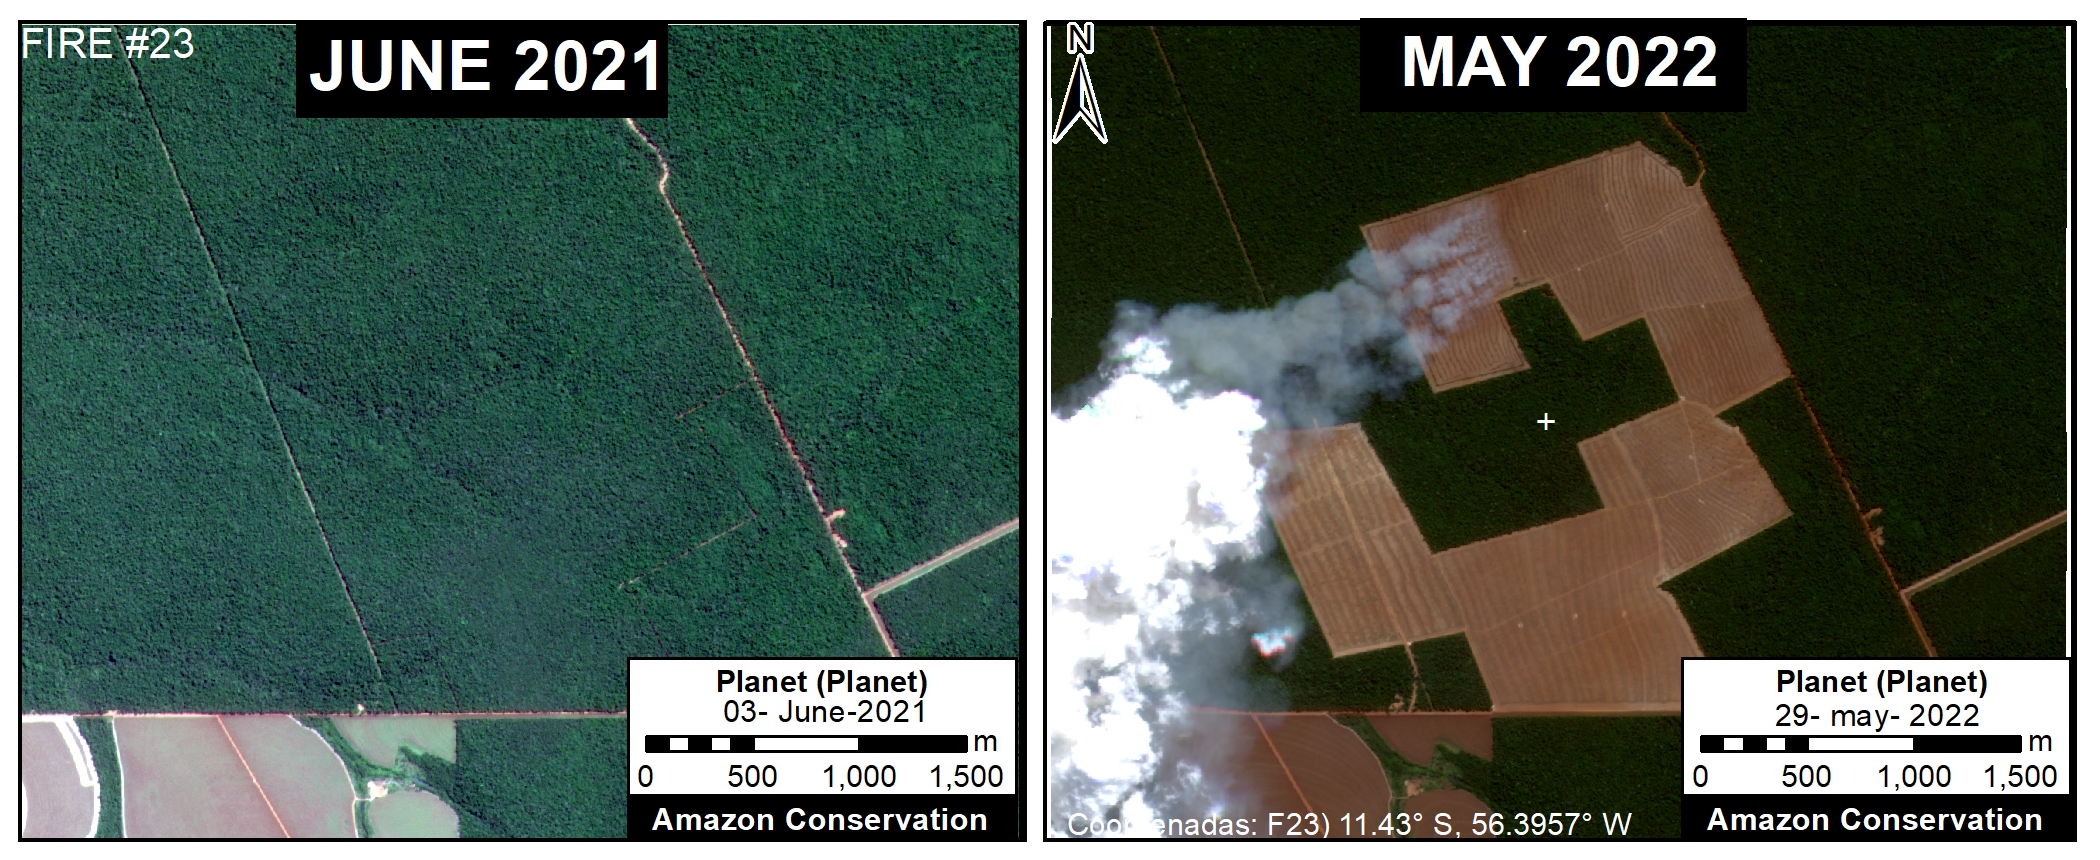
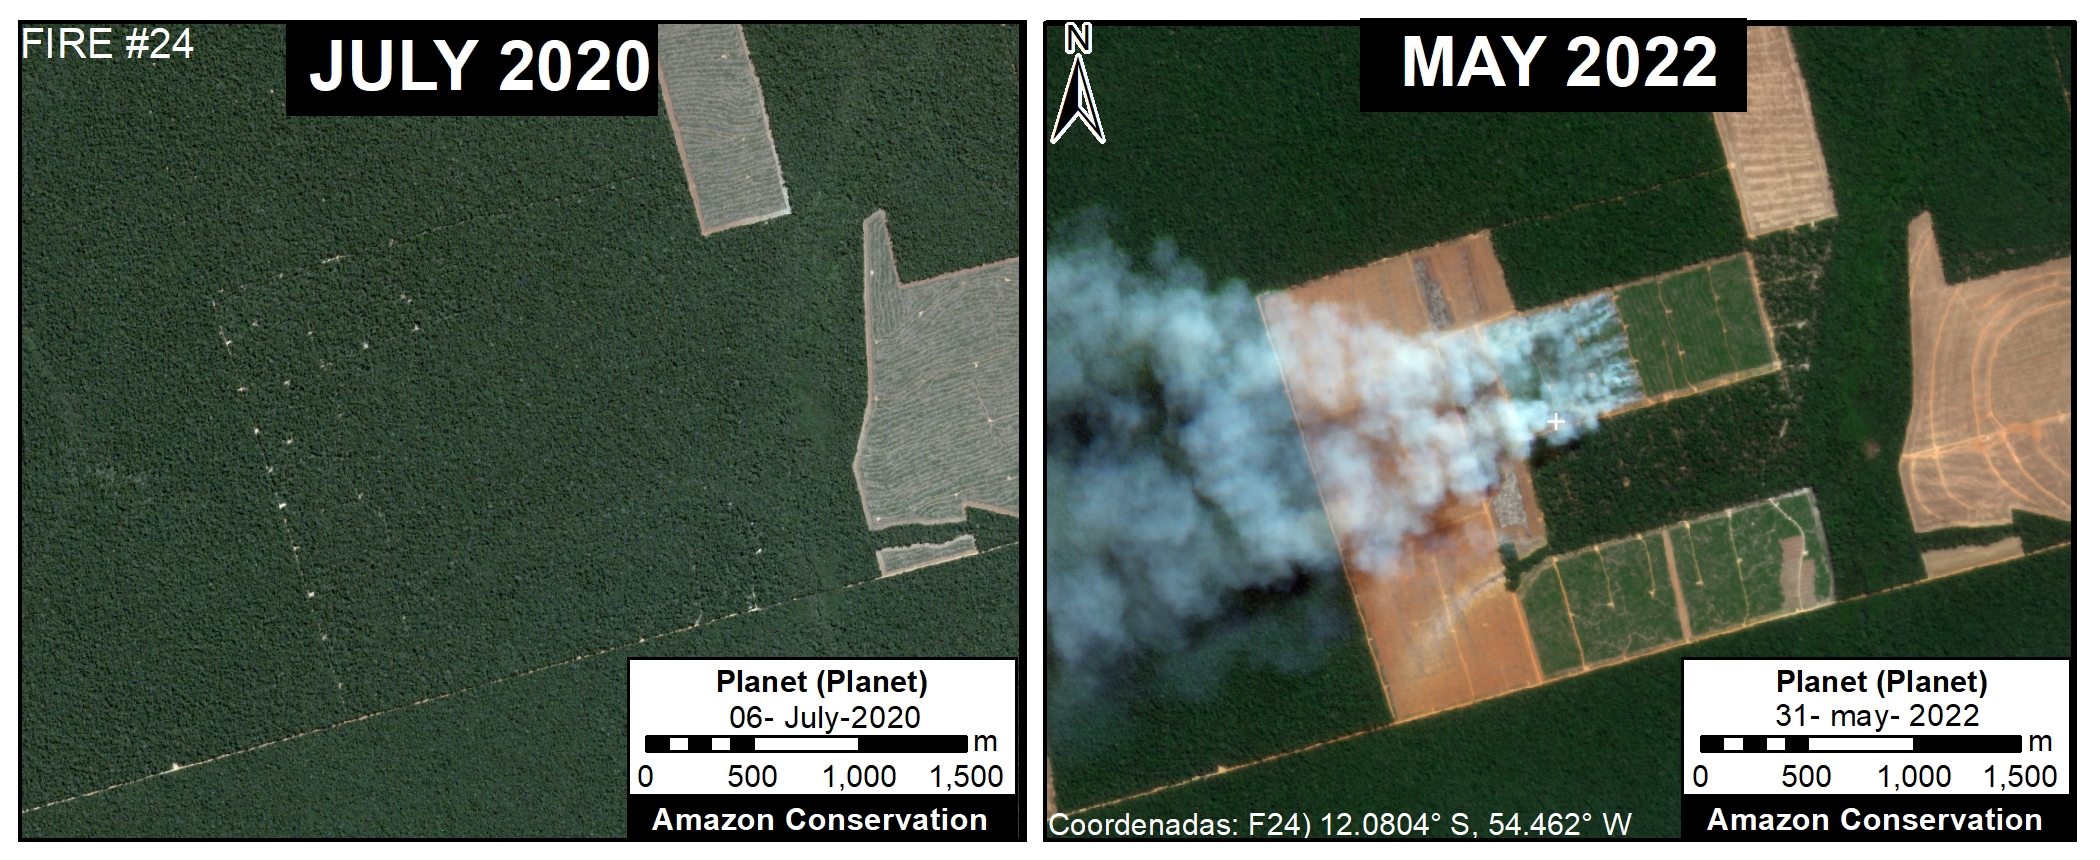
Image 1. Example of 2023 (June 29) major fire in Brazilian Amazon.

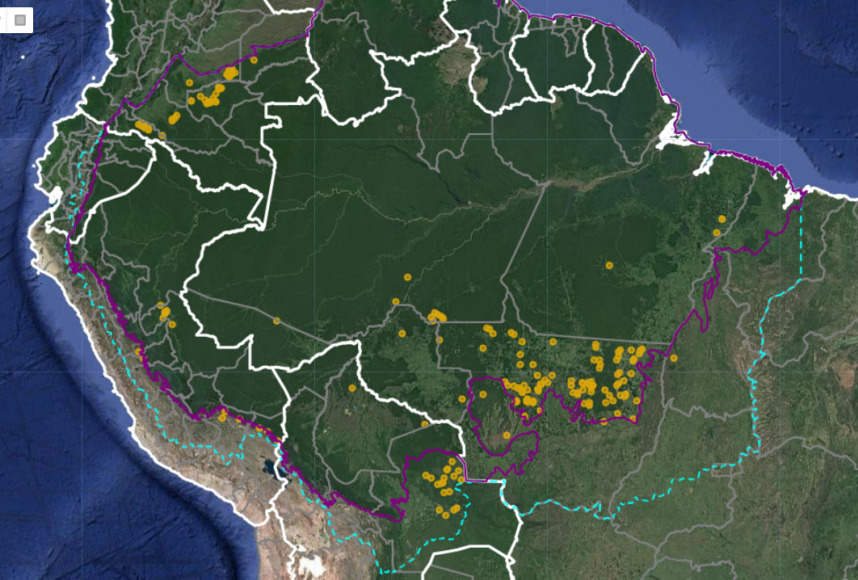
The Amazon fire season is well under way: to date, we have detected over 260 major fires thus far in 2023 (see Base Map below).

This year is of special concern because scientists indicate we have entered a new El Niño episode. The most intense Amazon fire seasons on record, 2016 and 2017, immediately followed the last major El Niño event.

Most of the fires (54%) this year have occurred in the Brazilian Amazon.

Of these, the vast majority (73%) have burned r­­­­ecently deforested areas. This high number is consistent with previous years (see MAAP #168) and once again highlights the critical link between deforestation and fires in the Brazilian Amazon. That is, most major fires are burning the remnants of a recent deforestation event.

It is also worth noting that many of the fires in the Brazilian Amazon (42%) were burning areas recently deforested specifically for new soy plantations.

We have thus far detected 40 major fires in the Bolivian Amazon. The vast majority (88%) have been burning areas recently deforested specifically for new soy plantations.

We have detected an additional 30 major fires in the Peruvian Amazon, mostly burning high elevation grasslands.

Earlier in the year, between January and March, we detected 50 major fires in the Colombian Amazon. Notably, 100% of them were in burning recently deforested areas.

These findings are based on the unique data from the real-time Amazon Fires Monitoring app developed by our partner organization in Peru, Conservación Amazónica ACCA. In a novel approach, the app combines data from the atmosphere (aerosol emissions in smoke) and the ground (heat anomaly alerts) to quickly and precisely detect major fires, defined as fires burning abundant biomass. In short, the app filters out smaller fires (such as routine burning an old field) and highlights major fires (such as burning recently deforested areas, standing forest, or natural grasslands).

2023 Major Amazon Fires Base Map

Base Map. 2023 major Amazon fires (through July 2023). Data: ACCA, ACA/MAAP.

Amazon Fires Dashboard

We also present our new Amazon fires dashboard, which currently shows results for the 2022 fire season. The dashboard highlights a number of the key findings from last year:

  • We detected 983 major fires.
  • The vast majority (72%) were in Brazil, followed by Bolivia, Peru, and Colombia.
  • Importantly, 73% of the major fires burned recently deforested areas, followed by grasslands, forest fires, and pasture.

The dashboard was developed by the SAS Institute’s Data for Good Program.

Methodology

The reported results are based on an analysis of data generated by a unique real-time Amazon Fires Monitoring app during the year 2023, through July 13.

The app, hosted by Google Earth Engine, was developed and updated daily by the Peru-based organization Conservación Amazónica (ACCA). The resulting data was analyzed and recorded daily by the US-based organization Amazon Conservation. The app was created in 2019 and upgraded in 2020, with the current version launching in May 2021.

When fires burn, they emit gases and aerosols (aerosol definition: Suspension of fine solid particles or liquid droplets in air or another gas) as part of the outgoing smoke. A relatively new satellite (Sentinel-5P from the European Space Agency) detects these aerosol emissions.

The aerosol data, which has a spatial resolution of 7.5 sq km, is not impacted by cloud cover, thus enabling near real-time monitoring during all weather conditions. The app is typically updated each day in the late afternoon/early evening with data for that same day. Thus, there is a high potential for authorities and civil society to also use this app to respond to major fires in the field.

Importantly, the app distinguishes small fires (such as from clearing old fields and thus burning little biomass) from larger fires (such as burning recently deforested areas or standing forests and thus burning high amounts of biomass).

We define a “major fire” as one showing elevated aerosol emission levels on the app, thus indicating the burning of elevated levels of biomass. This typically translates to an aerosol index (AI) of >1 (or cyan-green to red on the app).

In a novel approach, the app combines this aerosol data from the atmosphere with heat anomaly data from the ground.

For all detected major fires, we cross-referenced the aerosol emissions pattern with the ground heat-based data to pinpoint the exact location of the fire source. Typically for major fires, there is a large cluster of heat-anomaly alerts aiding the process.

In a final step, the detected major fires are then analyzed with high-resolution optical satellite imagery from Planet Explorer. With this imagery, we can confirm the major fire (by observing smoke on the day of the fire or a burned area scar in the days following the fire) and estimate its size.

Moreover, with Planet’s extensive satellite imagery archive, we can determine the fire type. That is, by comparing imagery from the fire date to previous dates, we can determine whether the fire was burning a) a recently deforested area (defined as fires in areas recently deforested during the past three years), b) an older deforested area (typically long-standing pasture areas), c) standing forest (that is, a forest fire), or natural savannah.

In the app, we can also cross-reference if a major fire has occurred within a protected area or titled indigenous territory.

Note that the high values in the aerosol indices may also be due to other reasons such as emissions of volcanic ash or desert dust so it is important to cross-reference elevated emissions with heat data and optical imagery.

Acknowledgements

This work was supported by Norad (Norwegian Agency for Development Cooperation) and ICFC (International Conservation Fund of Canada).

Citation

Finer M, Costa H, Villa L (2023) Amazon Fire Season Heats Up. MAAP: 189.

MAAP #187: Amazon Deforestation & Fire Hotspots 2022

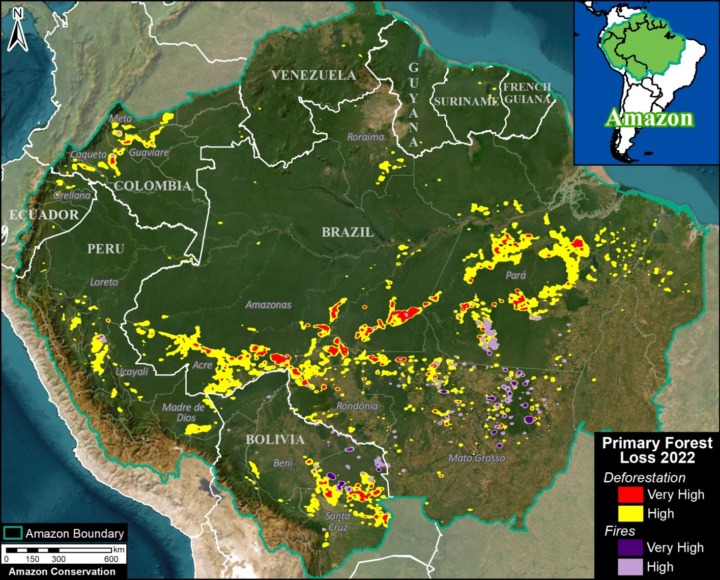
2022 Amazon Forest Loss Base Map. Deforestation and fire hotspots across the full Amazon biome. Data: UMD/GLAD, ACA/MAAP.

We present a detailed look at the major 2022 Amazon forest loss hotspots, based on the final annual data recently released by the University of Maryland (and featured on Global Forest Watch).

This dataset is unique in that it is consistent across all nine countries of the Amazon, and distinguishes forest loss from fire, leaving the rest as a proxy for deforestation (but also includes natural loss).

Thus, we are able to present both deforestation and fire hotspots across the Amazon.

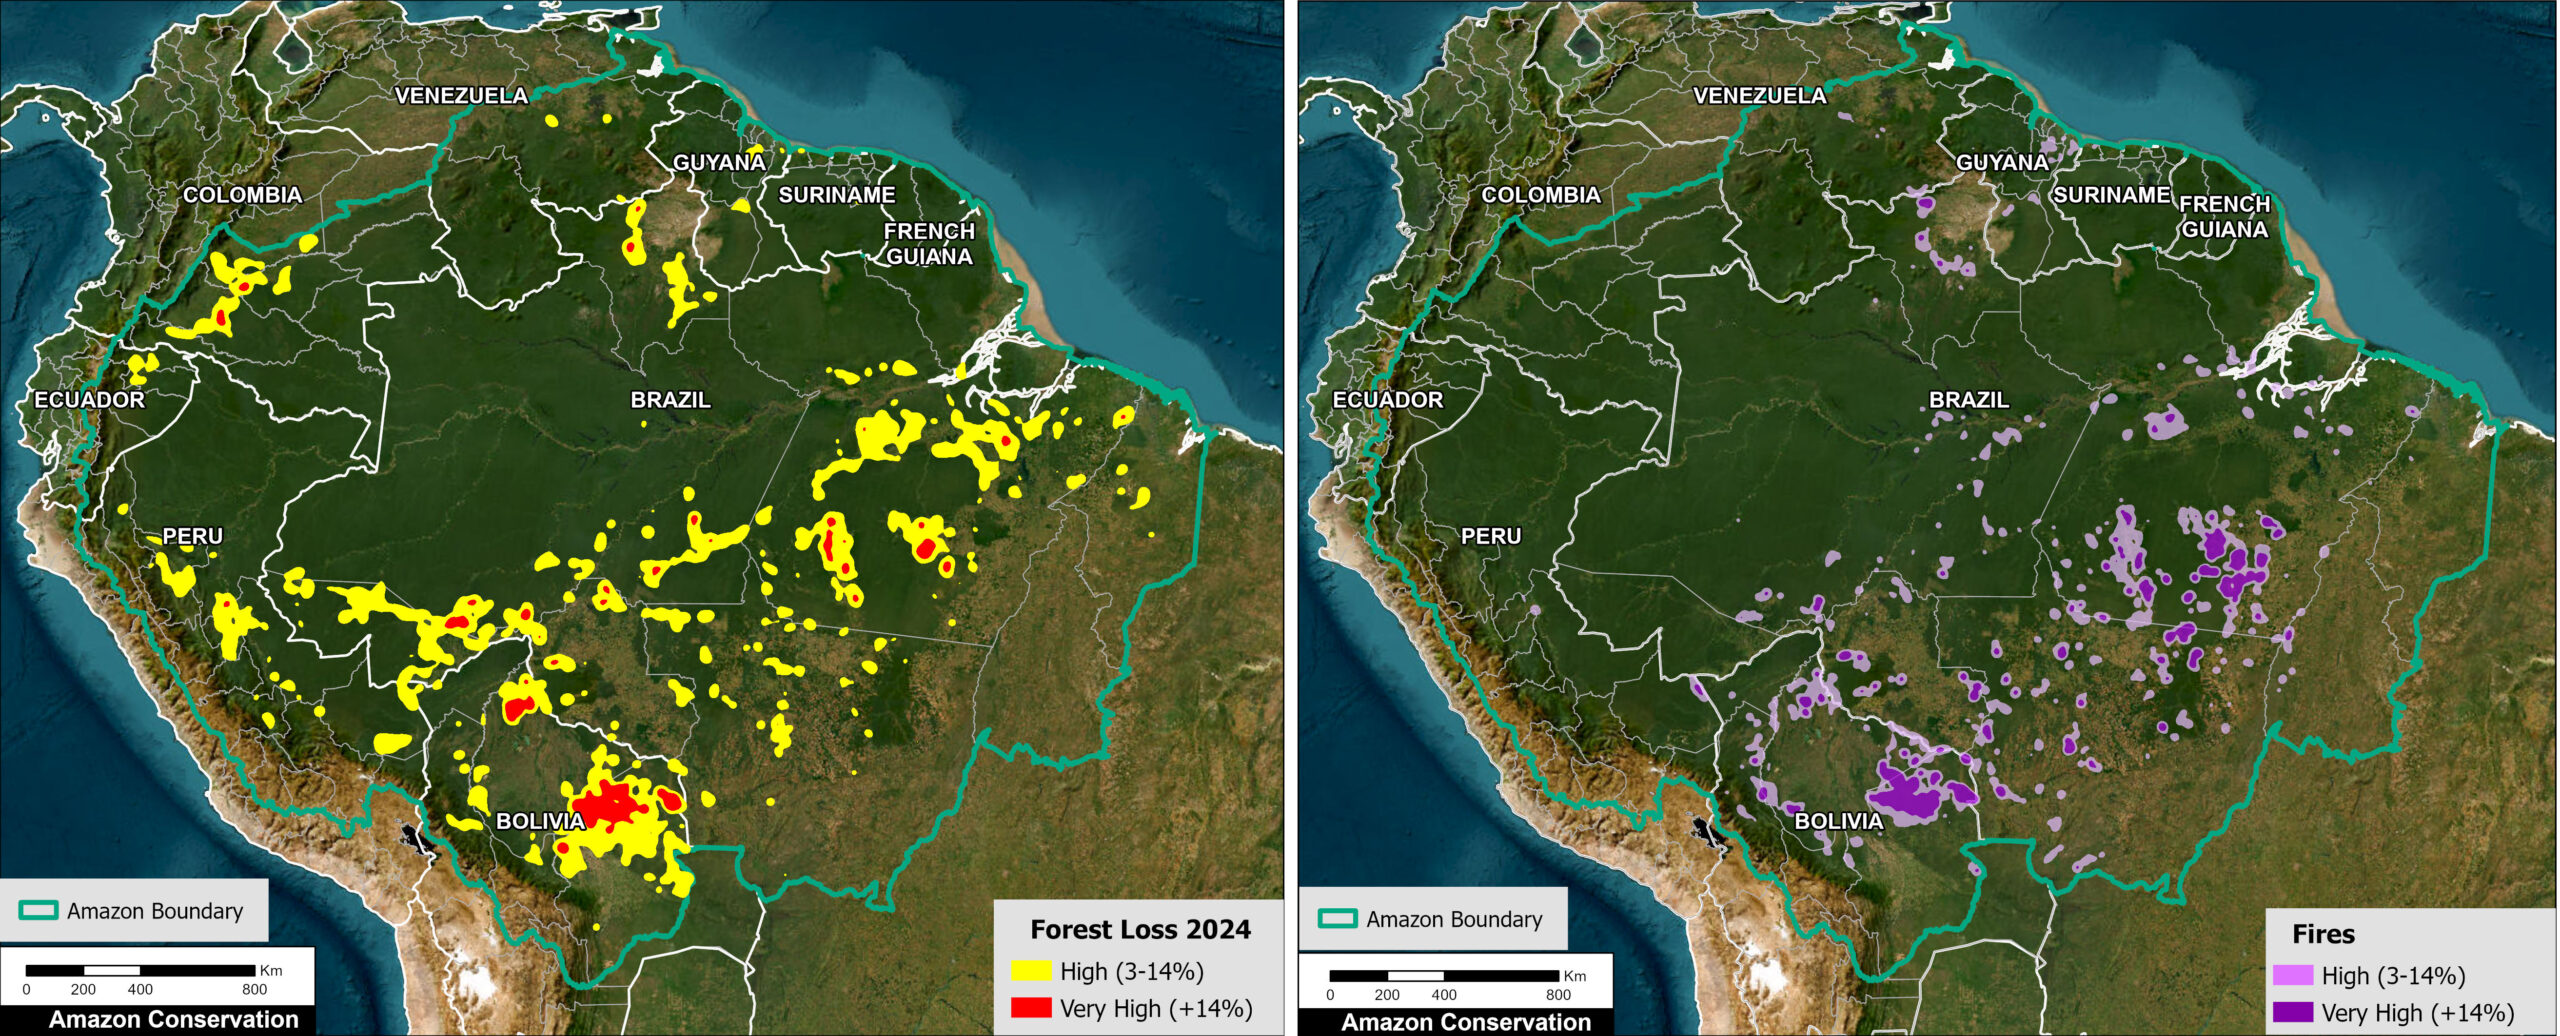
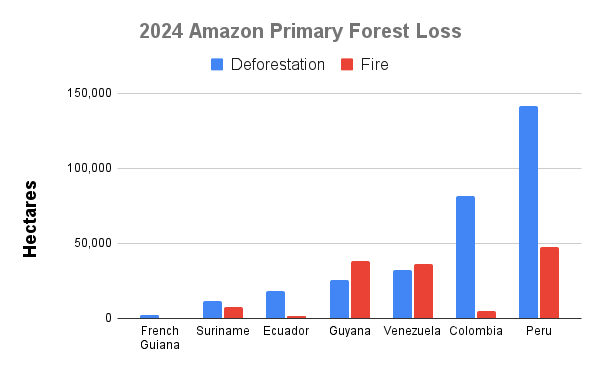
The Base Map (see right) and Results Graph (see below) reveal several key findings:

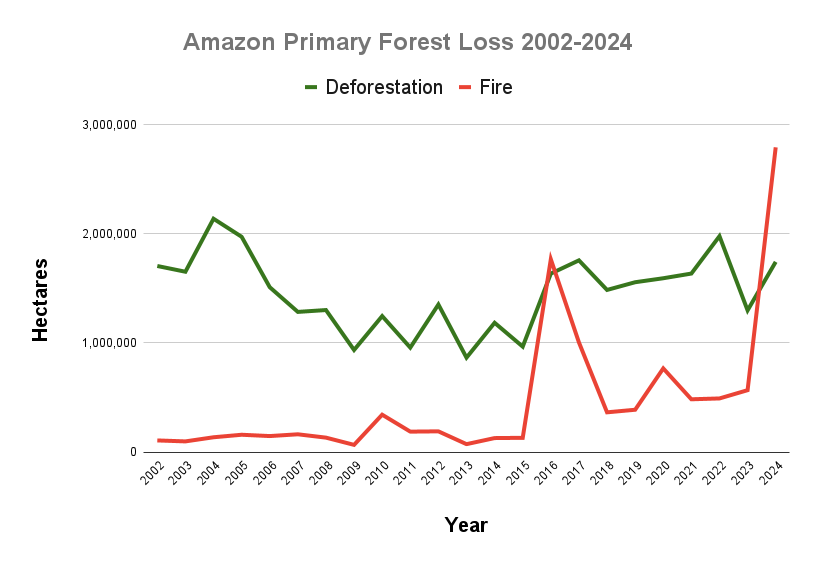
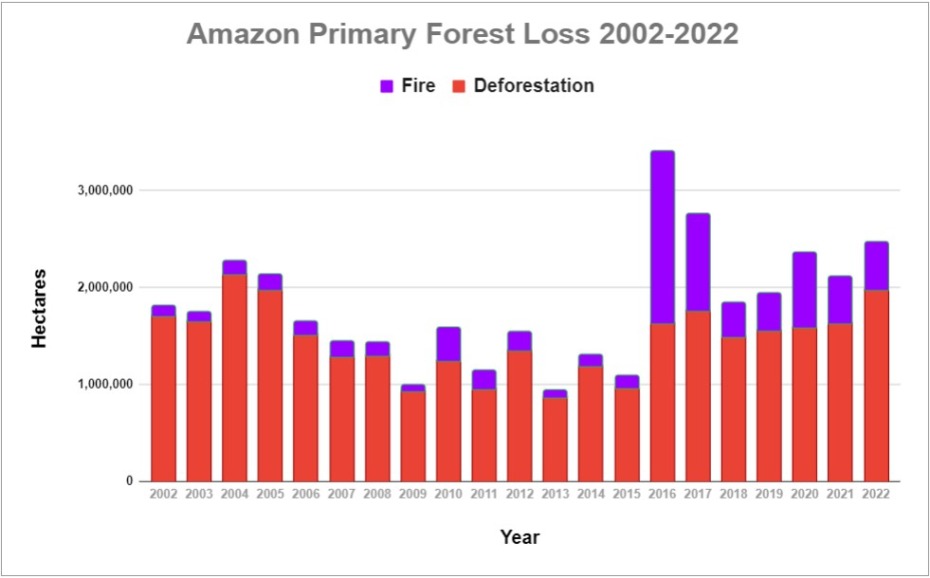
  • In 2022, we estimate the deforestation of 1.98 million hectares (4.89 million acres). This represents a major 21% increase from 2021, and is the second highest on record, behind only the peak in 2004.
    k
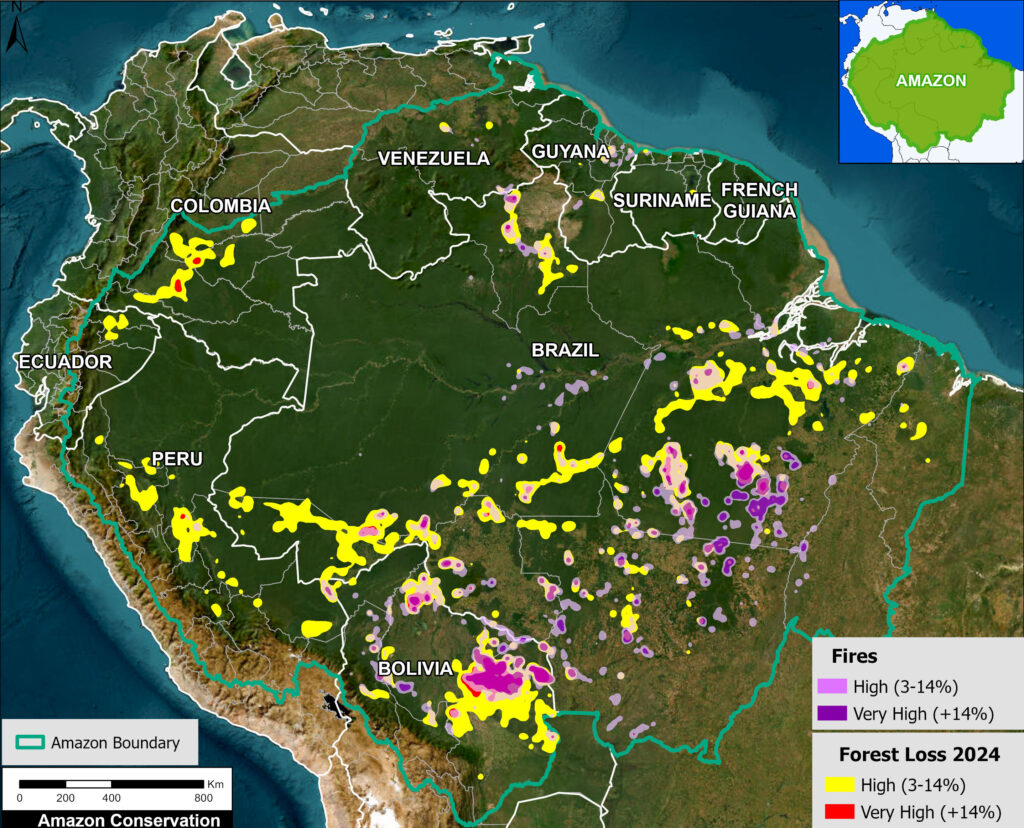
  • Deforestation hotspots were especially concentrated along roads in the Brazilian Amazon, the soy frontier in the southeast Bolivian Amazon, and near protected areas in northwest Colombian Amazon.
    k
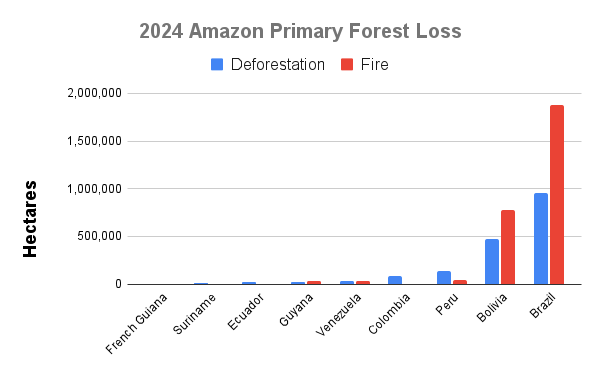
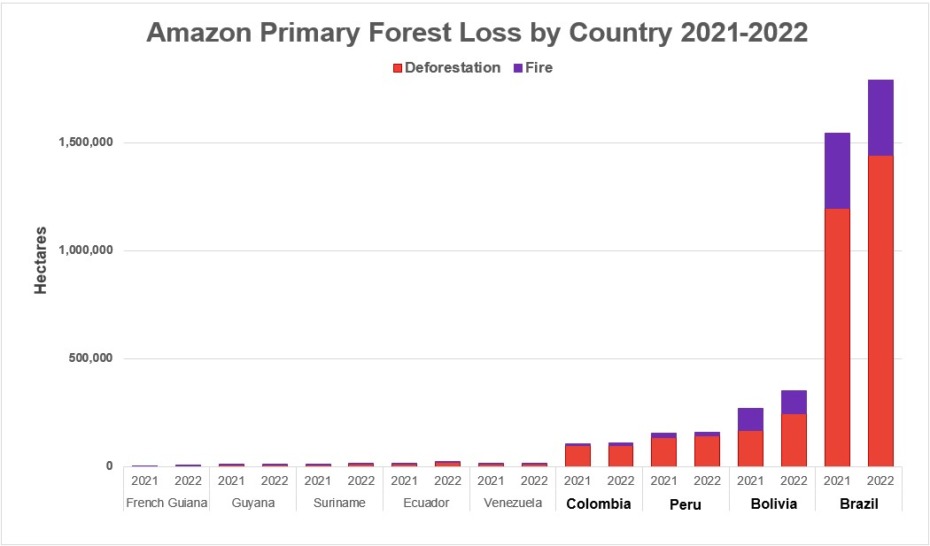
  • The vast majority of the deforestation occurred in Brazil (72.8%), followed by Bolivia (12.4%)Peru (7.3%), and Colombia (4.9%). Note that deforestation in Bolivia was the highest on record, and in Brazil the highest since the early 2000s.
    k
  • Fires impacted an additional 491,223 hectares (1.2 million acres) of primary forest. This total represents a 1.6% increase from 2021, and the 4th highest on record (behind only intense fire seasons of 2016, 2017, and 2020). Moreover, each of the seven most intense fire seasons has occurred in the past seven years. Nearly 93% of the fire impact occurred in just two countries: Brazil and Bolivia.
    k
  • In total, 2.47 million hectares (6.1 million acres) of primary forest were impacted by deforestation and fire. This total represents the third highest on record, only behind the post-El Niño years of 2016 and 2017.
    k
  • Since 2002, we estimate the deforestation of 30.7 million hectares (75.9 million acres) of primary forest, greater than the size of Italy or the U.S. state of Arizona.

Below, we zoom in on the six countries with the highest deforestation (Brazil, Bolivia, Peru, Colombia, Ecuador, and Venezuela) with additional maps and analysis.

Amazon Primary Forest Loss (Combined), 2002-2022

Amazon Forest Loss Results Graph, 2002-22. Data: UMD/GLAD, ACA/MAAP.

Amazon Primary Forest Loss (By Country), 2002-2022

Brazilian Amazon

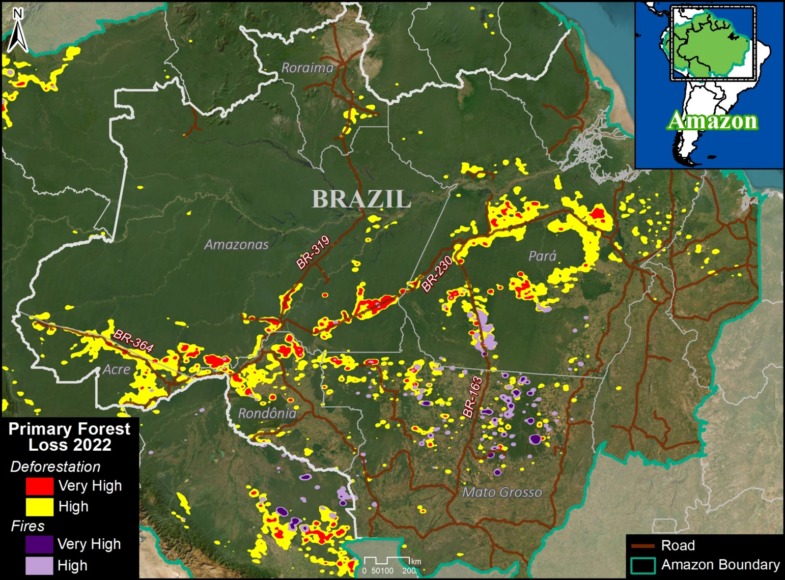
Brazil Base Map, 2022. Deforestation and fire hotspots in the Brazilian Amazon in relation to major roads. Data: UMD/GLAD, ACA/MAAP.

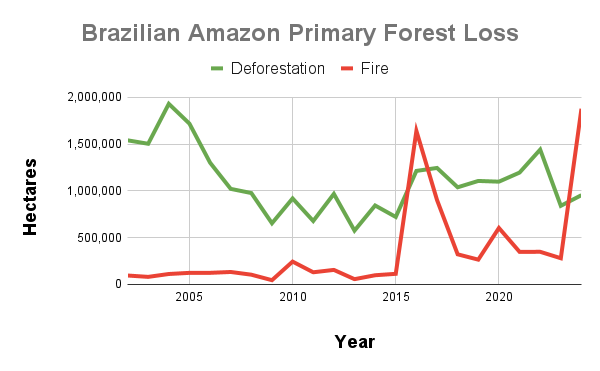
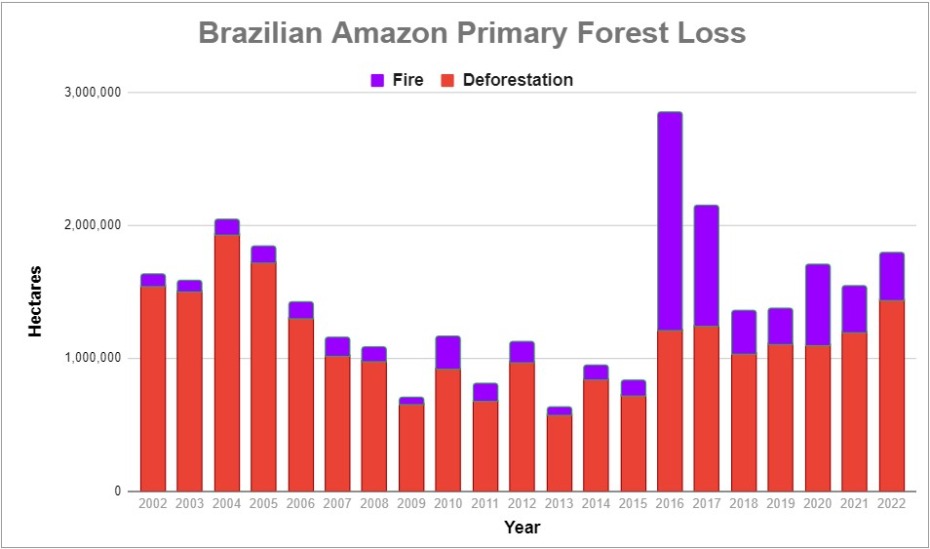
In 2022, the Brazilian Amazon lost 1.4 million hectares (3.56 million acres) of primary forest to deforestation. Fires directly impacted an additional 348,824 hectares.

The deforestation rose 20.5% from 2021, and was the highest on record since the peak years of 2002 – 2005.

The fire impact was the 4th highest on record, only behind the intense fire years of 2016, 2017, and 2020.

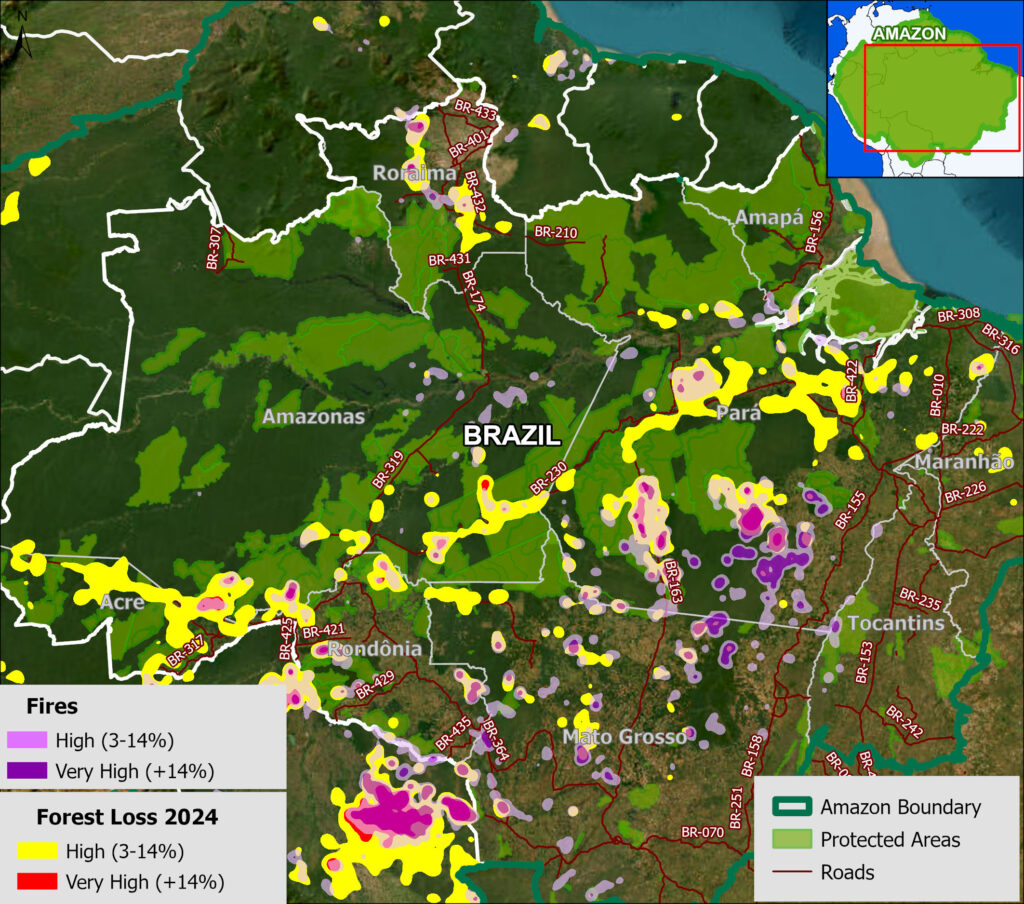
The deforestation was concentrated along the major road networks, especially roads 230 (Trans-Amazonian Highway), 364, 319, and 163 in the states of Amazonas, Pará, Rondônia, and Acre (see Brazil Base Map).

The direct fire impacts were concentrated in the soy frontier, located in southeastern state of Mato Grosso


Bolivian Amazon

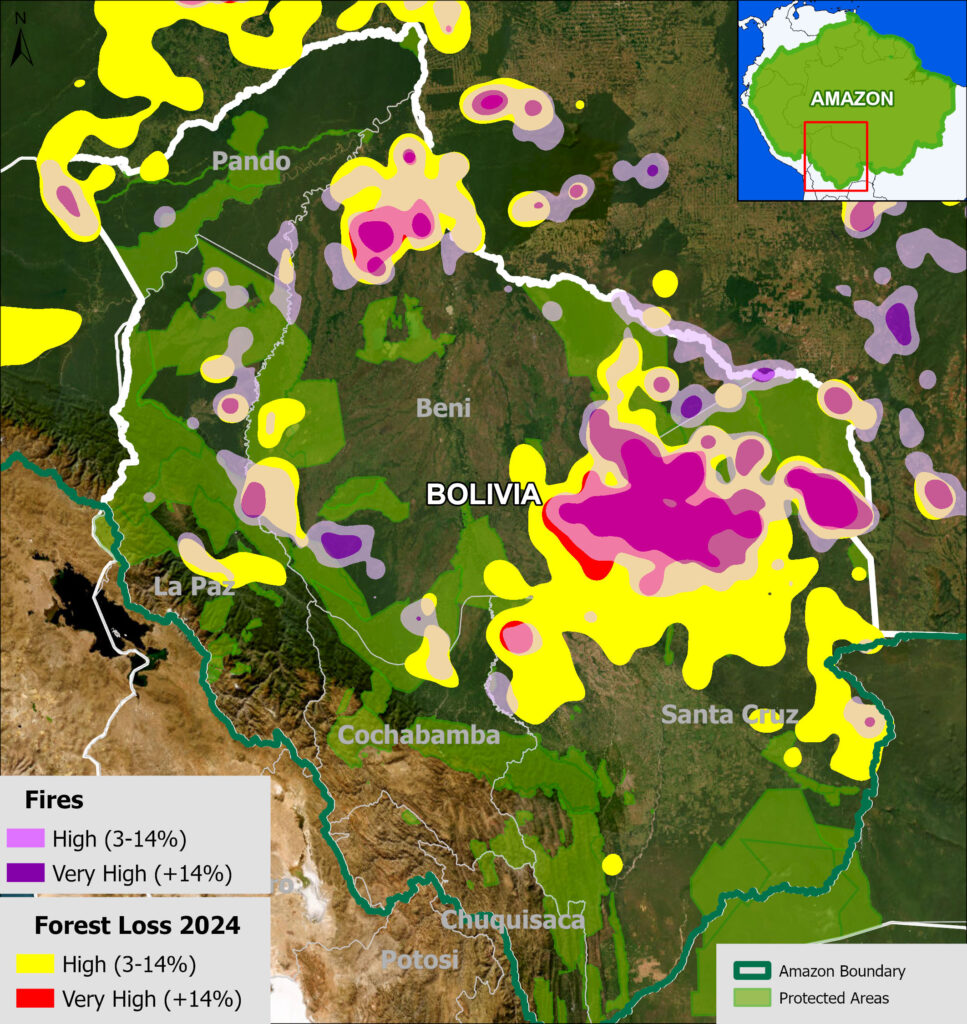
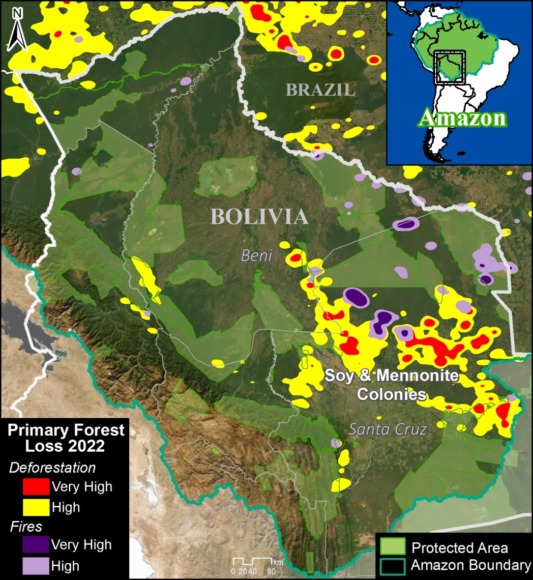
Bolivia Base Map, 2022. Deforestation and fire hotspots in Bolivian Amazon. Data: UMD/GLAD, ACA/MAAP.

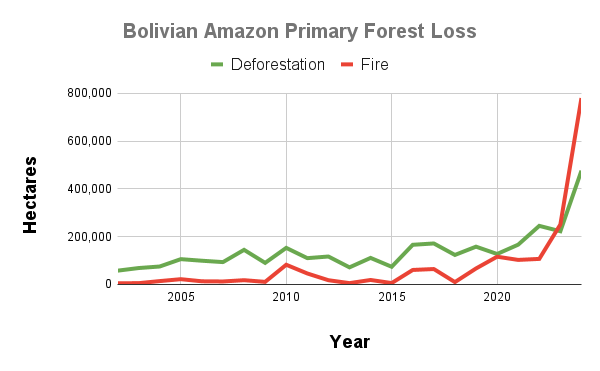
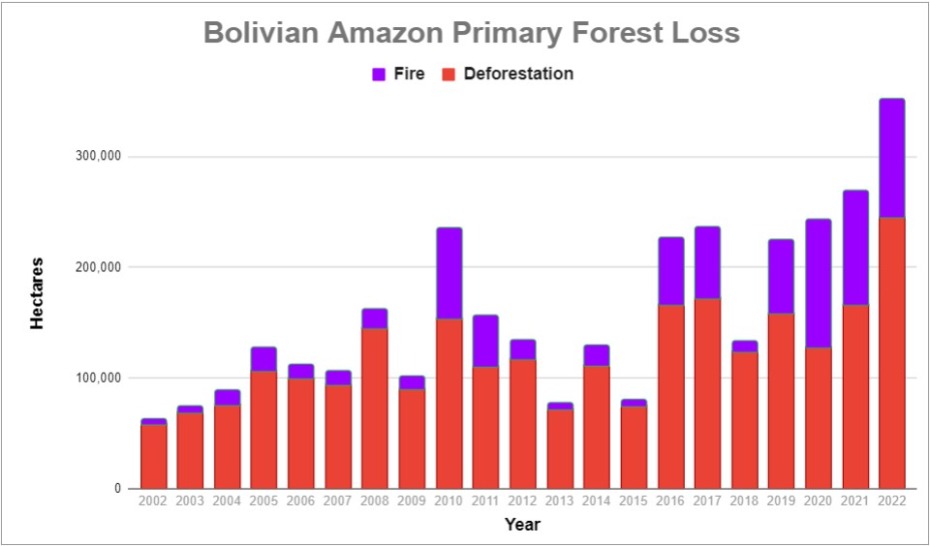
In 2022, the Bolivian Amazon lost 245,177 hectares of primary forest to deforestation. Fires directly impacted an additional 106,922 hectares.

We highlight that this deforestation was 47% higher than 2021, and the highest on record (by far).

The fire impact was also up from last year, and the second-highest on record behind just the intense year of 2020.

Both the deforestation and fires were concentrated in the soy frontier located in southeastern department of Santa Cruz (see Bolivia Base Map).


Peruvian Amazon

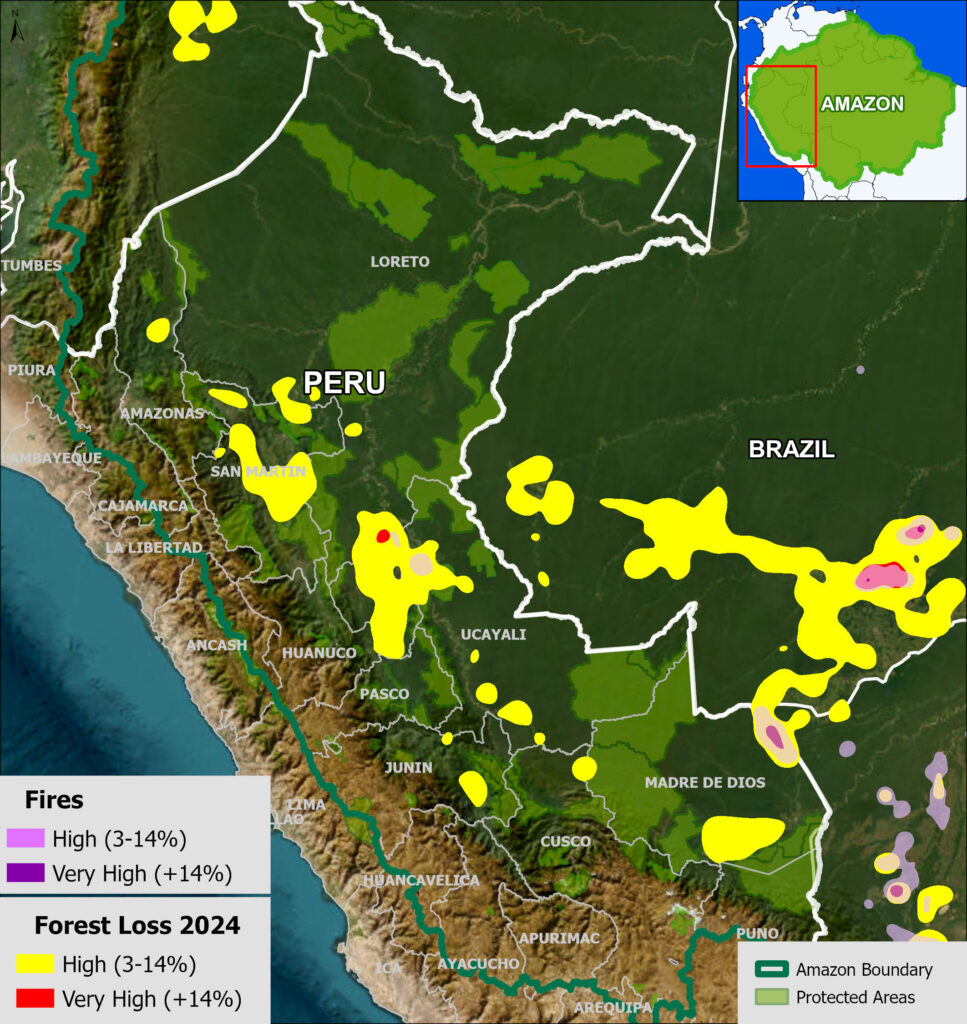
Peru Base Map, 2022. Deforestation and fire hotspots in the Peruvian Amazon. Data: UMD/GLAD, ACA/MAAP.

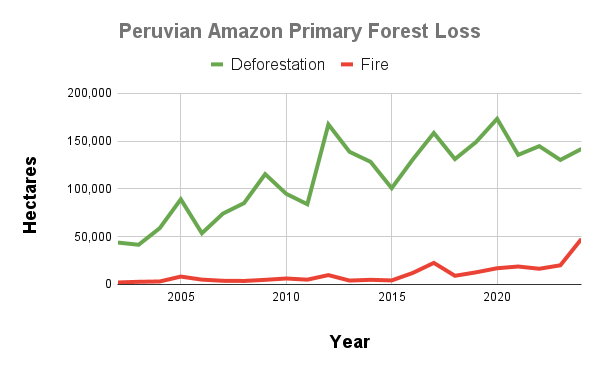
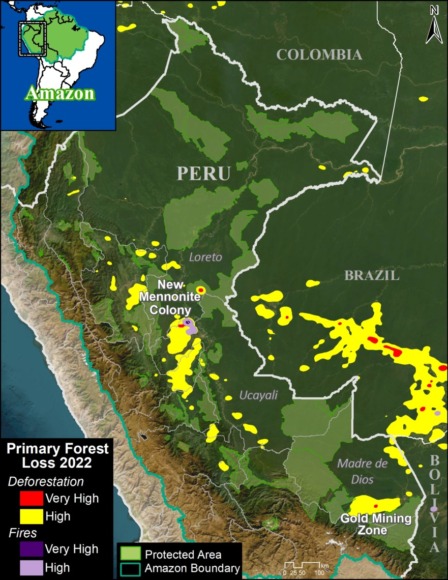
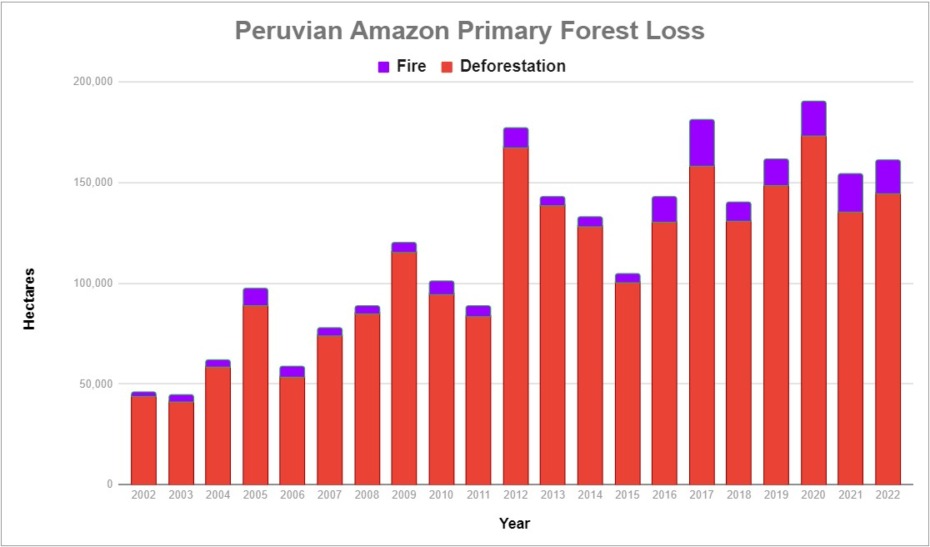
In 2022, the Peruvian Amazon lost 144,682 hectares of primary forest to deforestation. Fires directly impacted an additional 16,408 hectares.

Deforestation increased 6.7% from 2021, and was the 5th highest on record. Fire impact decreased from last year, but was still relatively high.

The deforestation was concentrated in the central and southern Amazon (Ucayali and Madre de Dios regions, respectively) (see Peru Base Map).

In the central Amazon, we highlight the rapid deforestation for a new Mennonite colony (see MAAP #166).

In the southern Amazon, gold mining deforestation continues to be an issue in indigenous communities and within the official Mining Corridor.


Colombian Amazon

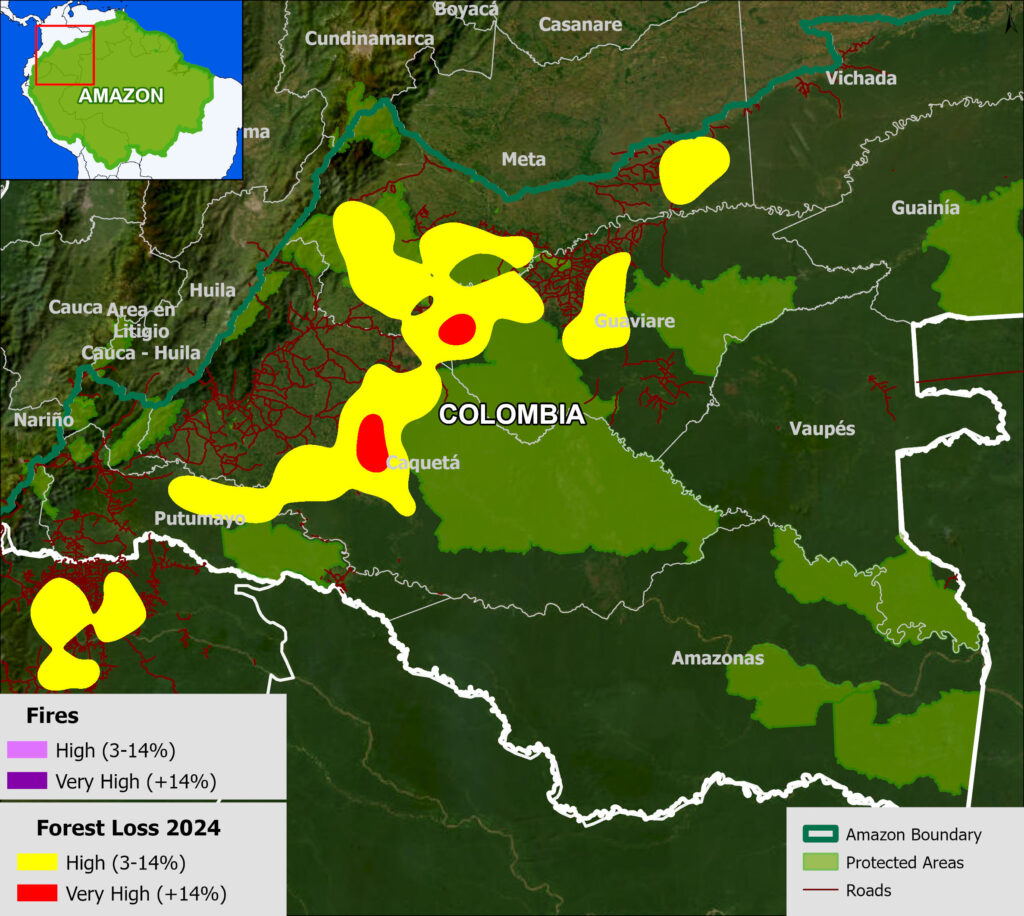
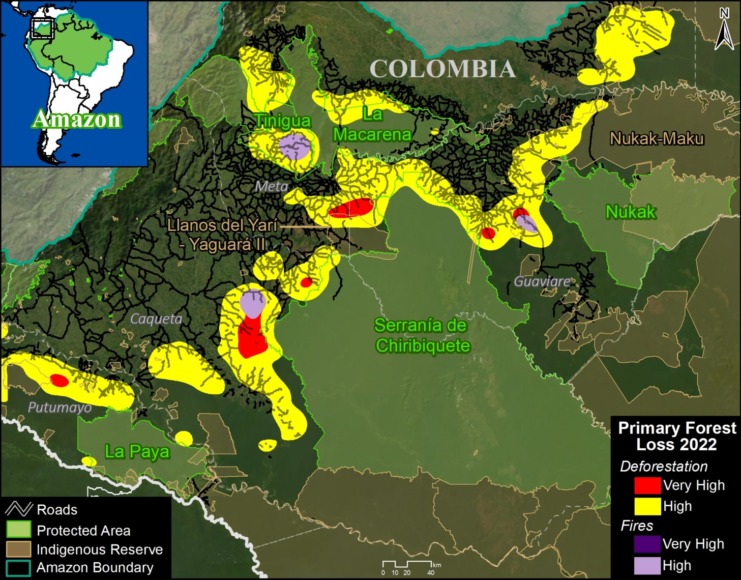
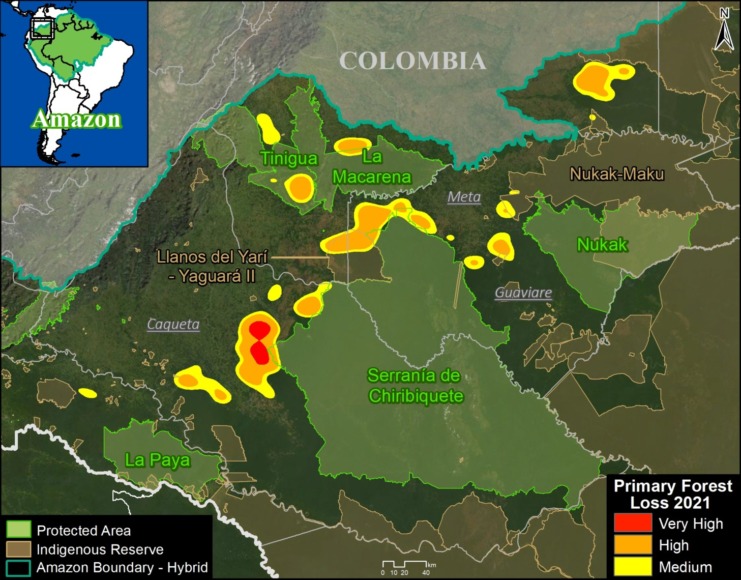
Colombia Base Map, 2022. Deforestation and fire hotspots in northwest Colombian Amazon. Data: UMD/GLAD, ACA/MAAP, FCDS.

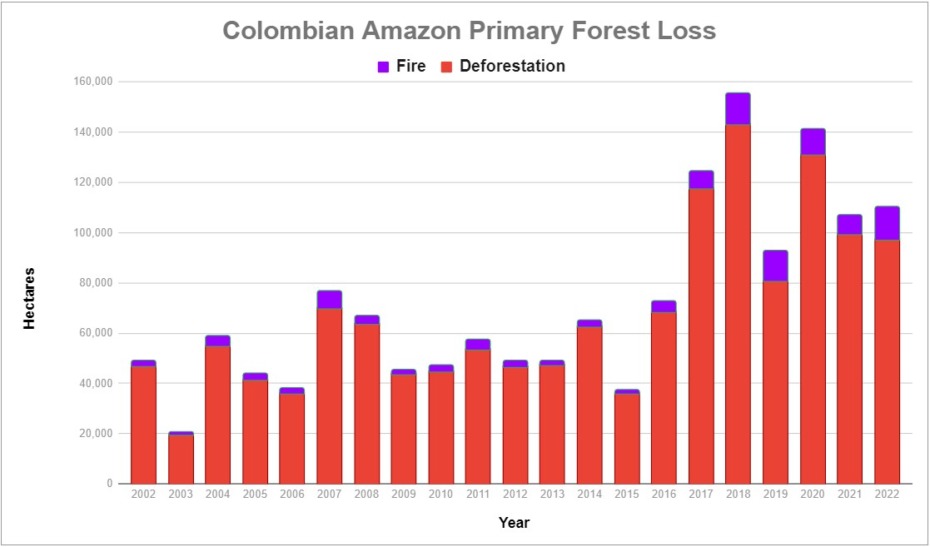
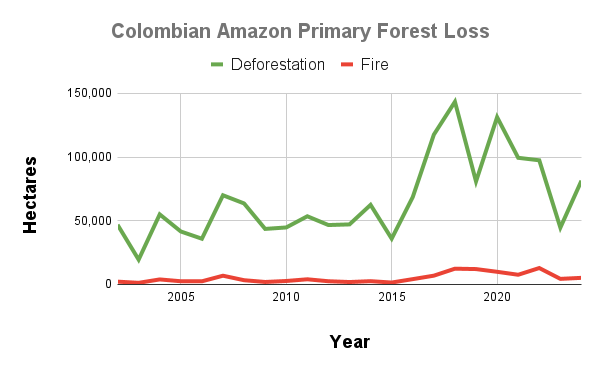
In 2022, the Colombian Amazon lost 97,417 hectares of primary forest to deforestation. Fires directly impacted an additional 12,880 hectares.

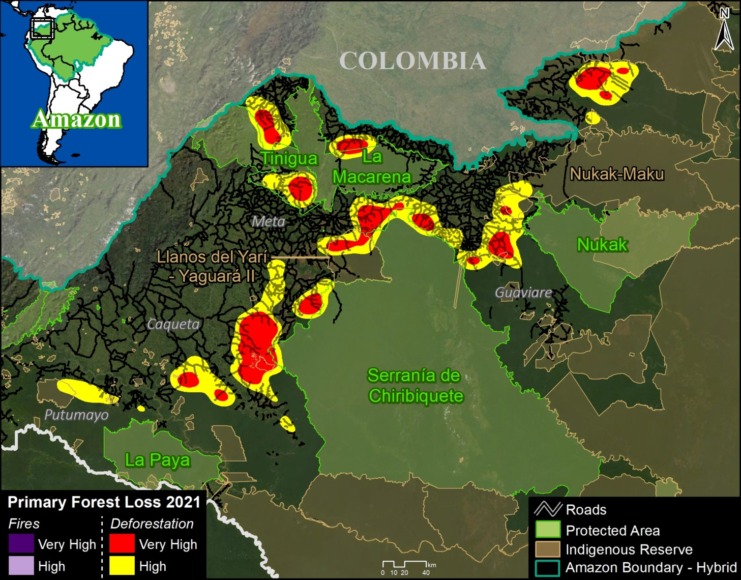
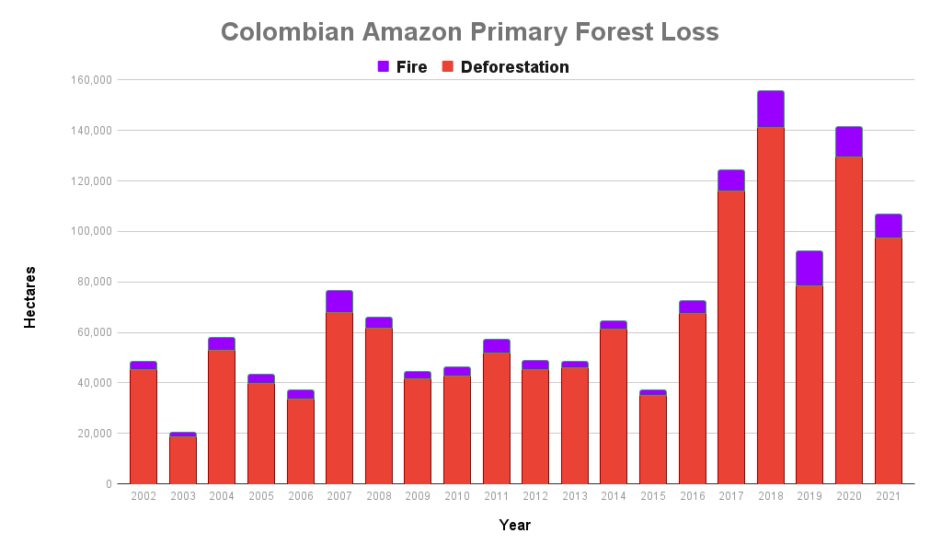
Deforestation decreased 2% from 2021, but it was still relatively high (5th highest on record), continuing the trend of elevated forest loss since the FARC peace agreement in 2016.

Fire impact increased from last year and was actually the highest on record, edging out 2018 and 2019.

As described in previous reports (see MAAP #120), the Colombia Base Map shows there continues to be an “arc of deforestation” in the northwest Colombian Amazon (Caqueta, Meta, and Guaviare departments).

This arc impacts numerous Protected Areas (particularly Tinigua and Chiribiquete National Parks) and Indigenous Reserves (particularly Yari-Yaguara II and Nukak Maku).


Ecuadorian Amazon

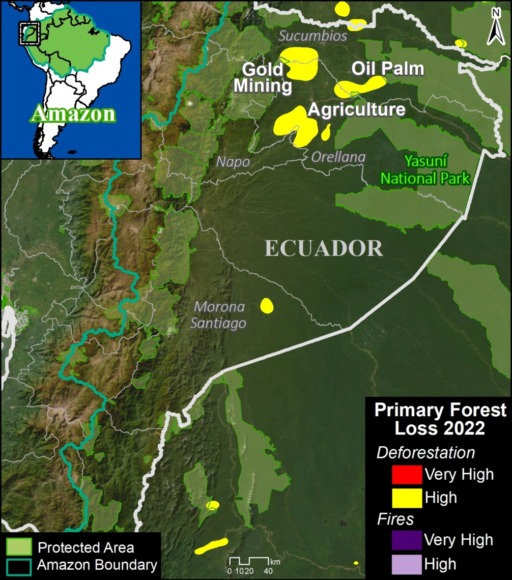
Ecuador Base Map, 2022. Deforestation and fire hotspots in the Ecuadorian Amazon. Data: UMD/GLAD, ACA/MAAP.

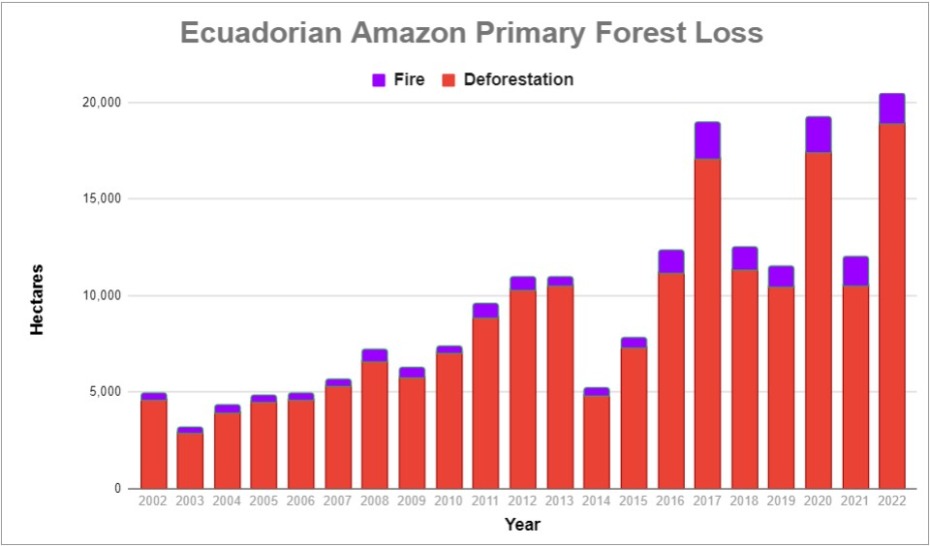
Although accounting for just 1% of total loss across the Amazon, deforestation in the Ecuadorian Amazon was the highest on record in 2022 (18,902 hectares), up a striking 80% since 2021.

There are several deforestation hotspots caused by gold mining (see MAAP #182), oil palm plantation expansion, and small-scale agriculture.


Venezuelan Amazon

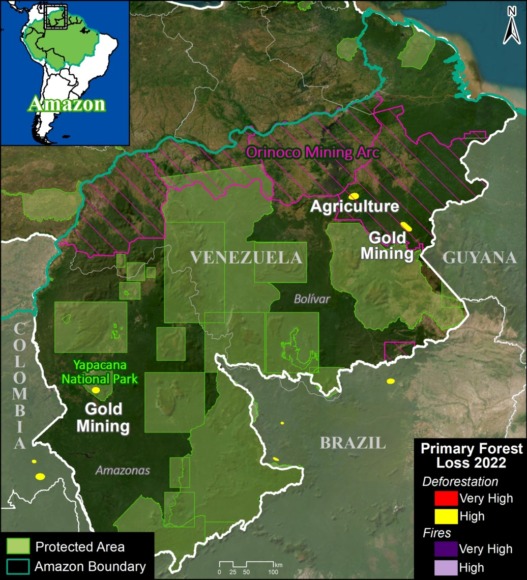
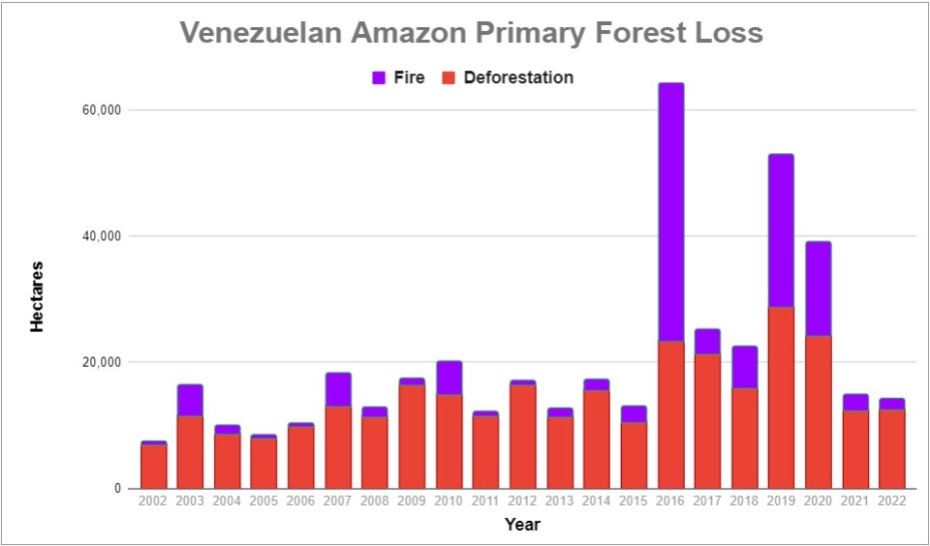
In the Venezuelan Amazon, deforestation was on par with last year (12,584 hectares).

There is a deforestation hotspot caused by gold mining in Yapacana National Park (see MAAP #173, MAAP #156, MAAP #169).

There are also hotspots in the Orinoco Mining Arc caused by mining and agriculture.


Methodology

The analysis was based on 30-meter resolution annual forest loss data produced by the University of Maryland and also presented by Global Forest Watch.

This data was complemented with the Global Forest Loss due to fire dataset that is unique in terms of being consistent across the Amazon (in contrast to country specific estimates) and distinguishes forest loss caused directly by fire (note that virtually all Amazon fires are human-caused). The values included were ‘medium’ and ‘high’ confidence levels (code 3-4).

The remaining forest loss serves as a likely close proxy for deforestation, with the only remaining exception being natural events such as landslides, wind storms, and meandering rivers. The values used to estimate this category was ‘low’ certainty of forest loss due to fire (code 2), and forest loss due to other ‘non-fire’ drivers (code 1).

For the baseline, it was defined to establish areas with >30% tree canopy density in 2000. Importantly, we applied a filter to calculate only primary forest loss by intersecting the forest cover loss data with the additional dataset “primary humid tropical forests” as of 2001 (Turubanova et al 2018). For more details on this part of the methodology, see the Technical Blog from Global Forest Watch (Goldman and Weisse 2019).

Our geographic range for the Amazon is a hybrid designed for maximum inclusion: biogeographic boundary (as defined by RAISG) for all countries, except for Bolivia and Peru, where we use the watershed boundary, and Brazil, where we use the Legal Amazon boundary.

To identify the deforestation hotspots, we conducted a kernel density estimate. This type of analysis calculates the magnitude per unit area of a particular phenomenon, in this case, forest cover loss. We conducted this analysis using the Kernel Density tool from the Spatial Analyst Tool Box of ArcGIS. We used the following parameters:

Search Radius: 15000 layer units (meters)
Kernel Density Function: Quartic kernel function
Cell Size in the map: 200 x 200 meters (4 hectares)
Everything else was left to the default setting.

For the Base Map, we used the following concentration percentages: High: 3-14%; Very High: >14%.

Acknowledgements

We thank colleagues at Global Forest Watch (GFW), an initiative of the World Resources Institute (WRI) for comments and access to data.

This work was supported by Norad (Norwegian Agency for Development Cooperation) and ICFC (International Conservation Fund of Canada).

Citation

Finer M, Mamani N (2023) Amazon Deforestation & Fire Hotspots 2022. MAAP: 187

MAAP #183: Protected Areas & Indigenous Territories Effective Against Deforestation Across Amazon

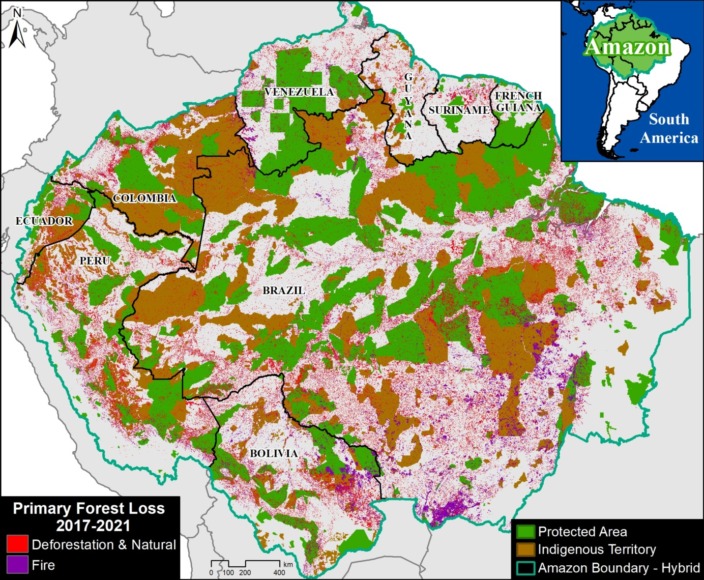
Base Map. Primary forest loss (2017-21) across the Amazon, in relation to protected areas and indigenous territories.

As deforestation continues to threaten primary forest across the Amazon, key land use designations are one of the best hopes for the long-term conservation of critical remaining intact forests.

Here, we evaluate the impact of two of the most important: protected areas & indigenous territories.

Our study looked across all nine countries of the Amazon biome, a vast area of 883.7 million hectares (see Base Map).

We calculated primary forest loss over the past 5 years (2017-2021).

For the first time, we were able to distinguish fire vs non-fire forest loss. For non-fire, while this does include natural events (such as landslides and wind storms), we consider this our best proxy for human-caused deforestation.

We analyzed the results across three major land use categories:

1) Protected Areas (national and state/department levels), which cover 197 million hectares (23.6% of Amazon).

2) Indigenous Territories (official), which cover 163.8 million hectares (19.6% of Amazon).

3) Other (all remaining areas outside protected areas and indigenous territories), which cover 473 million hectares (56.7% of Amazon).

In summary, we found that deforestation was the primary driver of forest loss, with fire always being a smaller subset. Averaged across all 5 years, protected areas and indigenous territories had similar levels of effectiveness, reducing primary forest loss rate by 3x compared to areas outside of these designations.

Below, we show the key results across the Amazon in greater detail, including a breakdown for the western Amazon (Bolivia, Colombia, Ecuador, and Peru) and the Brazilian Amazon.

Key Findings

Amazon Biome

We documented the loss of 11 million hectares of primary forests across all nine countries of the Amazon biome between 2017 and 2021. Of this total, 71% was non-fire (deforestation and natural) and 29% was fire.

For the major land use categories, 11% of the forest loss occurred in both protected areas and indigenous territories, respectively, while the remaining 78% occurred outside these designations.

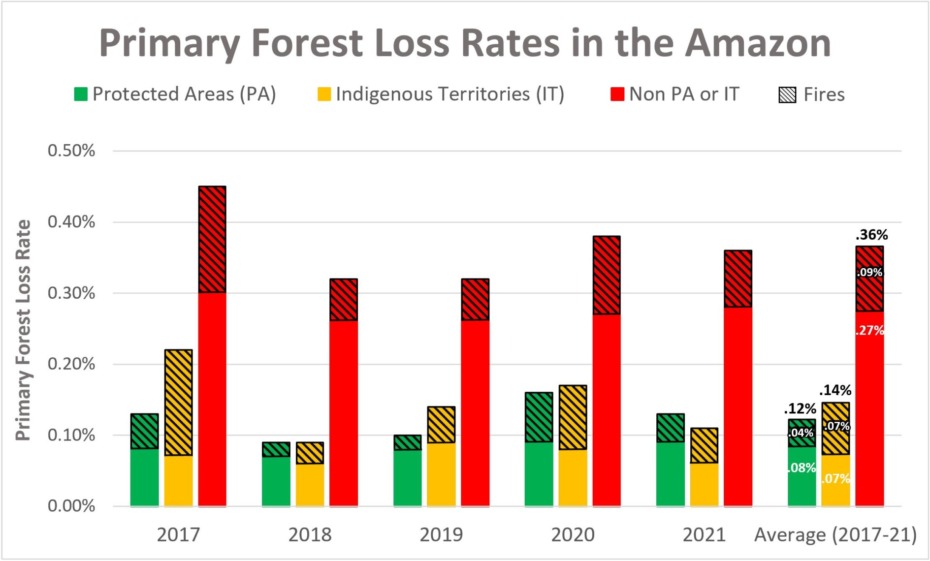
To standardize these results for the varying area coverages, we calculated annual primary forest loss rates (loss/total area of each category). Figure 1 displays the results for these rates across all nine countries of the Amazon biome.

Figure 1. Primary forest loss rates across the Amazon, 2017-21.

Broken down by year, 2017 had the highest forest loss rates, with both a severe deforestation and fire season. In addition, 2021 had the second highest deforestation rate, while 2020 had the second highest fire loss rate.

Averaged across all five years, protected areas (green) had the lowest overall primary forest loss rate (0.12%), closely followed by indigenous territories (0.14%).

Interestingly, indigenous territories (orange) actually had a slightly lower deforestation rate compared to protected areas (0.7 vs 0.8%), but higher fire loss rate (o.7 vs .04%), resulting in the overall higher forest loss rate noted above.

Outside of these designations (red), the primary forest loss rate was triple (.36%), especially due to much higher deforestation.

Western Amazon

Breaking the results down specifically for the western Amazon (Bolivia, Colombia, Ecuador, and Peru), we documented the loss of 2.6 million hectares of primary forests between 2017 and 2021. Of this total, 80% was non-fire (deforestation and natural) and 20% was fire.

For the major land use categories, 9.6% occurred in protected areas, 15.6% in indigenous territories, and the remaining 74.8% occurred outside these designations.

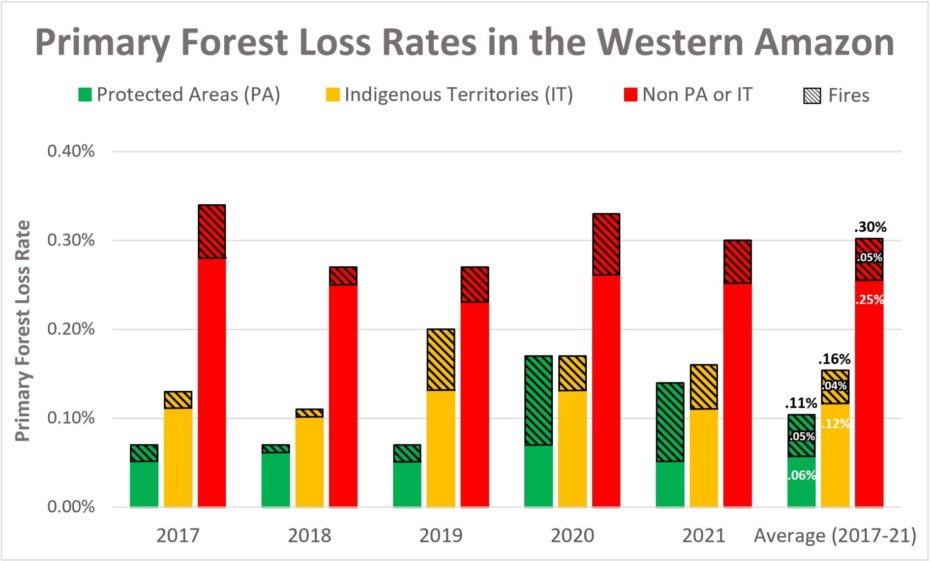
Figure 2 displays the standardized primary forest loss rates across the western Amazon.

Figure 2. Primary forest loss rates across the Western Amazon, 2017-21.

Broken down by year, 2017 had the highest deforestation rate and overall forest loss rates. But 2020 had the highest fire loss rate, mainly due to extensive fires in Bolivia. 2021 also had a relatively high deforestation rate. Also, note the high level of fires in protected areas in 2020 and 2021, and indigenous territories in 2019.
Averaged across all five years, protected areas had the lowest overall primary forest loss rate (0.11%), followed by indigenous territories (0.16%).
Outside of these designations, the primary forest loss rate was .30%. That is, triple the protected areas rate and double the indigenous territories rate.

Brazilian Amazon

Breaking the results down specifically for the Brazilian Amazon, we documented the loss of 8.1 million hectares of primary forests between 2017 and 2021. Of this total, 68% was non-fire (deforestation and natural) and 32% was fire.

For the major land use categories, 9.4% occurred in indigenous territories, 11.2% occurred in protected areas, and the remaining 79.4% occurred outside these designations.

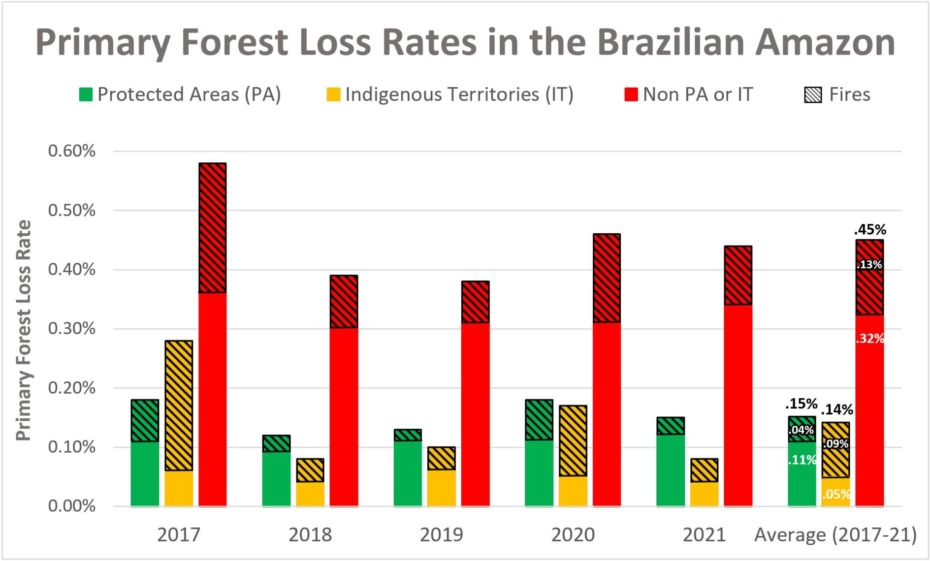
Figure 3 displays the standardized primary forest loss rates across the Brazilian Amazon.

Figure 3. Primary forest loss rates in the Brazilian Amazon, 2017-21.

Broken down by year, 2017 had the highest forest loss rate recorded in the entire study (.58%), due to both elevated deforestation and fire. Note that indigenous territories were particularly impacted by fire in 2017.

2020 had the next highest forest loss rate, also driven by an intense fire season. Fires were not as severe the following year in 2021, but deforestation increased.

Averaged across all five years, indigenous territories had the lowest overall primary forest loss rate (0.14%), closely followed by protected areas (0.15%).

Interestingly, indigenous territories had a lower deforestation rate compared to protected areas (0.5 vs 0.11%), but higher fire impact (0.09 vs 0.04%).

Outside of these designations (red), the primary forest loss rate was triple (.45%).

Methodology

To estimate deforestation across all three categories (protected areas, indigenous territories, and other), we used annual forest loss data (2017-21) from the University of Maryland (Global Land Analysis and Discovery GLAD laboratory) to have a consistent source across all countries (Hansen et al 2013).

We obtained this data, which has a 30-meter spatial resolution, from the “Global Forest Loss due to Fires 2000–2021” data download page. It is also possible to visualize and interact with the data on the main Global Forest Change portal.

The annual data is disaggregated into forest loss due to fire vs. non-fire (other disturbance drivers). It is important to note that the non-fire drivers include both human-caused deforestation and forest loss caused by natural forces (landslides, wind storms, etc.).

We also filtered this data for only primary forest loss, following the established methodology of Global Forest Watch. Primary forest is generally defined as intact forest that has not been previously cleared (as opposed to previously cleared secondary forest, for example). We applied this filter by intersecting the forest cover loss data with the additional dataset “primary humid tropical forests” as of 2001 (Turubanova et al 2018). Thus, we often use the term “primary forest loss” to describe this filtered data.

Data presented as primary forest loss rate is standardized per the total area covered of each respective category per year (annual). For example, to properly compare raw forest loss data in areas that are 100 hectares vs 1,000 hectares total size respectively, we divide by the area to standardize the result.

Our geographic range extends from the Andes to the Amazon plain and reaching the transitions with the Cerrado and the Pantanal. This range includes nine countries of the Amazon (or Pan-Amazon region as defined by RAISG) and consists of a combination of the Amazon watershed limit, the Amazon biogeographic limit and the Legal Amazon limit in Brazil. See Base Map above for delineation of this hybrid Amazon limit, designed for maximum inclusion.

Additional data sources include:

  • National and state/department level protected areas: RUNAP 2020 (Colombia), SNAP 2022 (Ecuador), SERNAP & ACEAA 2020 (Bolivia), SERNANP 2022 (Peru), INPE/Terrabrasilis 2022 (Brazil), SOS Orinoco 2021 (Venezuela), and RAISG 2020 (Guyana, Suriname, and French Guiana.)
  • Indigenous Territories: RAISG & Ecociencia 2022 (Ecuador), INPE/Terrabrasilis 2022 (Brazil), RAISG 2020 (Colombia, Bolivia, Venezuela, Guyana, Suriname, and French Guiana), and MINCU & ACCA 2021 (Peru). For Peru, this includes titled native communities and Indigenous/Territorial Reserves for indigenous groups in voluntary isolation.

For analysis, we categorized Protected Areas first, then Indigenous Territories to avoid overlapping areas. Each category was disaggregated by year created/recognized to match the annual report of forest loss, for example. If a Protected area was created in December 2018, it would be considered within the analysis for the year 2019.

Acknowledgements

This work was supported by the Andes Amazon Fund (AAF), Norwegian Agency for Development Cooperation (NORAD), and International Conservation Fund of Canada (ICFC).

We thank M. MacDowell and M. Cohen for helpful comments on this report.

Citation

Finer M, Mamani N (2023) Protected Areas & Indigenous Territories Effective Against Deforestation Across Amazon. MAAP: 176.

MAAP #161: Soy Deforestation in the Brazilian Amazon

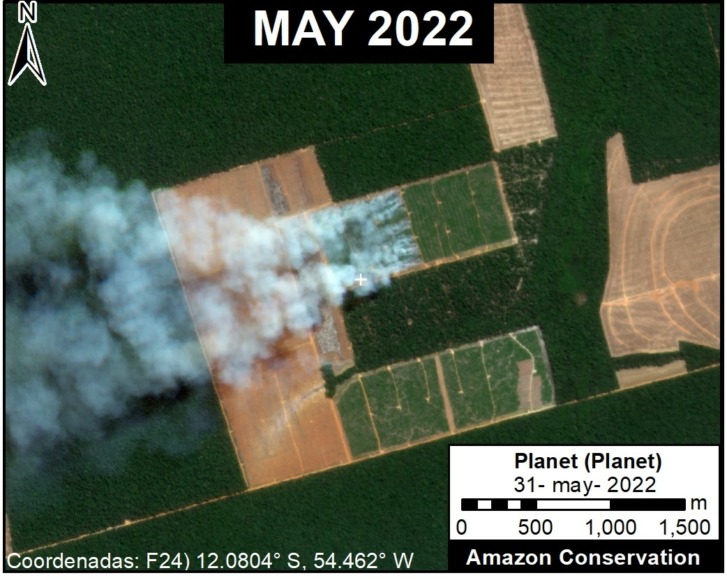
Example of fires burning an area recently deforested for a new soy plantation. Data: Planet.

The Amazon Soy Moratorium has often been credited with significantly reducing soy-related deforestation in the Amazon over the past 15 years.

The Moratorium is a voluntary zero-deforestation agreement in which traders agree not to purchase soy grown on land cleared after 2008.

However, increasing soybean prices may be driving a resurgence of the problem of direct soy deforestation. That is, direct conversion of primary deforestation to soy plantation without passing an initial period as cattle pasture.

A recent report by Global Forest Watch estimated the direct soy deforestation of 29,000 hectares in the Brazilian Amazon in 2019 (Schneider et al 2021).

Here, we report the additional direct soy deforestation of at least 42,000 hectares in the Brazilian Amazon since 2020. All of these areas occurred in the state of Mato Grosso, located on the southeast edge of the Amazon.

We detected all of these soy plantations based on recent major fire activity (84 major fires), in which the recently deforested area was burned in preparation for the upcoming planting season (see Methodology below for more details).

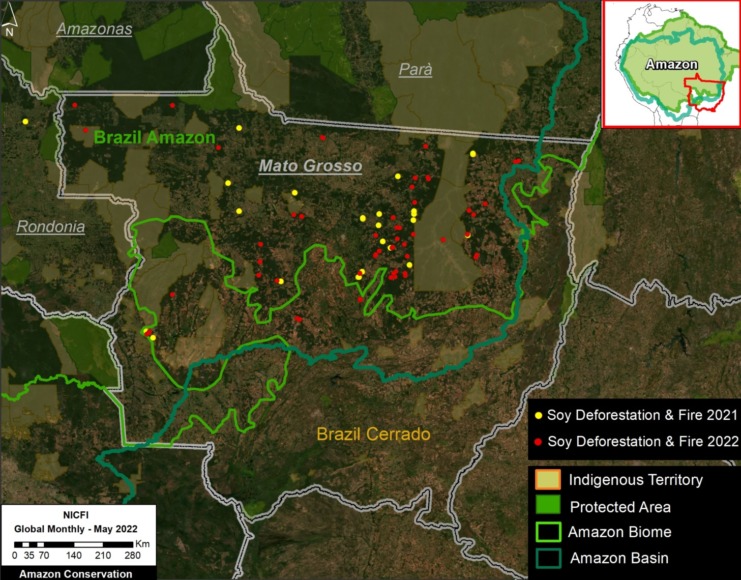
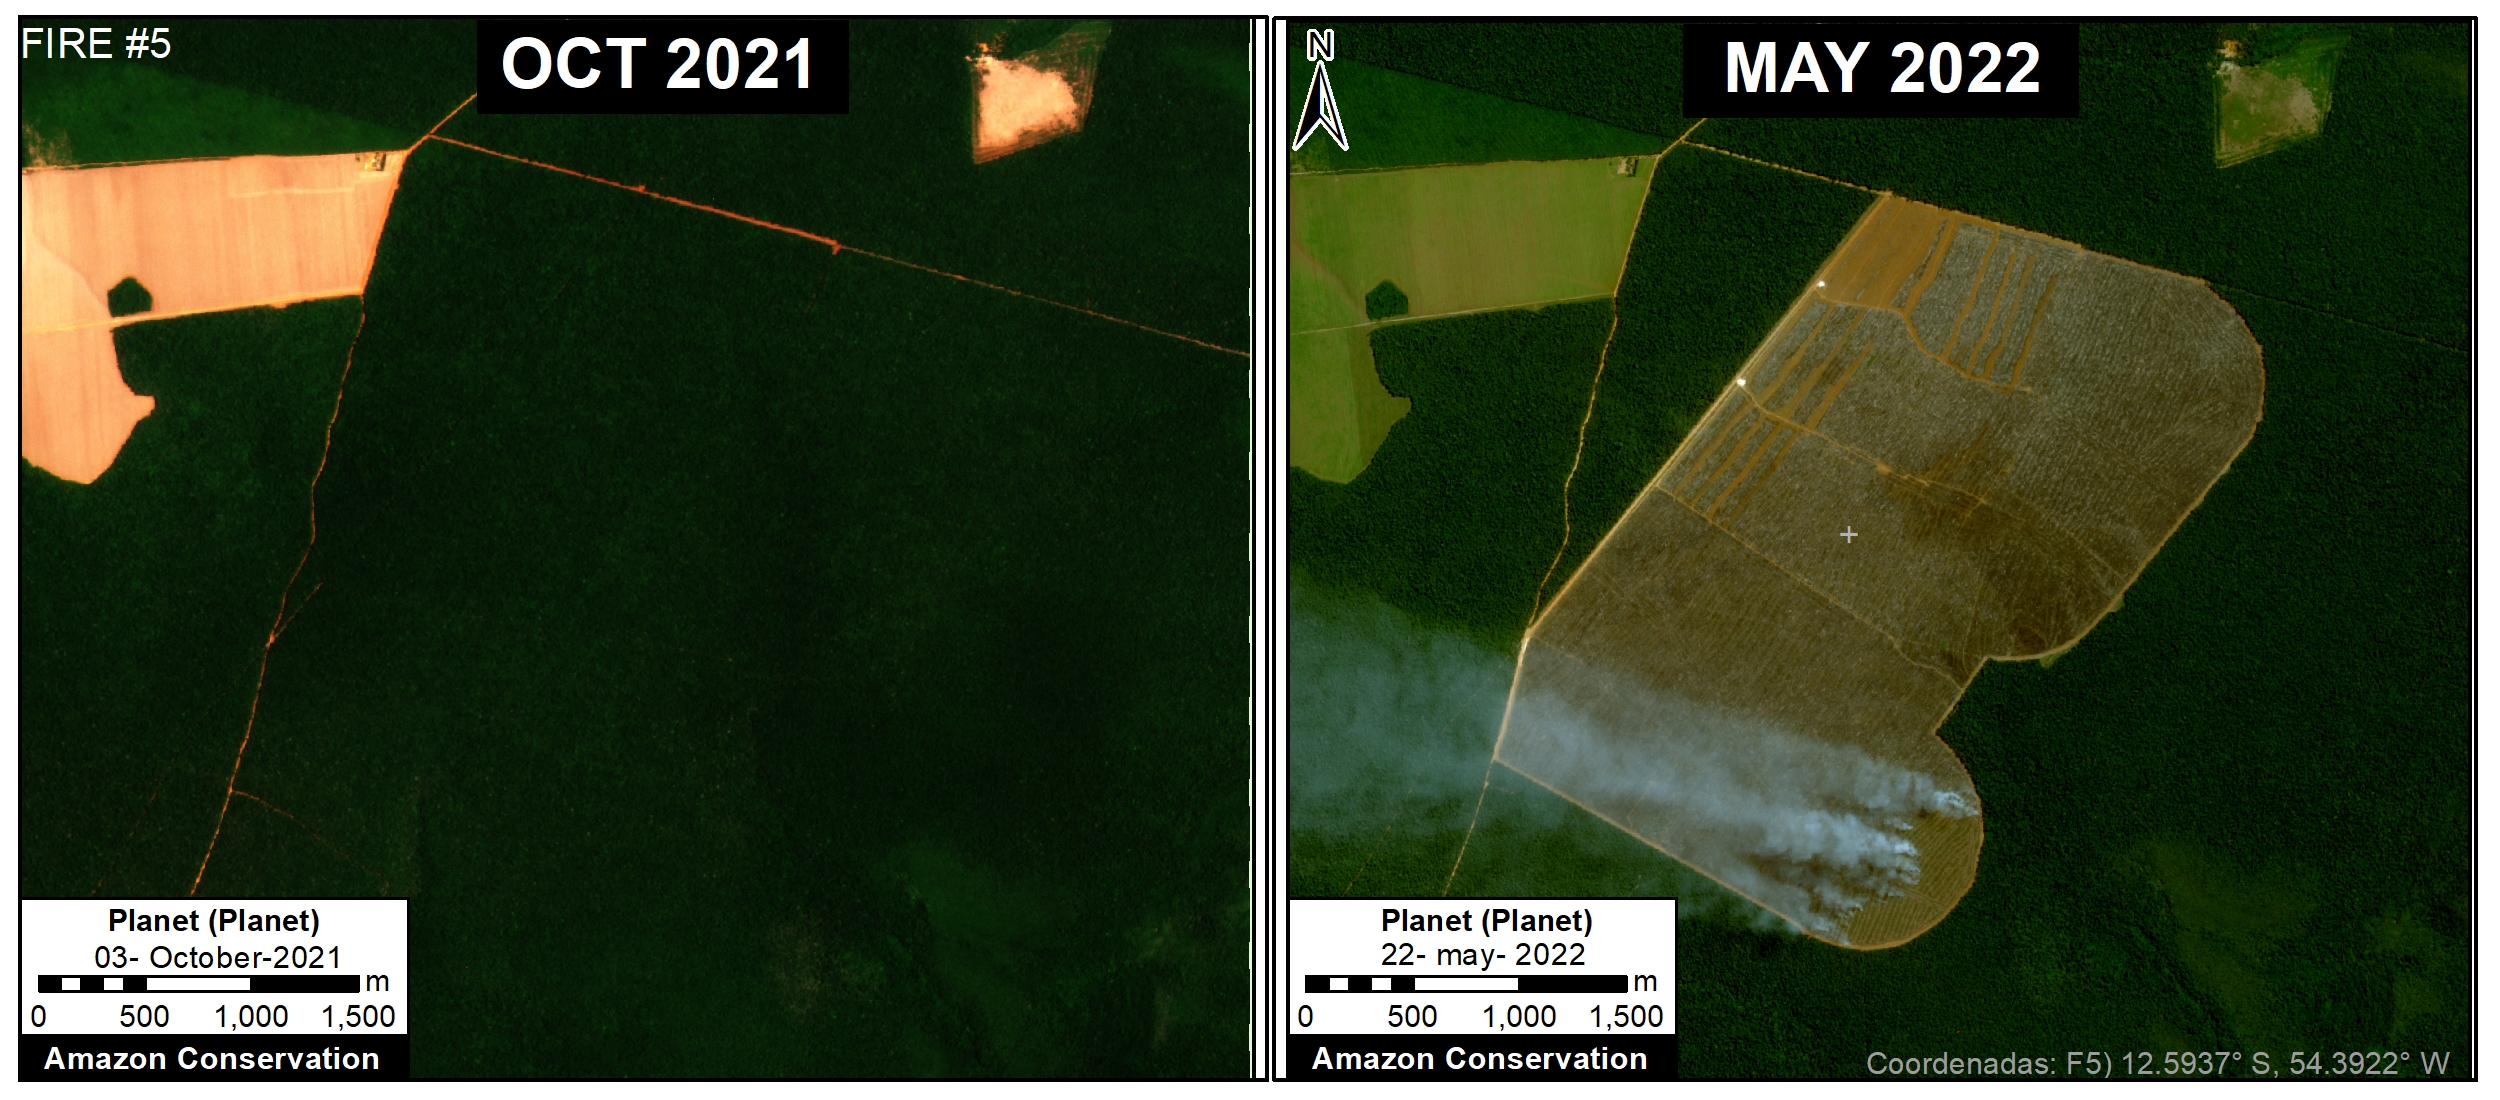
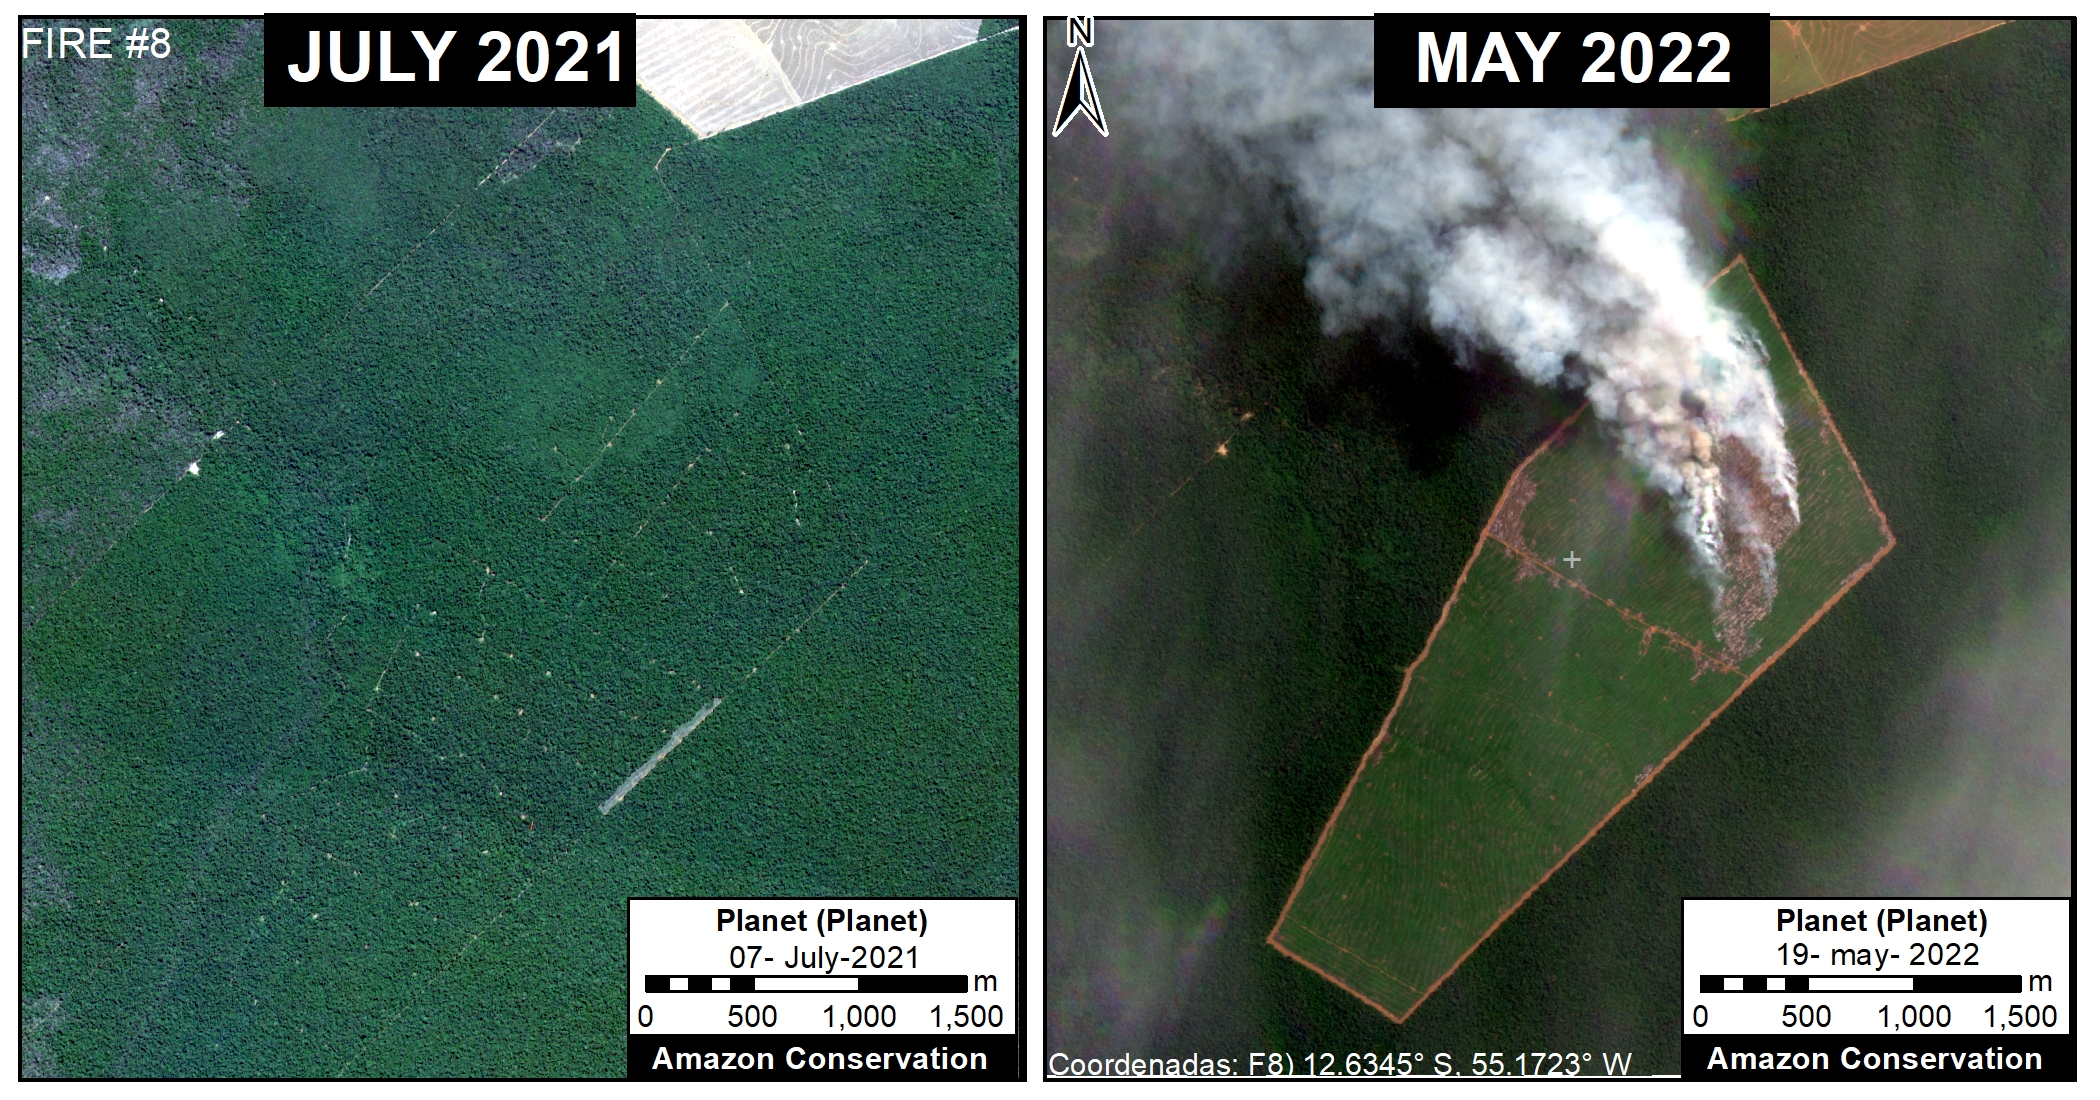
Below, we show a base map of these recently deforested and then burned areas in the Mato Grosso state of the Brazilian Amazon followed by a series of examples from the satellite imagery.

Base Map – Recent Soy Deforestation in Brazilian Amazon

The Base Map below shows the areas, indicated by red dots, of recent direct deforestation for new soy plantations that we detected by monitoring major fire activity in 2022.

Between May 2021 and June 2022, we detected 84 major fires that corresponded to burning areas recently deforested for new soy plantations. These 84 areas, all of which occurred in the state of Mato Grosso, cover an area of 42,000 hectares.

Our geographic focus was the Brazilian Amazon biome in the state of Mato Grosso, as covered by the Amazon Soy Moratorium. For example, we also documented extensive direct soy deforestation and fire in the Bolivian Amazon (Santa Cruz department), but we did not include that information here.

Base Map. Recent Soy Deforestation in Brazilian Amazon. Data: ACA/MAAP, NICFI.

Examples of Deforestation & Fire for New Soy Plantations

As noted above, we detected the direct deforestation for new soy plantations by monitoring major fire activity in 2022. It is assumed that fires are preparing the recently deforested area for upcoming soy planting.

Methodology

We first tracked major fires in 2021 and 2022 using our novel real-time fire monitoring app. See MAAP #118 for more background information about the app and general methodology for detecting major fires based on aerosol emissions. The first major fires were detected in May of each year (2021 and 2022) and we continued collecting data on a daily basis through early July of each year. We monitored fires across the entire Amazon, but this report focuses on Brazil.

For all major fires detected with the app, we confirmed them with high-resolution satellite imagery from Planet. This confirmation was accomplished by visualizing either smoke plumes the day of the fire or burned areas in subsequent days after the fire.

All confirmed fires were assigned a category based on likely direct fire type or driver. These categories include 1) burning area recently deforested for new soy plantation, burning area recently deforested for new cattle pasture, and burning grasslands embedded in the larger rainforest matrix. On rarer occasions, one of these fire types may escape into the surrounding forest, making it an actual forest fire.

Specifically, the soy-related fires were defined as those burning recently deforested areas (that is, areas cleared since 2020) that had a distinctive linear pattern seemingly designed for organized crop agriculture. Most of the newly identified soy areas were also adjacent to existing soy plantations. In other words, the soy deforestation and fire pattern were visually quite distinct from cattle-related and grassland fires. Local experts have informed us that the fires are likely prepping the recently deforested area for the upcoming soy planting season. For all determined direct soy-related fires, we estimated the burned area using the spatial measurement tools in Planet Explorer and entered it into a database. We noted that in July of both years, the fires shifted away from soy and more towards cattle areas.

References

Martina Schneider, Liz Goldman, Mikaela Weisse, Luiz Amaral and Luiz Calado (2021) The Commodity Report: Soy Production’s Impact on Forests in South America. Link: https://www.globalforestwatch.org/blog/commodities/soy-production-forests-south-america/

X.-P. Song, M.C. Hansen, P. Potapov, et al (2021). Massive soybean expansion in South America since 2000 and implications for conservation. Nature Sustainability. Link: https://www.nature.com/articles/s41893-021-00729-z

Acknowledgements

We thank V. Silgueiro and R. Carvalho from the organization Instituto Centro de Vida (ICV) for helpful information and comments related to this report.

Citation

Finer M, Ariñez A (2022) Soy Deforestation in the Brazilian Amazon. MAAP: #161.

MAAP #158: Amazon Deforestation & Fire Hotspots 2021

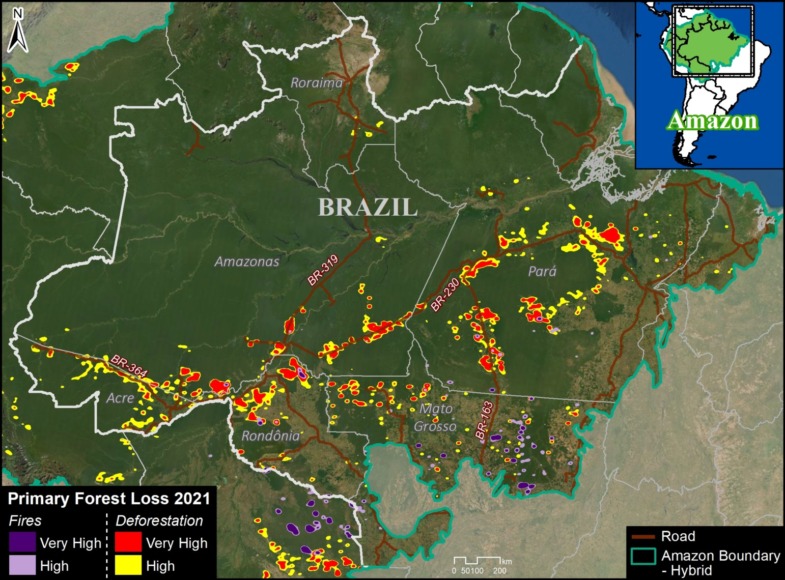
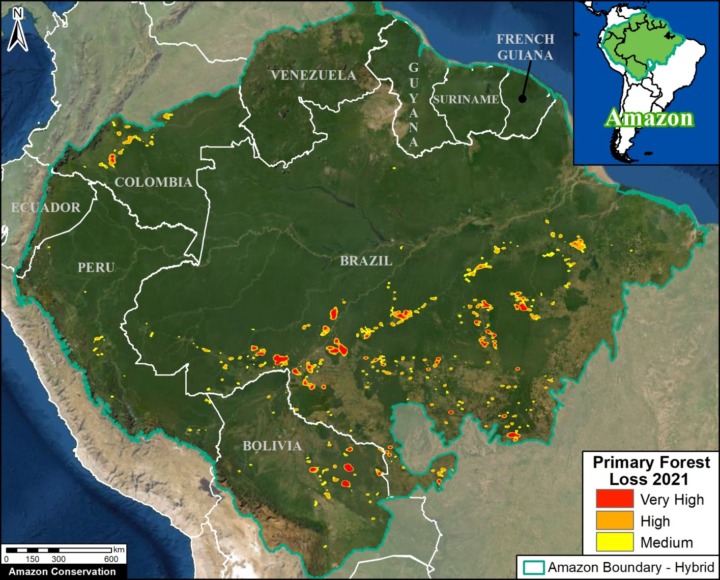
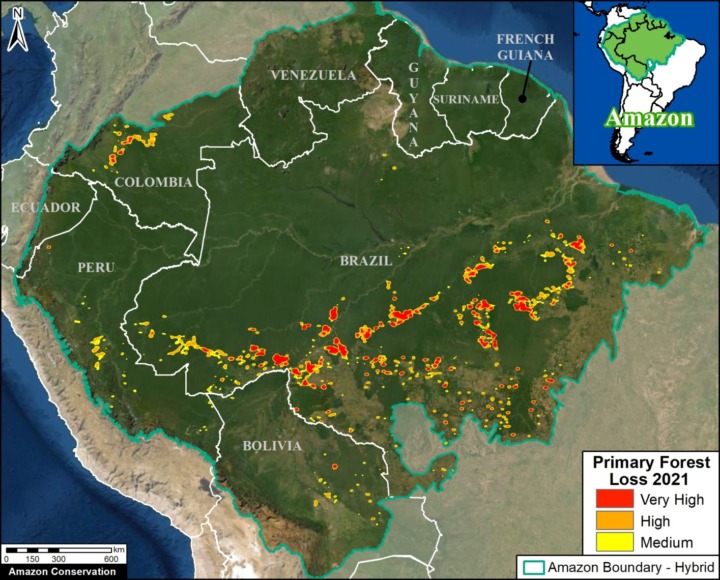
2021 Amazon Forest Loss Base Map. Deforestation and fire hotspots across the full Amazon biome. Data: UMD/GLAD, ACA/MAAP.

We present a detailed look at the major 2021 Amazon forest loss hotspots, based on the final annual data produced by the University of Maryland.

This dataset is unique in that distinguishes forest loss from fire, leaving the rest as a close proxy for deforestation.

Thus, for the first time, the results include both deforestation and fire hotspots across the Amazon.

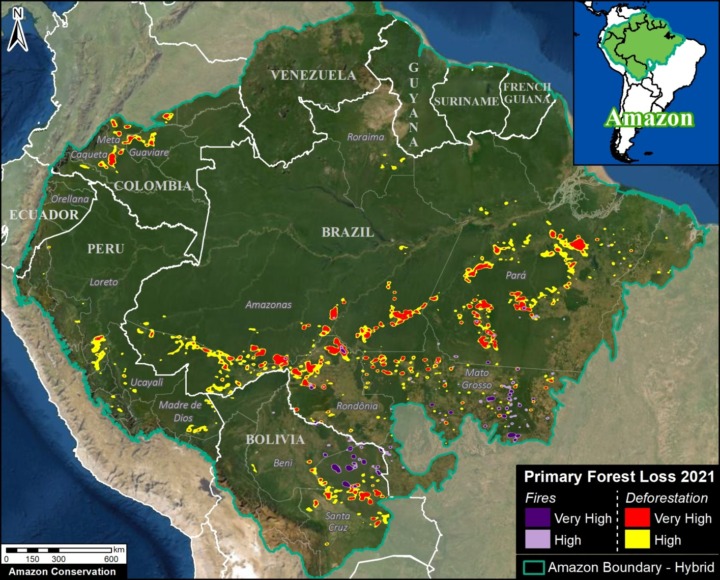
The Base Map (see right) and Results Graph (see below) reveal several key findings:p

  • In 2021, we estimate the loss of 2 million hectares (4.9 million acres) of primary forest loss across the nine countries of the Amazon biome. This total represents a slight decrease from 2020, but the 6th highest on record.
    l
  • The vast majority of this loss was deforestation (78%), accounting for 1.57 million hectares. This total represents a slight increase from 2020, and the 5th highest on record. This deforestation impacted the entire stretch of the southern Amazon (southern Brazil, Bolivia, and Peru) plus further north in Colombia.
    l
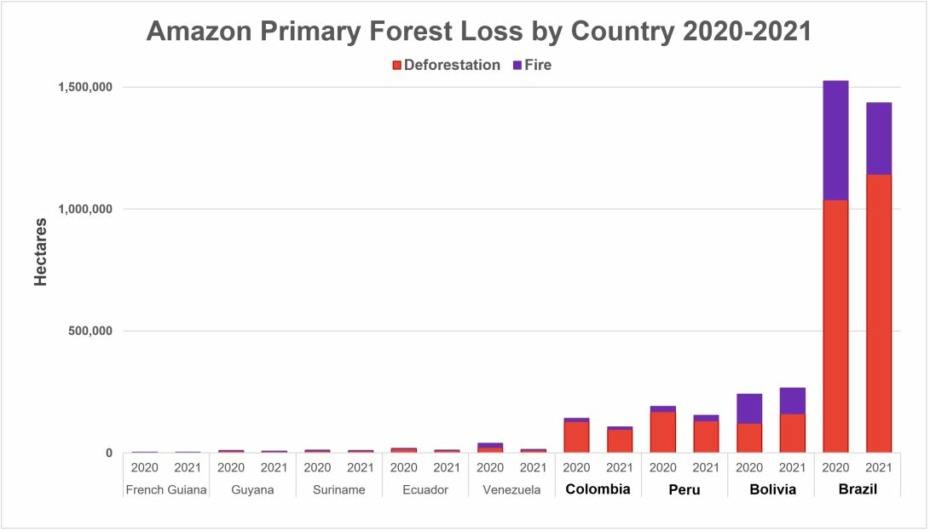
  • This deforestation was concentrated in Brazil (73%), Bolivia (10%), Peru (8%), and Colombia (6%). In Brazil and Bolivia, deforestation was the highest since 2017. In Peru and Colombia, deforestation dropped from 2020 but was still historically high. See below for maps and graphs for each country. See Annex for 2020-21 details.
    k
  • Fires directly caused the remaining primary forest loss (22%), accounting for 436,000 hectares. This total represents a decrease from the severe fire season of 2020, but was the 4th highest on record. Moreover, each of the six most intense fire seasons has occurred in the past six years. Over 90% of the fire impact occurred in just two countries: Brazil and Bolivia. Note that fire impacts were concentrated in the southeast of each country (Mato Grosso and Santa Cruz states, respectively).
    k
  • Since 2002, we estimate the deforestation of over 27 million hectares (67 million acres) of primary forest, greater than the size of the United Kingdom or the U.S. state of Colorado. On top of this, we estimate an additional impact of 6.7 million hectares due to fires.

Below, we zoom in on the four countries with the highest deforestation (Brazil, Bolivia, Peru, and Colombia), with additional maps and analysis.

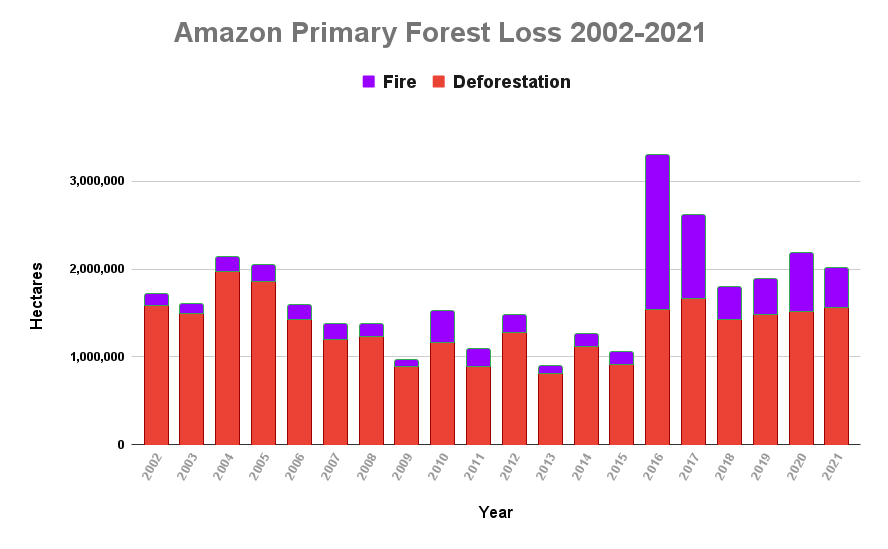
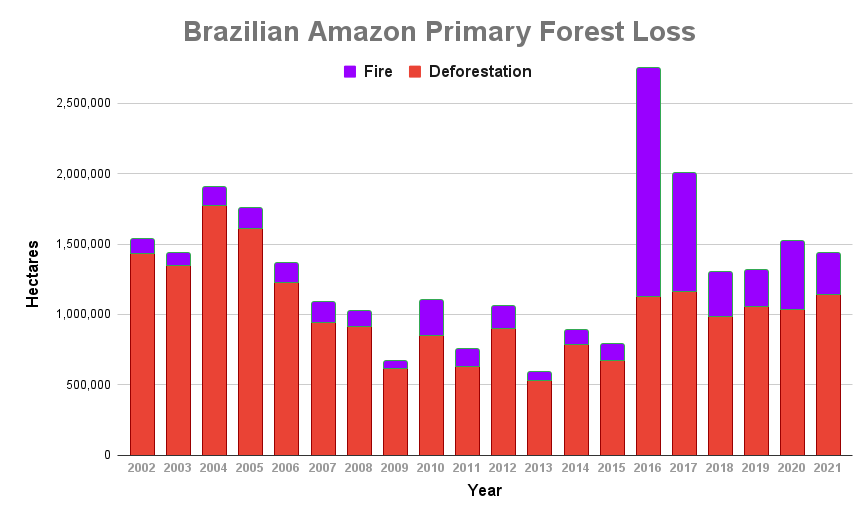
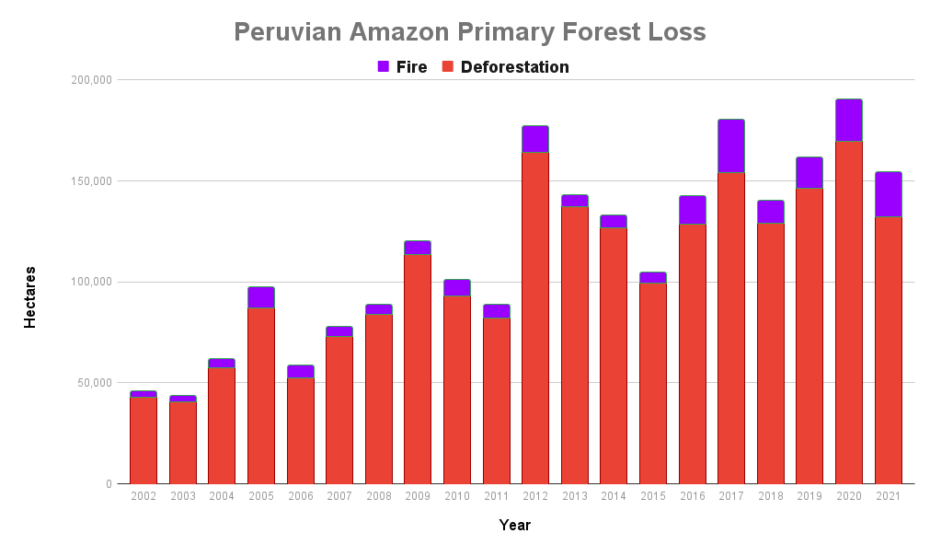
Amazon Forest Loss Results Graph, 2002-21. Data: UMD/GLAD, ACA/MAAP.

For deforestation, note that in 2021 there was a slight increase across the Amazon, continuing a gradual four-year trend. 2021 had the 5th highest deforestation on record (behind just 2002, 2004, 2005, and 2017).

For fire, in 2021 there was a decrease from the severe fire season of 2020, but was the 4th highest on record (behind just 2016, 2017, and 2020). Moreover, each of the last six years is in the top six worst fire seasons across the Amazon.

For total forest loss (deforestation and fire combined), in 2021 there was slight decrease from 2020, but the 6th highest on record.

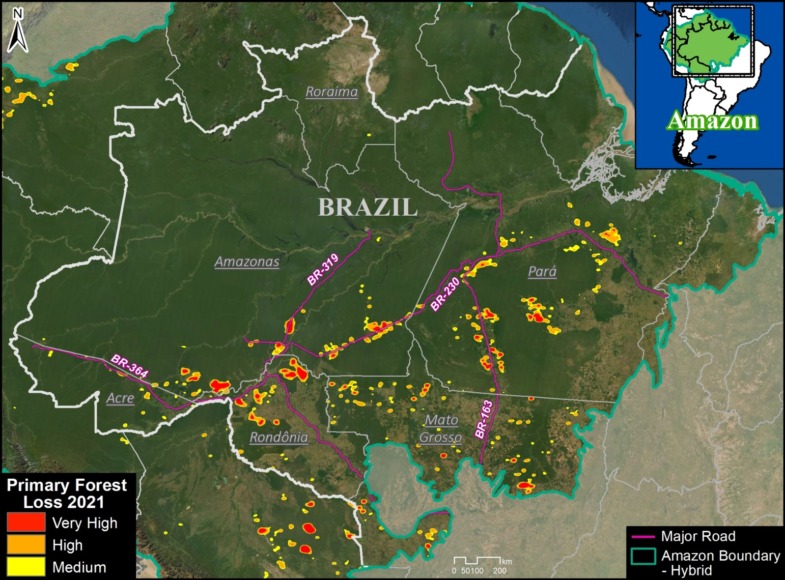
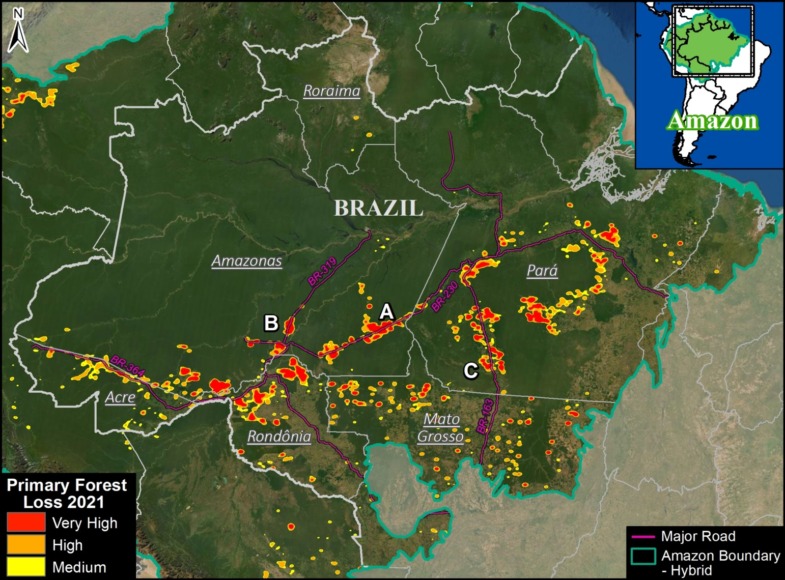
Brazil Base Map, 2021. Deforestation and fire hotspots in the Brazilian Amazon. Data: UMD/GLAD, ACA/MAAP.

Brazilian Amazon

In 2021, the Brazilian Amazon lost 1.1 million hectares of primary forest to deforestation. Fires directly impacted an additional 293,000 hectares.

The deforestation was the highest since 2017 and also the peak of the early 2000s (6th highest on record). The fire impact was relatively high (5th highest on record), but less than the peak years of 2016, 2017, and 2020.

The deforestation was concentrated along the major road networks, especially roads 163, 230, 319, and 364 in the states of Acre, Amazonas, Pará, and Rondônia (see Brazil Base Map).

The direct fire impacts were concentrated in the southeastern state of Mato Grosso.

It is also important to note that many areas experienced the one-two combination of initial deforestation followed by fire to prepare the area for agriculture or cattle.


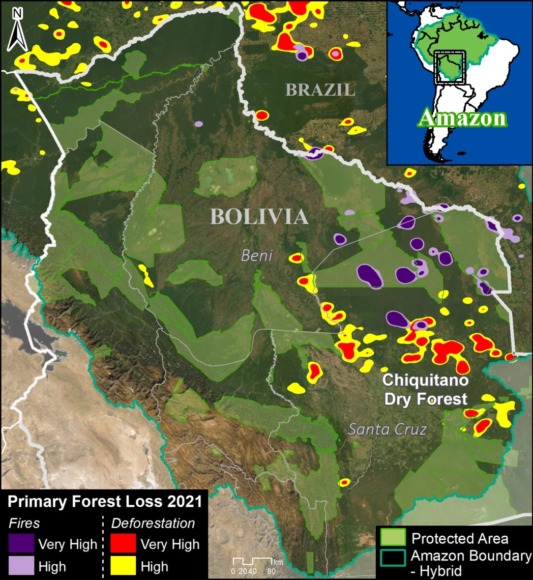
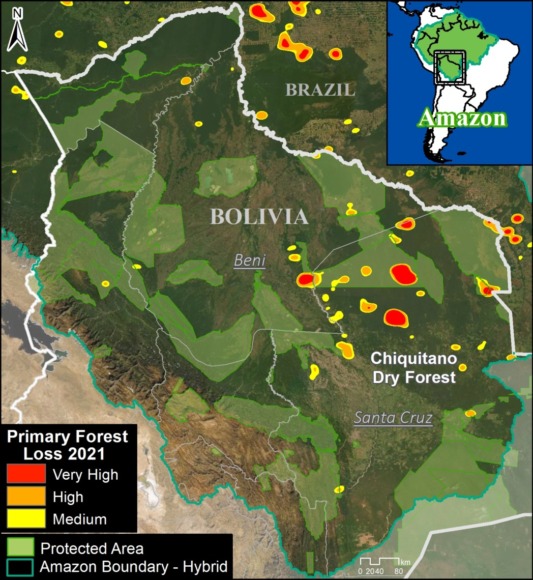
Bolivia Base Map. Deforestation hotspots in Bolivian Amazon. Data: UMD/GLAD, ACA/MAAP.

Bolivian Amazon

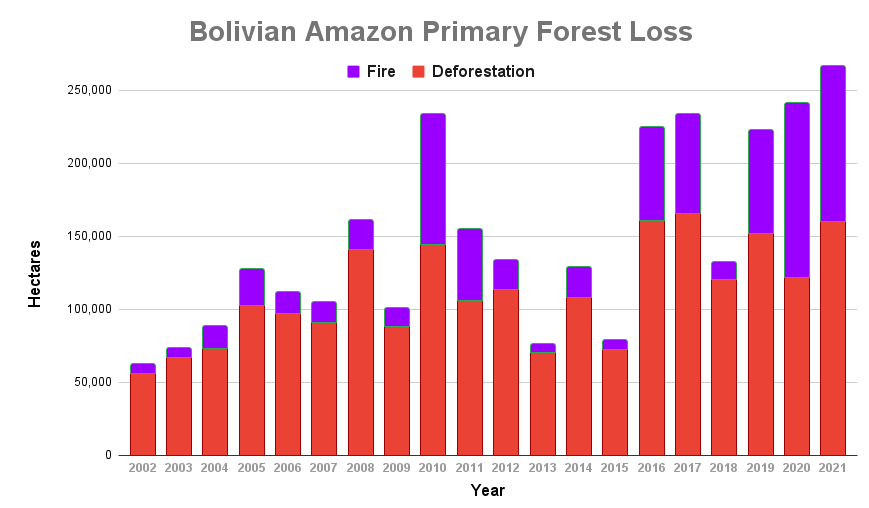
In 2021, the Bolivian Amazon lost 161,000 hectares of primary forest to deforestation. Fires directly impacted an additional 106,000 hectares.

Deforestation was the third-highest on record, just behind the peak in 2016 and 2017. The fire impact was the second-highest on record, behind just the intense year of 2020 (thus, the last two years are the two highest on record).

Both the deforestation and fires were concentrated in the southeastern department of Santa Cruz (see Bolivia Base Map).

Much of the deforestation was associated with large-scale agriculture, while the fires once again impacted important natural ecosystems, most notably the Chiquitano dry forests.


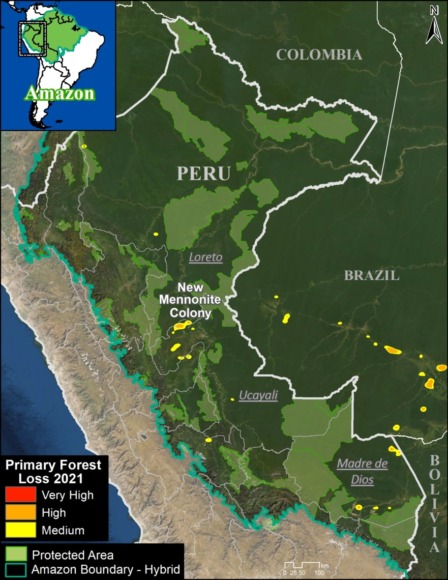
Peru Base Map. Deforestation hotspots in the Peruvian Amazon. Data: UMD/GLAD, ACA/MAAP.

Peruvian Amazon

In 2021, the Peruvian Amazon lost 132,400 hectares of primary forest to deforestation. Fires directly impacted an additional 21,800 hectares.

Deforestation dropped from a record high in 2020, but was 6th highest on record. Thre fire impact was the second-highest on record (behind just 2017).

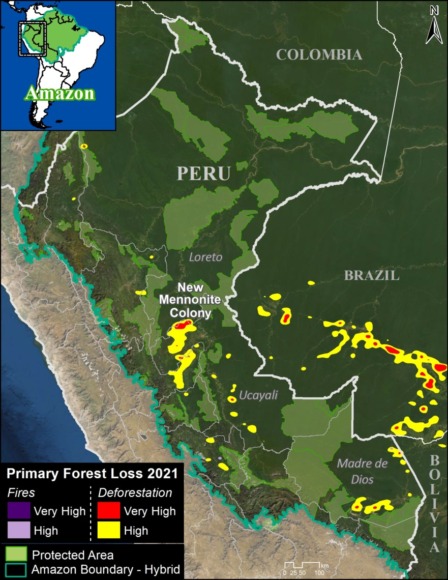
The deforestation was concentrated in the central and southern Amazon (Ucayali and Madre de Dios regions, respectively) (see Peru Base Map).

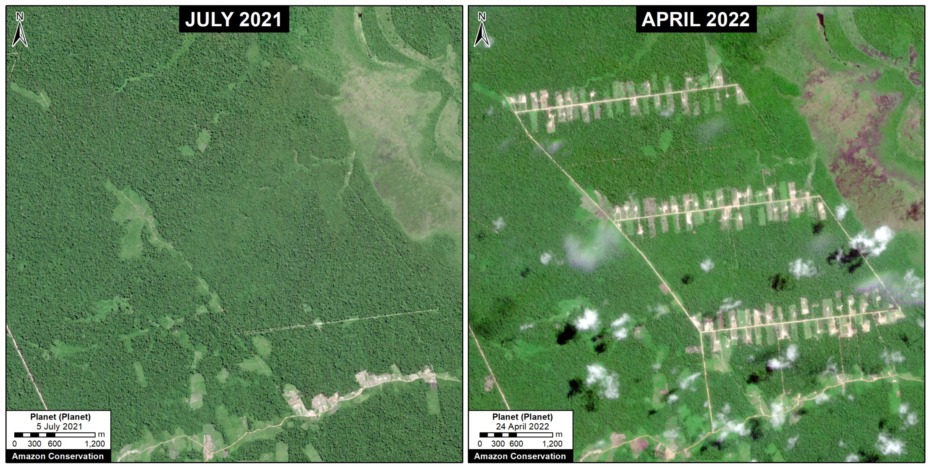
We highlight the rapid deforestation (365 hectares) for a new Mennonite colony in 2021, near the town of Padre Marquez (see MAAP #149).

Also, note some additional hotspots in the south (Madre de Dios region), but these are largely from expanding agriculture instead of the historical driver of gold mining.

Indeed, gold mining deforestation has been greatly reduced due to government actions, but this illegal activity still threatens several key areas and indigenous territories (MAAP #154).


Rapid deforestation (365 hectares) for a new Mennonite colony in 2021, near the town of Padre Marquez. Data: Planet.

Colombia Base Map. Deforestation hotspots in northwest Colombian Amazon. Data: UMD/GLAD, ACA/MAAP, FCDS.

Colombian Amazon

In 2021, the Colombian Amazon lost 98,000 hectares of primary forest to deforestation. Fires directly impacted an additional 9,000 hectares.

Deforestation and fire dropped from last year, but both were the fourth highest on record, following the trend of elevated forest loss and associated fires since the peace agreement in 2016.

As described in previous reports (see MAAP #120), the Colombia Base Map shows there continues to be an “arc of deforestation” in the northwest Colombian Amazon (Caqueta, Meta, and Guaviare departments).

This arc impacts numerous Protected Areas (particularly Tinigua and Chiribiquete National Parks) and Indigenous Reserves (particularly Yari-Yaguara II and Nukak Maku).

The main drivers of deforestation in the Colombian Amazon are land grabbing, expansion of road networks, and cattle ranching.


Annex

Notes and Methodology

The analysis was based on 30-meter resolution annual forest loss data produced by the University of Maryland and also presented by Global Forest Watch. For the first time, this data set distinguished forest loss caused directly by fire (note that virtually all Amazon fires are human-caused). The remaining forest loss serves as a likely close proxy for deforestation, with the only remaining exception being natural events such as landslides, wind storms, and meandering rivers.

Importantly, we applied a filter to calculate only primary forest loss by intersecting the forest cover loss data with the additional dataset “primary humid tropical forests” as of 2001 (Turubanova et al 2018). For more details on this part of the methodology, see the Technical Blog from Global Forest Watch (Goldman and Weisse 2019).

Our geographic range for the Amazon is a hybrid designed for maximum inclusion: biogeographic boundary (as defined by RAISG) for all countries, except for Bolivia where we use the watershed boundary.

To identify the deforestation hotspots, we conducted a kernel density estimate. This type of analysis calculates the magnitude per unit area of a particular phenomenon, in this case, forest cover loss. We conducted this analysis using the Kernel Density tool from the Spatial Analyst Tool Box of ArcGIS. We used the following parameters:

Search Radius: 15000 layer units (meters)
Kernel Density Function: Quartic kernel function
Cell Size in the map: 200 x 200 meters (4 hectares)
Everything else was left to the default setting.

For the Base Map, we used the following concentration percentages: Medium: >5%; High: >7%; Very High: >14%.

Acknowledgements

We thank A. Gómez (FCDS), R. Botero (FCDS)… for helpful comments on earlier drafts of the text and images.

This work was supported by NORAD (Norwegian Agency for Development Cooperation) and ICFC (International Conservation Fund of Canada).

Citation

Finer M, Mamani N (2022) Amazon Deforestation Hotspots 2021. MAAP: 153.

MAAP #153: Amazon Deforestation Hotspots 2021

Amazon Base Map. Deforestation hotspots across the Amazon in 2021 (as of September 18). Data: UMD/GLAD, ACA/MAAP.

We present a first look at the major 2021 Amazon deforestation hotspots.*

The Amazon Base Map illustrates several key findings:p

  • We estimate the loss of over 1.9 million hectares (4.8 million acres) of primary forest loss across the nine countries of the Amazon biome in 2021.
    k
  • This matches the previous two years, bringing the total deforestation to 6 million hectares (15 million acres) since 2019, roughly the size of the state of West Virginia.
    p
  • In 2021, most of the deforestation occurred in Brazil (70%), followed by Bolivia (14%), Peru (7%), and Colombia (6%).
    p
  • In Brazil, hotspots are concentrated along the major road networks. Many of these areas were also burned following the deforestation.
    j
  • In Bolivia, fires once again impacted several important ecosystems, including the Chiquitano dry forests.
    p
  • In Peru, deforestation continues to impact the central region, most notably from large-scale clearing for a new Mennonite colony.
    p
  • In Colombia, there continues to be an arc of deforestation impacting numerous protected areas and indigenous territories.

Below, we zoom in on the four countries with the highest deforestation (Brazil, Bolivia, Peru, and Colombia), with additional maps and analysis.

Brazil Base Map. Deforestation hotspots in Brazilian Amazon. Data: UMD/GLAD, ACA/MAAP.

Brazilian Amazon

The Brazil Base Map shows the notable concentration of deforestation hotspots along the major roads (especially roads 163, 230, 319, and 364) in the states of Acre, Amazonas, Pará, and Rondônia.


Bolivia Base Map. Deforestation hotspots in Bolivian Amazon. Data: UMD/GLAD, ACA/MAAP.

Bolivian Amazon

The Bolivia Base Map shows the concentration of hotspots due to major fires in the Chiquitano dry forest biome, largely located in the department of Santa Cruz in the southeast section of the Amazon.


Peru Base Map. Deforestation hotspots in the Peruvian Amazon. Data: UMD/GLAD, ACA/MAAP.

Peruvian Amazon

The Peru Base Map shows the concentration of deforestation in the central Amazon (Ucayali region).

We highlight the rapid deforestation (365 hectares) for a new Mennonite colony in 2021, near the town of Padre Marquez (see MAAP #149).

Also, note some additional hotspots in the south (Madre de Dios region), but these are largely from expanding agriculture instead of the historical driver of gold mining.

Indeed, gold mining deforestation has been greatly reduced due to government actions, but this illegal activity still threatens several key areas and indigenous territories (MAAP #130).


Colombia Base Map. Deforestation hotspots in northwest Colombian Amazon. Data: UMD/GLAD, ACA/MAAP.

Colombian Amazon

As described in previous reports (see MAAP #120), the Colombia Base Map shows there continues to be an “arc of deforestation” in the northwest Colombian Amazon (Caqueta, Meta, and Guaviare departments).

This arc impacts numerous Protected Areas (particularly Tinigua and Chiribiquete National Parks) and Indigenous Reserves (particularly Yari-Yaguara II and Nukak Maku).


*Notes and Methodology

The analysis was based on 10-meter resolution primary forest loss alerts (GLAD+) produced by the University of Maryland and also presented by Global Forest Watch. These alerts are derived from the Sentinel-2 satellite operated by the European Space Agency.

We emphasize that this data represents a preliminary estimate and more definitive annual data will come later in the year.

We also note that this data does include forest loss caused by natural forces and burned areas.

Our geographic range for the Amazon is a hybrid between both the biogeographic boundary (as defined by RAISG) and watershed boundary, designed for maximum inclusion.

To identify the deforestation hotspots, we conducted a kernel density estimate. This type of analysis calculates the magnitude per unit area of a particular phenomenon, in this case, forest cover loss. We conducted this analysis using the Kernel Density tool from the Spatial Analyst Tool Box of ArcGIS. We used the following parameters:

Search Radius: 15000 layer units (meters)
Kernel Density Function: Quartic kernel function
Cell Size in the map: 200 x 200 meters (4 hectares)
Everything else was left to the default setting.

For the Base Map, we used the following concentration percentages: Medium: 5-7%; High: 7-14%; Very High: >14%.

Acknowledgements

This work was supported by NORAD (Norwegian Agency for Development Cooperation) and ICFC (International Conservation Fund of Canada).

Citation

Finer M, Mamani N, Spore J (2022) Amazon Deforestation Hotspots 2021. MAAP: 153.

MAAP #152: Major Deforestation Continues in Chiribiquete National Park (Colombian Amazon)

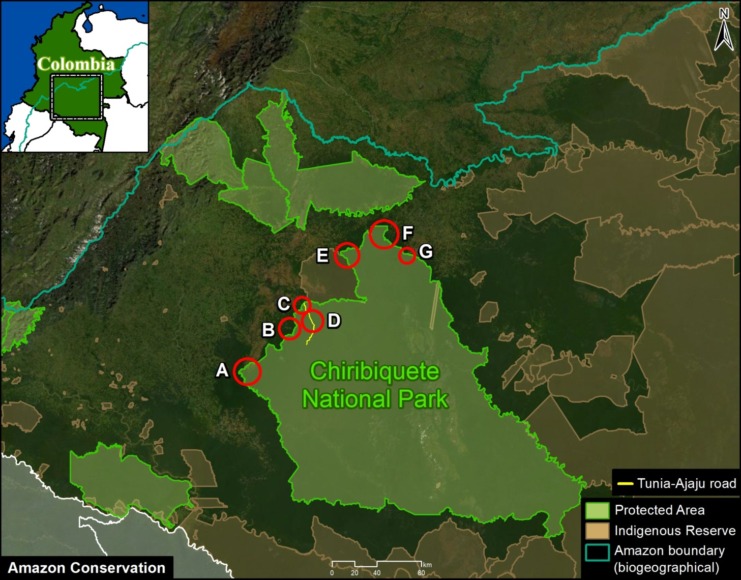
Base Map. Seven fronts of deforestation inside Chiribiquete National Park. Data: MAAP.

Deforestation within and around Chiribiquete National Park represents one of the most critical threats to primary forests in the Colombian Amazon.

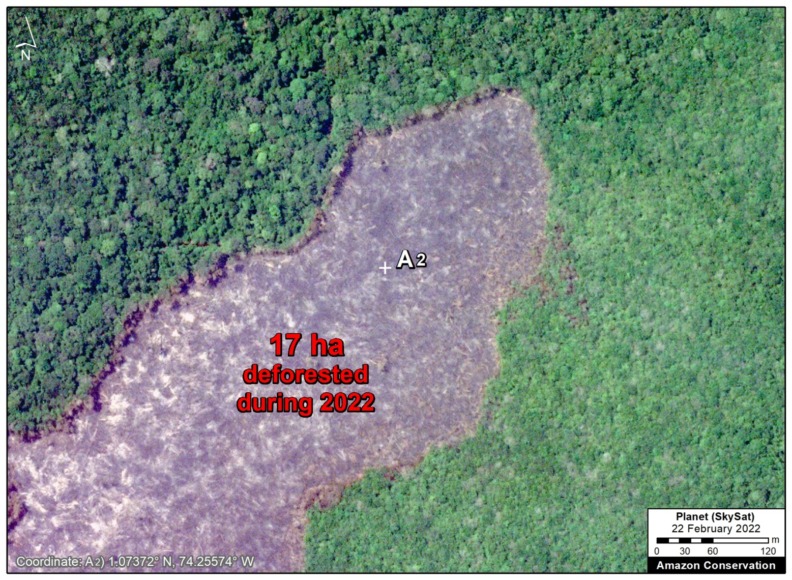
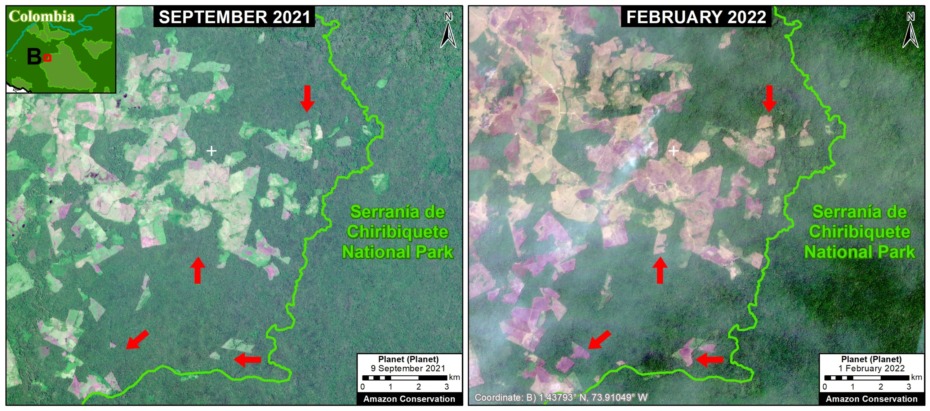
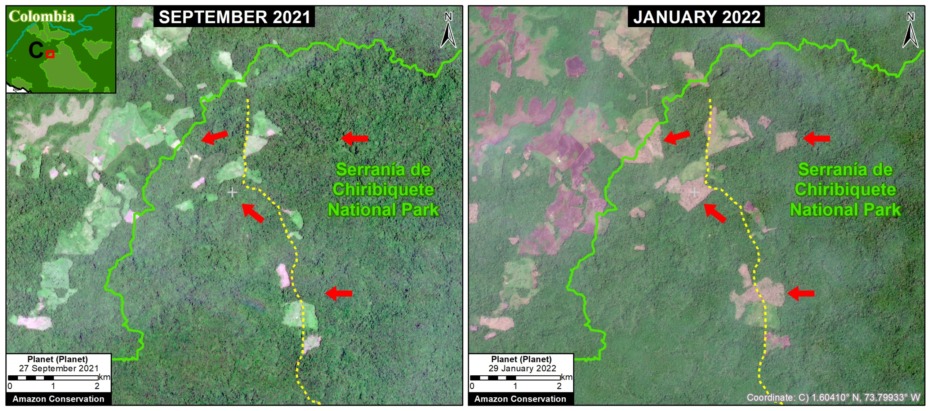
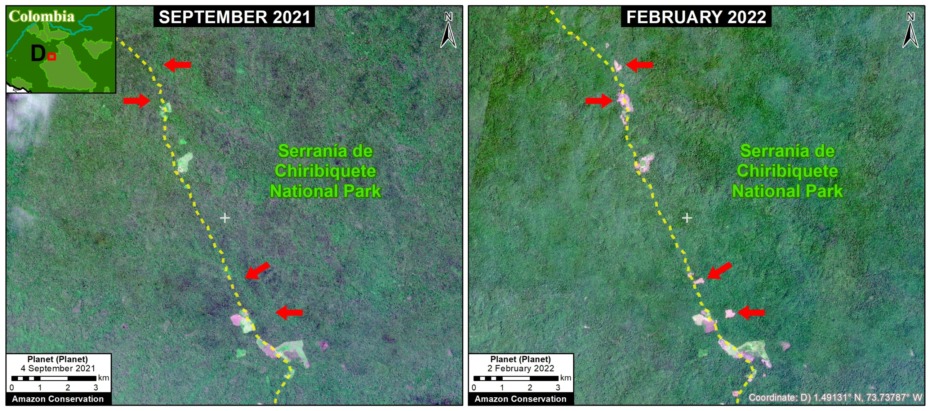
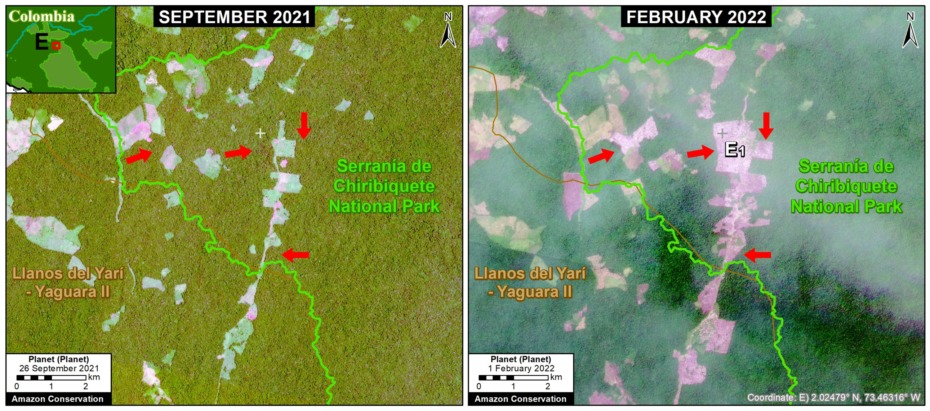
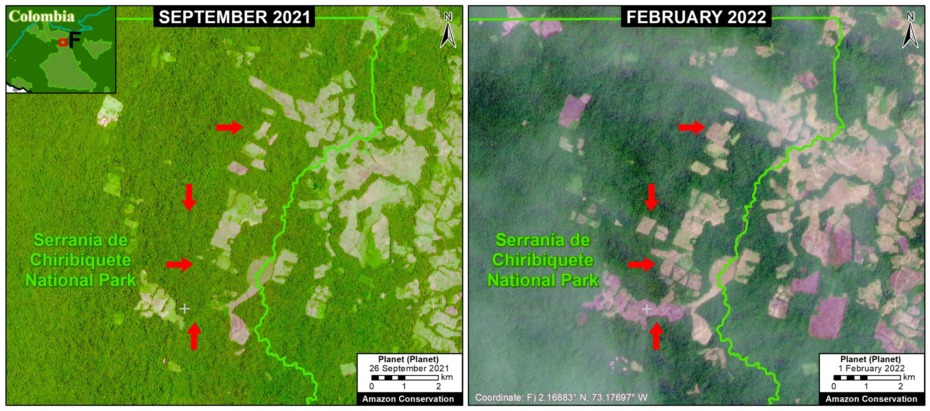
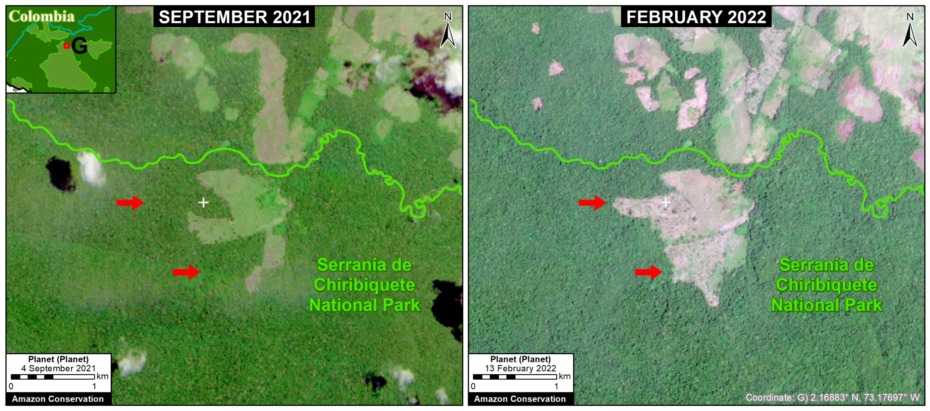
In this report, we document the recent deforestation of more than 2,000 hectares (4,950 acres) across seven fronts within Chiribiquete National Park, between September 2021 and February 2022 (see Base Map).

In addition, we estimate the total deforestation of more than 6,000 hectares (14,800 acres) within the Park since its expansion in 2018.

It is important to note that many of the major fires during February 2022 in the Colombian Amazon were actually burning recently deforested areas like these.

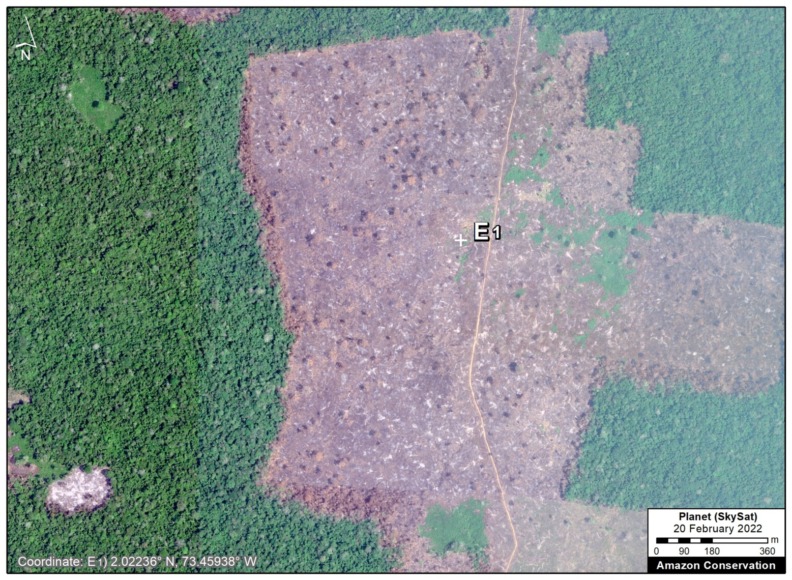
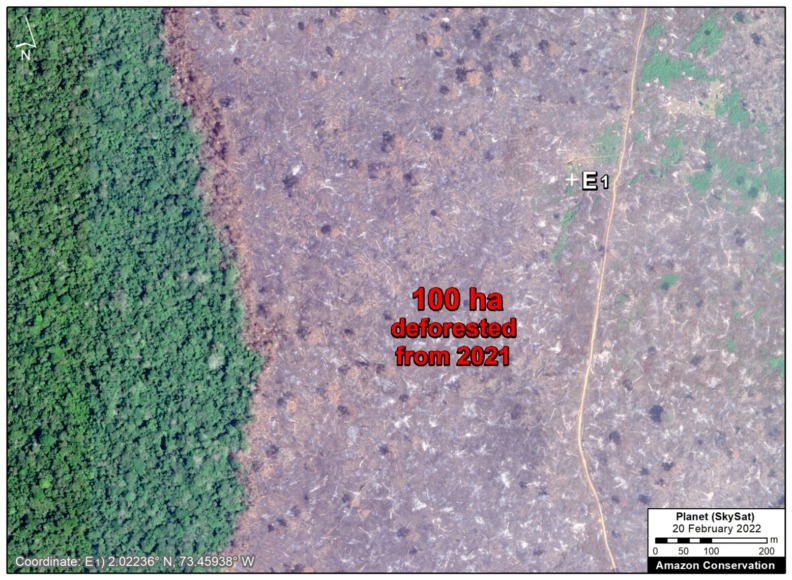
Below, we zoom in on the 7 deforestation fronts (Letters A-G on the Base Map) with both high resolution (3 meters) and very high resolution (0.5 meters) satellite images.


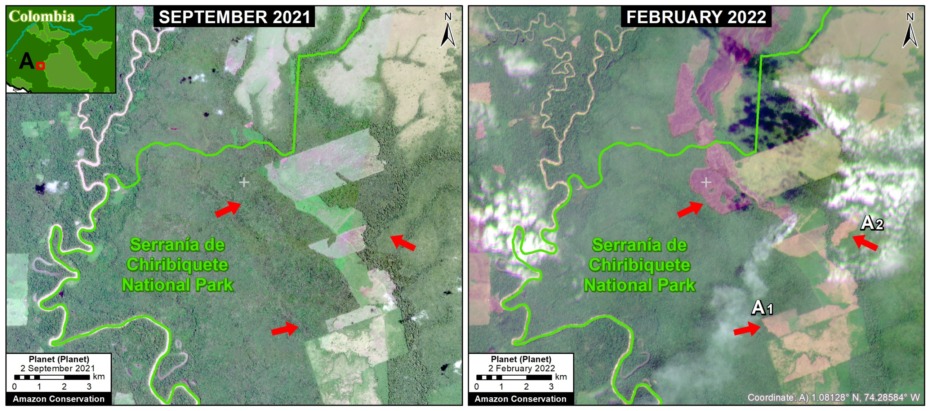
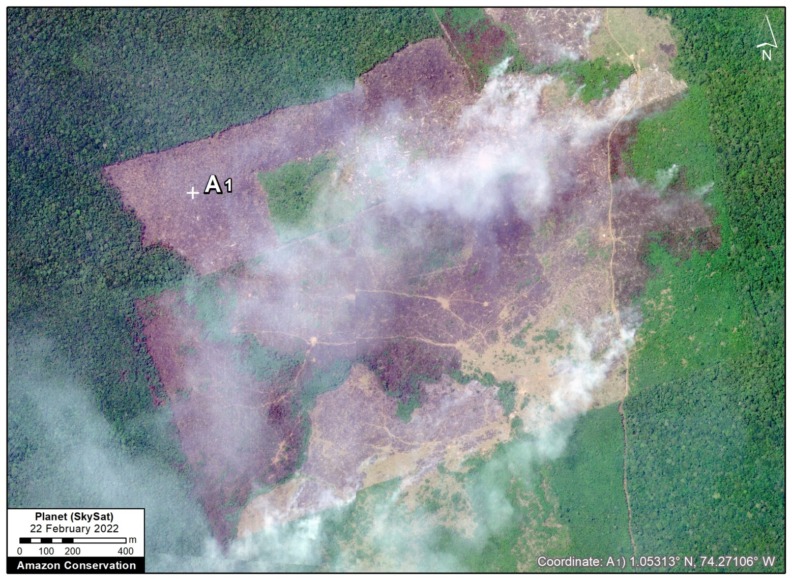
Zoom A shows the recent deforestation of 158 hectares (390 acres) in perhaps the most severe front, located in the western sector of the Park. Surrounding the park is an additional 243 hectares (600 acres) of forest loss. We also include a pair of very high-resolution images of the most recently deforested areas surrounded by intact but threatened primary forest (Zooms A1 and A2).

Zoom B shows recent deforestation of 0.5 hectares within the park, but there is an advancing deforestation front just outside the Park (more than 600 hectares, or 1,480 acres).

Zoom C shows the recent deforestation of 222 hectares (550 acres). Note the presence of the Tunia-Ajaju road. Surrounding the park is an additional 300 hectares (740 acres) of forest loss.

Zoom D shows the additional deforestation of 64 hectares (158 acres) further down the Tunia-Ajaju road.


Zoom E shows the recent deforestation of 388 hectares (960 acres) along the Cachicamo-Tunia road. Surrounding the park is an additional 660 hectares (1,630 acres) of forest loss. We also include a couple of very high-resolution images of the most recently deforested areas surrounded by intact but threatened primary forest (Zoom E1).


Zoom F shows the recent deforestation of 314 hectares (775 acres) in the northern sector of the Park. Surrounding the park is an additional 450 hectares (1,112 acres) of forest loss.


Finally, Zoom G shows the recent deforestation of 58 hectares (143 acres) in the northeast sector of the Park.


Acknowledgments

We thank L.A. Gómez and R. Botero for their contributions to this report.

This report is part of a series focused on the Colombian Amazon through a strategic collaboration between the Amazon Conservation and FCDS (Fundación para la Conservación y el Desarrollo Sostenible), with the support of the International Conservation Fund of Canada (ICFC).

Citation

Finer M, Mamani N (2022) Major Deforestation Continues in Chiribiquete National Park (Colombian Amazon). MAAP: 152.

MAAP #147: Amazon Deforestation Hotspots 2021 (1st Look)

Base Map. Deforestation hotspots across the Amazon in 2021 (as of September 18). Data: UMD/GLAD, ACA/MAAP.

We present a first look at the major deforestation hotspots across all nine countries of the Amazon in 2021 (as of September 18).*

The Base Map illustrates several key findings thus far in 2021:p

  • We estimate the loss of over 860,000 hectares (2.1 million acres) of primary forest loss across the nine countries of the Amazon.
    p
  • Amazon deforestation has been concentrated in three countries: Brazil (79%), Peru (7%), Colombia (6%).
    p
  • The vast majority of deforestation (79%) occurred in the Brazilian Amazon, where massive hotspots stretched across the major road networks. Many of these areas were also burned following the deforestation.
    p
  • There continues to be an arc of deforestation in the northwestern Colombian Amazon, impacting numerous protected areas and indigenous territories.
    p
  • In the Peruvian Amazon, deforestation continues to impact the central region, most notably from a new Mennonite colony and large-scale rice plantation.
    p
  • In Bolivia, fires are once again impacting several important ecosystems, including the Beni grasslands and Chiquitano dry forests of the Amazon, and Chaco scrub forest outside the Amazon.

Below, we zoom in on the three countries with the highest deforestation (Brazil, Colombia, and Peru) and show a series of high-resolution satellite images that illustrate some of the major 2021 deforestation events.

Widespread Deforestation in the Brazilian Amazon

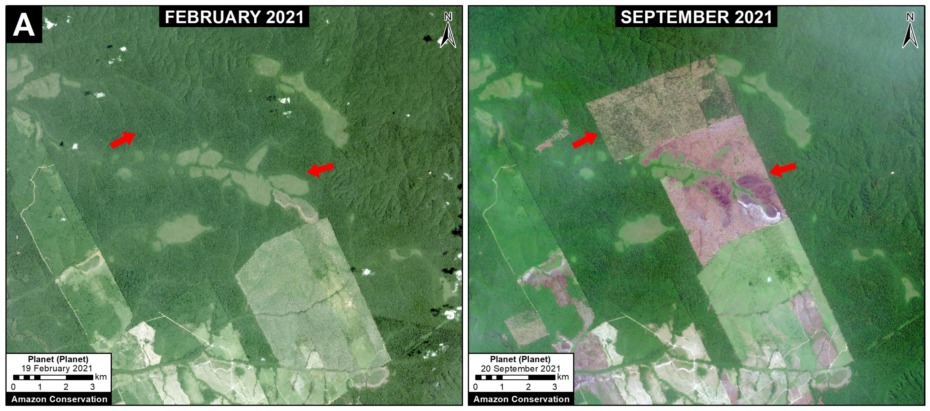
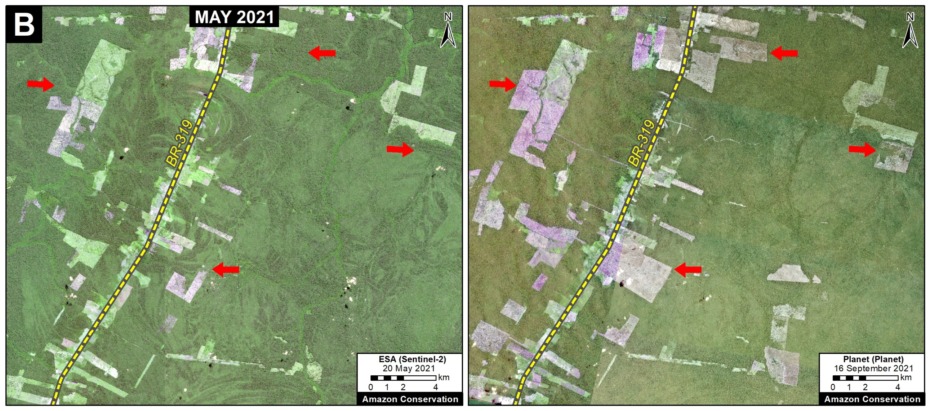
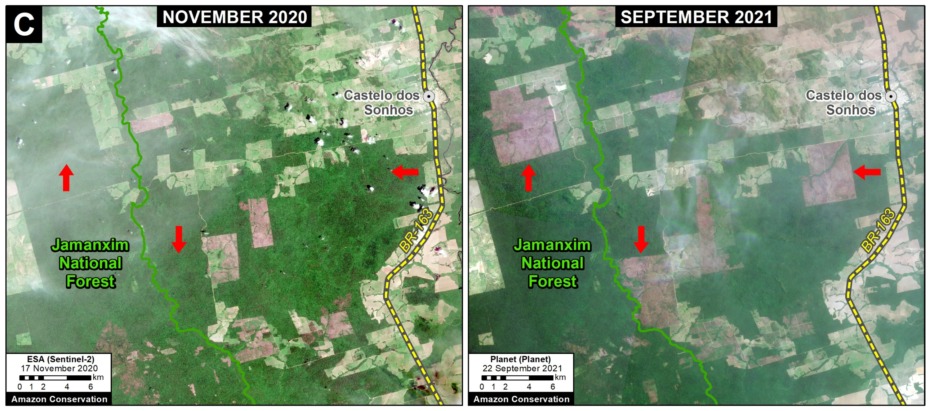
The Brazil Base Map shows the notable concentration of deforestation hotspots along the major roads (especially roads 163, 230, 319, and 364). Zooms A-C show high-resolution examples of this deforestation, which largely appears to be associated with clearing rainforests for pasture.

Brazil Base Map. Deforestation hotspots in Brazilian Amazon (as of September 18). Data: UMD/GLAD, ACA/MAAP.
Zoom A. Deforestation in the Brazilian Amazon near road 230 (TransAmazian Highway) between February (left panel) and September (right panel) of 2021. Data: Planet.
Zoom B. Deforestation in the Brazilian Amazon along road 319 in Amazonas state between May (left panel) and September (right panel) of 2021. Data: Planet, ESA.
Zoom C. Deforestation in the Brazilian Amazon along road 163 between November 2020 (left panel) and September 2021 (right panel). Data: Planet, ESA.
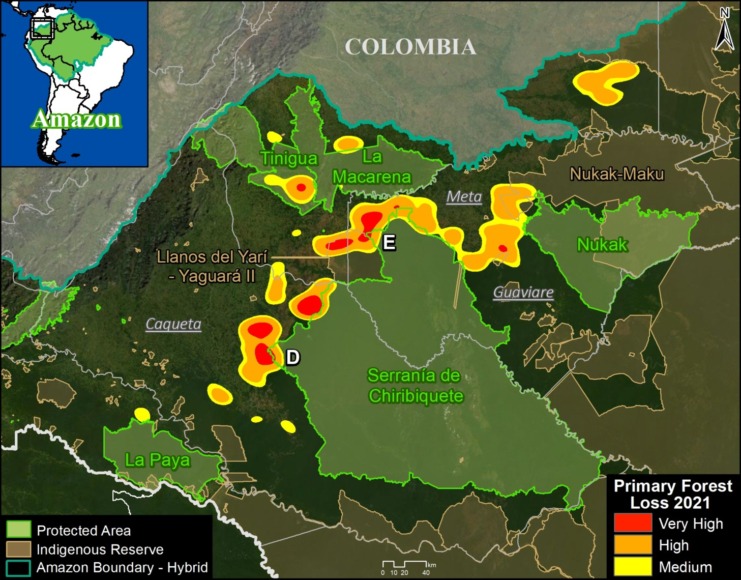
Colombia Base Map. Deforestation hotspots in northwest Colombian Amazon (as of September 18). Data: UMD/GLAD, ACA/MAAP.

Arc of Deforestation in the Colombian Amazon

As described in previous reports (see MAAP #120), the Colombia Base Map shows there continues to be an “arc of deforestation” in the northwest Colombian Amazon (Caqueta, Meta, and Guaviare departments).

This arc impacts numerous protected areas (particularly Tinigua and Chiribiquete National Parks) and Indigenous Reserves (particularly Yari-Yaguara II and Nukak Maku).

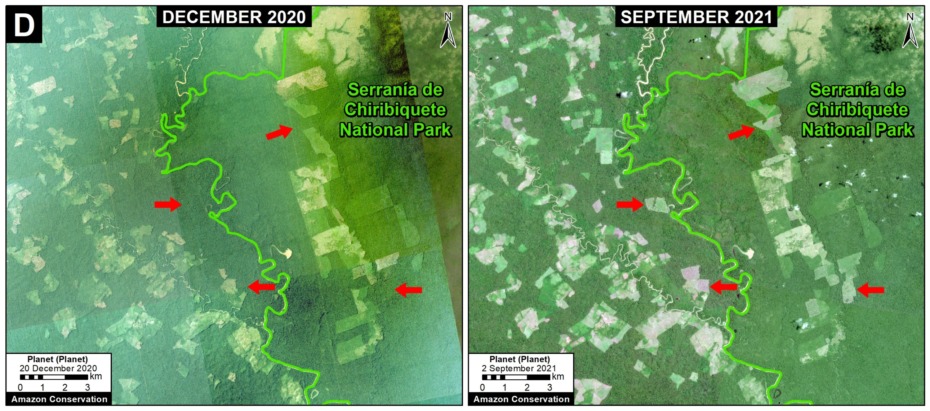
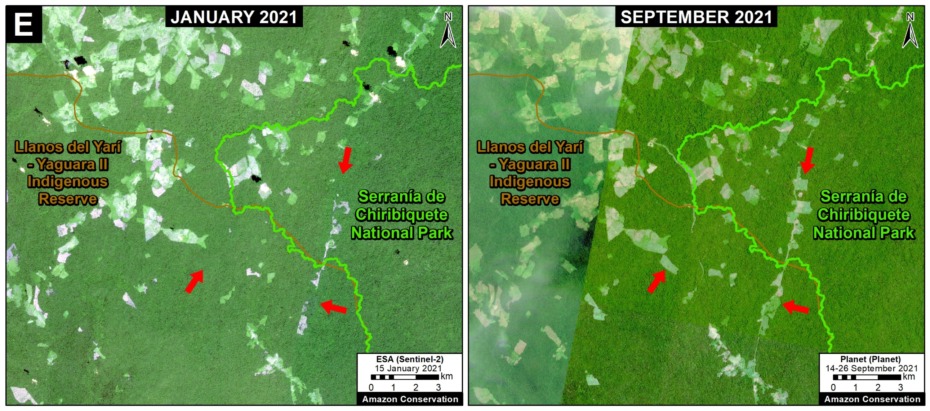
Zooms D & E show high-resolution examples of this deforestation, which largely appears to be associated with clearing rainforests for pasture.

Zoom D. Deforestation in the Colombian Amazon (Caqueta) between December 2020 (left panel) and September 2021 (right panel). Data: Planet.
Zoom E. Deforestation in the Colombian Amazon between January (left panel) and September (right panel) of 2021. Data: Planet, ESA.
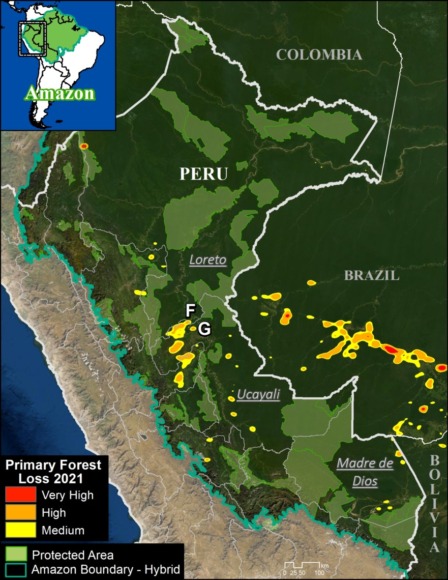
Peru Base Map. Deforestation hotspots in the Peruvian Amazon (as of September 18). Data: UMD/GLAD, ACA/MAAP.

Deforestation in the central Peruvian Amazon

The Peru Base Map shows the concentration of deforestation in the central Peruvian Amazon (Ucayali, Huanuco, and southern Loreto regions).

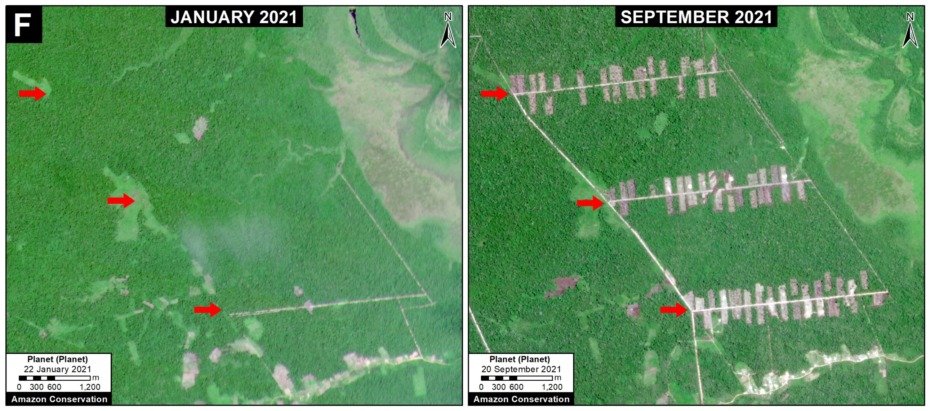
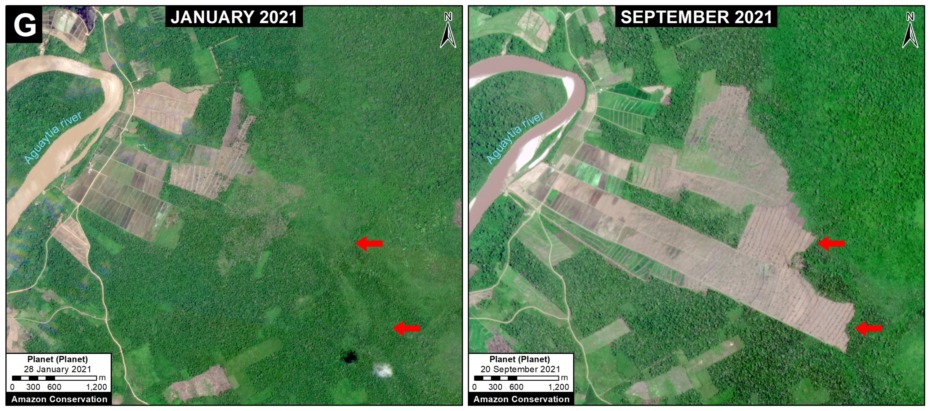
Zooms F & G show two notable examples of this deforestation: the rapid deforestation in 2021 for a new Mennonite colony (299 hectares) and large-scale rice plantation (382 hectares), respectively.

Also note some additional hotspots in the south (Madre de Dios region) from gold mining and medium-scale agriculture.

The hotspot in the north (Loreto region) is natural forest loss from a windstorm.

Zoom F. Deforestation (299 hectares) in the Peruvian Amazon for a new Mennonite colony between January (left panel) and September (right panel) of 2021 in southern Loreto region. Data: Planet.
Zoom G. Deforestation (382 ha) in the Peruvian Amazon for a new large-scale rice plantation between January (left panel) and September (right panel) of 2021 in Ucayali region. Data: Planet.

*Notes and Methodology

The analysis was based on 10-meter resolution primary forest loss alerts (GLAD+) produced by the University of Maryland and also presented by Global Forest Watch. These alerts are derived from the Sentinel-2 satellite operated by the European Space Agency.

We emphasize that this data represents a preliminary estimate and more definitive annual data will come later next year.

We also note that this data does include forest loss caused by natural forces and burned areas.

Our geographic range for the Amazon is a hybrid between both the biogeographic boundary (as defined by RAISG) and watershed  boundary, designed for maximum inclusion.

To identify the deforestation hotspots, we conducted a kernel density estimate. This type of analysis calculates the magnitude per unit area of a particular phenomenon, in this case forest cover loss. We conducted this analysis using the Kernel Density tool from Spatial Analyst Tool Box of ArcGIS. We used the following parameters:

Search Radius: 15000 layer units (meters)
Kernel Density Function: Quartic kernel function
Cell Size in the map: 200 x 200 meters (4 hectares)
Everything else was left to the default setting.

For the Base Map, we used the following concentration percentages: Medium: 7-10%; High: 11-20%; Very High: >20%.

Acknowledgements

We thank E. Ortiz and A. Ariñez for their helpful comments on this report.

This work was supported by NORAD (Norwegian Agency for Development Cooperation) and ICFC (International Conservation Fund of Canada).

Citation

Finer M, Mamani N, Spore J (2020) Amazon Deforestation Hotspots 2021. MAAP: 147.

Amazon Fire Tracker 2021: August update

Major fire burning recently deforested area in the Brazilian Amazon (#17, Mato Grosso). Data: MAAP, Planet.

Following the intense Amazon fire seasons of both 2019 and 2020, we are closely tracking 2021 with  our unique real-time Amazon fire monitoring app.*

We have documented 246 major fires across the Amazon thus far this year, as of August 1 (see Base Map below).

The vast majority have been in the Brazilian Amazon (75%), followed by Bolivia, Peru, and Colombia.

Our key findings include:

  • In the Brazilian Amazon, the majority (67%) of major fires have burned recently deforested areas. Thus, the critical pattern is Deforestation followed by Fire, as many major fires are actually burning the remains of freshly cut areas. These fires have burned over 44,000 hectares (109,000 acres), highlighting the current high deforestation in Brazil.
    k
  • We have also documented a number of major fires in the natural grasslands embedded in the eastern Brazilian Amazon. Most of these fires have occurred in Indigenous Territories, such as Xingu andKayapó.
    l
  • The Brazilian government issued a ban on unauthorized outdoor fires on June 27, thus we assume that most of the 160 major fires following that date have been illegal.
    k
  • In the Bolivian Amazon, we have detected 35 major fires, mostly in the departments of Beni and Santa Cruz. In Beni, these fires have impacted 19,000 hectares (48,000 acres) of natural savanna ecosystems.
    k
  • In the Peruvian Amazon, most of the major fires have been in the higher elevation grasslands, impacting over 2,600 hectares (6,500 acres) in the upper reaches of the watershed.
    j
  • In the Colombian Amazon, we detected several major fires during that region’s peak season of February-March.

Below, we present our updated major Amazon fires Base Map, along with more detailed information for the Brazilian Amazon.

*In a new and unique approach, the app combines data from both the atmosphere (aerosol emissions in smoke) and the ground (heat anomaly alerts) to quickly and precisely detect major Amazon fires (see App Background below).

Base Map: Major Amazon Fires 2021

The Base Map shows the location of this year’s major fires (orange dots), as visualized in the app’s “Major Amazon Fires 2021” layer. Of the 209 major fires in the Amazon this year, the vast majority have been in Brazil (75%), followed by Bolivia (14%), Peru (9%), and Colombia (2%).

Base Map. “Major Amazon Fires 2021” layer, as visualized in the app. Data: MAAP, Amazon Conservation.


Fires in the Brazilian Amazon

Major fire burning recently deforested area in the Brazilian Amazon. Data: MAAP, Planet.

In the Brazilian Amazon, we have documented 184 major fires thus far in 2021.

This marks an increase from the start of the intense 2020 fire season, when we had detected 87 major fires by this same date (we ultimately documented over 2,250 major fires by the end of the year).

As noted above, the majority (67%) of major fires have burned recently deforested areas (that is, areas where the forest was previously cleared between 2017 and 2021 prior to burning). These fires have burned over 44,000 hectares (109,000 acres), highlighting the current high deforestation in Brazil.

Most of the remaining fires have occurred in either natural savannah grasslands (impacting 35,000 ha) or older croplands. Many of the grassland fires have occurred in Indigenous Territories, such as Xingu and Kayapó.

It is worth highlighting that we have also documented the first several “Forest Fires” of the season, defined here as human-caused fires in standing forest. The impact of these fires has been relatively small so far (400 hectares), but this number is expected to spike as the dry season intensifies in August and September.

The Brazilian government issued a ban on unauthorized outdoor fires on June 27, thus we assume that most of the 160 major fires following that date have been illegal.

The state of Mato Grosso has had the most major fires (43%), followed by Amazonas (29%), Pará (14%), Rondônia (12%), and Acre (2%).

*App Background

We launched a new and improved version of the Amazon real-time fire monitoring app in May 2021. The app is hosted by Google Earth Engine and updated every day by the organization Conservación Amazónica, based in Peru.

The app displays aerosol emissions as detected by the European Space Agency’s Sentinel-5 satellite. Elevated aerosol levels indicate the burning of large amounts of biomass, defined here as a “major fire”. In a novel approach, the app combines data from the atmosphere (aerosol emissions in smoke) and the ground (heat anomaly alerts) to effectively detect and visualize major Amazon fires.

When fires burn, they emit gases and aerosols. A new satellite (Sentinel-5P from the European Space Agency) detects these aerosol emissions (aerosol definition: Suspension of fine solid particles or liquid droplets in air or another gas). Thus, the major feature of the app is detecting elevated aerosol emissions which in turn indicate the burning of large amounts of biomass. For example, the app distinguishes small fires clearing old fields (and burning little biomass) from larger fires burning recently deforested areas or standing forest (and burning lots of biomass). The spatial resolution of the aerosol data is 7.5 sq km. The high values in the aerosol indices (AI) may also be due to other reasons such as emissions of volcanic ash or desert dust so it is important to cross reference elevated emissions with heat data and optical imagery.

We define “major fire” as one showing elevated aerosol emission levels on the app, thus indicating the burning of elevated levels of biomass. This typically translates to an aerosol index of >1 (or cyan-green to red on the app). To identify the exact source of the elevated emissions, we reduce the intensity of aerosol data in order to see the underlying terrestrial heat-based fire alerts. Typically for major fires, there is a large cluster of alerts. The major fires are then confirmed, and burn areas estimated, using high-resolution satellite imagery from Planet Explorer.

We define burning “recently deforested areas” as any forested area cleared since 2017 and subsequently burned in 2021.

Since the data updates daily and is not impacted by clouds, real-time monitoring really is possible. Our goal is to upload each day’s new image in the late afternoon/early evening.

Acknowledgements

The app was developed and updated daily by Conservación Amazónica (ACCA). The data analysis is led by Amazon Conservation in collaboration with SERVIR Amazonia.

The Amazon Fire Tracker series is supported by NORAD (Norwegian Agency for Development Cooperation) and ICFC (International Conservation Fund of Canada).

Citation

Finer M, Costa H, Villa L (2021) Amazon Fire Tracker 2021: August Update. MAAP 2021, #3.

Amazon Fire Tracker 2021: Brazilian Amazon Fire Season Intensifies

2021 Brazilian Amazon Fire #17 (June 18, Mato Grosso). Data: MAAP, Planet.

We have documented 24 major fires in the Brazilian Amazon thus far in 2021 (as of June 29), based on our unique real-time Amazon fire monitoring app,

In 2020, we demonstrated the power of the app, documenting over 2,500 major fires across the Bolivian, Brazilian, and Peruvian  Amazon (MAAP #129).

In a new and unique approach, the app combines data from both the atmosphere (aerosol emissions in smoke) and the ground (heat anomaly alerts) to quickly and precisely detect major Amazon fires (MAAP #118).*

We recently reported that the 2021 Brazilian Amazon fire season started on May 19-20, with a pair of major fires on the southern edge of the Amazon in the state of Mato Grosso. For comparison, the intense 2020 fire season started on May 28.

Here, we provide an update through the end of June: we have documented 24 major fires in the Brazilian Amazon, all of which have occurred in the state of Mato Grosso. See the Base Map below for major fire locations (orange dots indicate major 2021 Amazon fires).

Importantly, by analyzing an archive of satellite imagery from the company Planet, we have confirmed that all 24 major fires burned recently deforested areas.  That is, all of the fires were burning the abundant remaining biomass in areas freshly deforested in 2020 and even 2021 (over 7,000 hectares, or 17,000 acres, in total).

Thus, the critical pattern is Deforestation followed by Fire.

To clarify this important point, we have not yet documented “forest fires” impacting intact Amazon forest, but these types of fires are expected later in the fire season, as was the pattern documented in 2020 (see MAAP #129). Also, nearly all fires in the Amazon are assumed to be human-caused and not natural wildfire events.

Below, we present the Base Map along with a striking series of satellite imagery videos showing this critical process of Amazon deforestation followed by major fires. Note that for fire #22, the burning occurred in areas deforested as recently as May 2021.

Base Map: Major Amazon Fires 2021

The Base Map shows the location of the 2021 major Amazon fires (orange dots), as visualized in the app. Note the concentration of fires in the southeastern Brazilian state of Mato Grosso. Keep in mind all those dots also indicate major recent deforestation events. None of these fires directly impacted a protected area or indigenous territory (see Annex). Also note several major fires in the Colombian Amazon that we detected earlier in the year, during that region’s peak season of February -March.

Satellite Imagery Videos

Brazilian Amazon Fires #5 and #23

We detected this series of major fires on May 28 and June 27, in the state of Mato Grosso. As the satellite video shows, this area was deforested in 2020 prior to being burned in June 2021.

https://www.planet.com/stories/brazilian-amazon-fire-23-9yAJFJznR

Brazilian Amazon Fire #22

We detected this major fire on June 27, in the state of Mato Grosso. As the satellite video shows, this area was deforested quite recently (March-May 2021) immediately prior to being burned in June.

Brazilian Amazon Fire #17

We detected this major fire on June 18, in the state of Mato Grosso. As the satellite video shows, this area was deforested in late 2020 and early 2021 prior to being burned in June 2021.

Brazilian Amazon Fire #2

We detected the second major fire of the year in the Brazilian Amazon on May 20, also on the southern edge of the Amazon in the state of Mato Grosso. As the satellite video shows, this area was also first cleared in 2020 and then later burned in 2021.

2021 Brazilian Amazon Fire #2. Mato Grosso. Data: MAAP, Planet.

Annex

The Annex map shows a zoom of the southeastern Brazilian Amazon, as visualized in the app with the protected areas and indigenous territories layers activated. Note that none of the 24 major fires directly impacted a protected area or indigenous territory.


*App Background

We launched a new and improved version of the Amazon real-time fire monitoring app in May 2021. The app is hosted by Google Earth Engine and updated every day by the organization Conservación Amazónica, based in Peru.

The app displays aerosol emissions as detected by the European Space Agency’s Sentinel-5 satellite. Elevated aerosol levels indicate the burning of large amounts of biomass, defined here as a “major fire”. In a novel approach, the app combines data from the atmosphere (aerosol emissions in smoke) and the ground (heat anomaly alerts) to effectively detect and visualize major Amazon fires.

When fires burn, they emit gases and aerosols. A new satellite (Sentinel-5P from the European Space Agency) detects these aerosol emissions (aerosol definition: Suspension of fine solid particles or liquid droplets in air or another gas). Thus, the major feature of the app is detecting elevated aerosol emissions which in turn indicate the burning of large amounts of biomass. For example, the app distinguishes small fires clearing old fields (and burning little biomass) from larger fires burning recently deforested areas or standing forest (and burning lots of biomass). The spatial resolution of the aerosol data is 7.5 sq km. The high values in the aerosol indices (AI) may also be due to other reasons such as emissions of volcanic ash or desert dust so it is important to cross reference elevated emissions with heat data and optical imagery.

We define “major fire” as one showing elevated aerosol emission levels on the app, thus indicating the burning of elevated levels of biomass. This typically translates to an aerosol index of >1 (or cyan-green to red on the app). To identify the exact source of the elevated emissions, we reduce the intensity of aerosol data in order to see the underlying terrestrial heat-based fire alerts. Typically for major fires, there is a large cluster of alerts. The major fires are then confirmed, and burn areas estimated, using high-resolution satellite imagery from Planet Explorer.

Since the data updates daily and is not impacted by clouds, real-time monitoring really is possible. Our goal is to upload each day’s new image in the late afternoon/early evening.

Acknowledgements

The app was developed and updated daily by Conservación Amazónica (ACCA). The data analysis is led by Amazon Conservation in collaboration with SERVIR Amazonia.

The Amazon Fire Tracker series is supported by NORAD (Norwegian Agency for Development Cooperation) and ICFC (International Conservation Fund of Canada).

Citation

Finer M, Villa L (2021) Amazon Fire Tracker 2021: Brazilian Amazon Fire Season Intensifies. MAAP.