MAAP #26: Deforestation Hotspots in the Peruvian Amazon, 2015
March 1, 2016
Thanks to the newly launched GLAD alerts (developed by the University of Maryland and Google1, and presented by Global Forest Watch), we now have weekly access to high-resolution forest loss data across Peru. Here in MAAP #26, we analyze the first batch of this data to better understand deforestation patterns in the Peruvian Amazon in 2015. In the coming weeks and months, we will use this map as a base for investigating major hotspots of forest loss in the country.

According to the GLAD alert data, total estimated forest loss in Peru in 2015 was 158,658 hectares (392,050 acres). If confirmed, that represents the second highest total on record, behind only 2014 (177,500 hectares).
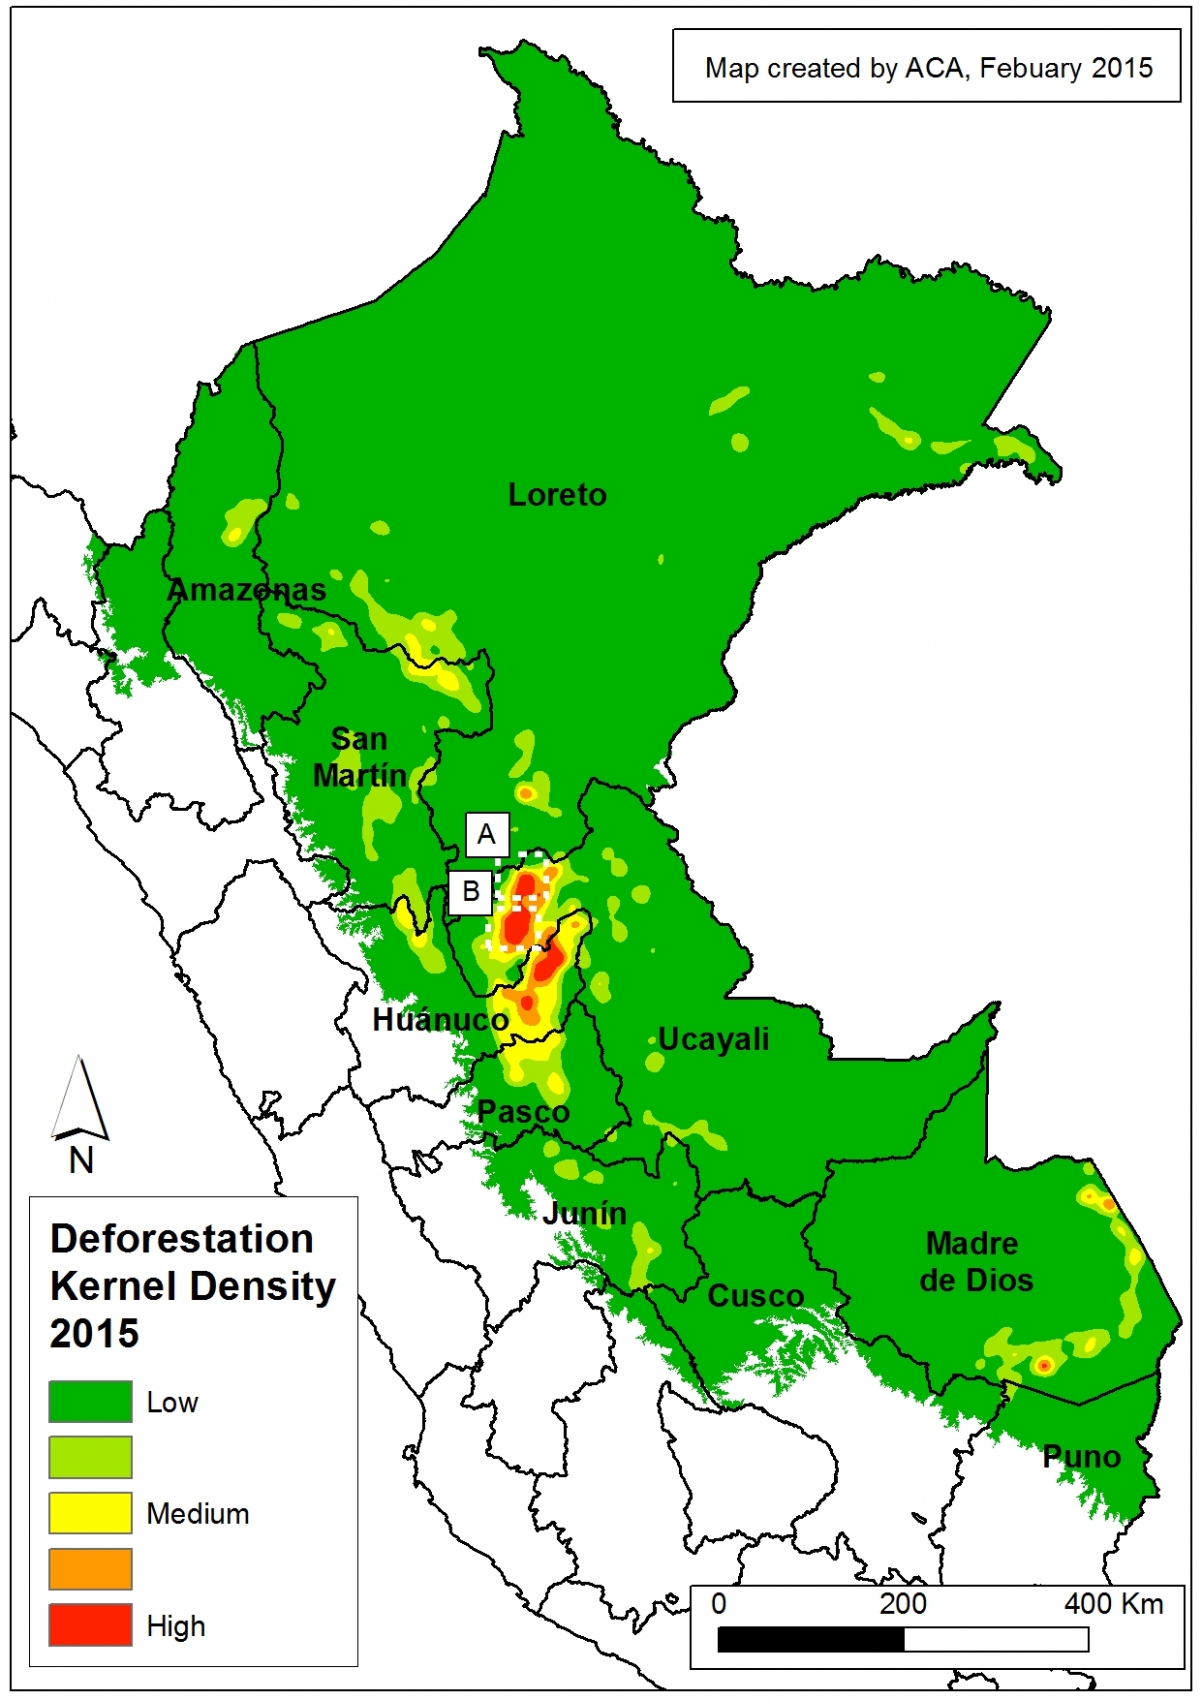
To better understand where the GLAD alert data was concentrated in 2015, we conducted kernel density estimation, a type of analysis that calculates the magnitude per unit area of a particular phenomenon (in this case, forest loss). Image 26a shows the kernel density map for forest loss in the Peruvian Amazon in 2015. It reveals that recent deforestation was concentrated in a number of hotspots in the departments of Huánuco, Madre de Dios, and Ucayali.
Note that in MAAP #25, we conducted this same type of analysis for 2012 – 2014 forest loss data. Thus, with this latest analysis we can see how deforestation trends shifted in 2015.
Insets A and B highlight an area in central Peru (department of Ucayali) where deforestation intensified in 2015. See below for high-resolution images showing the deforestation in these areas. In the coming weeks and months, we will be publishing additional articles highlighting other key 2015 deforestation hotspots.
Inset A

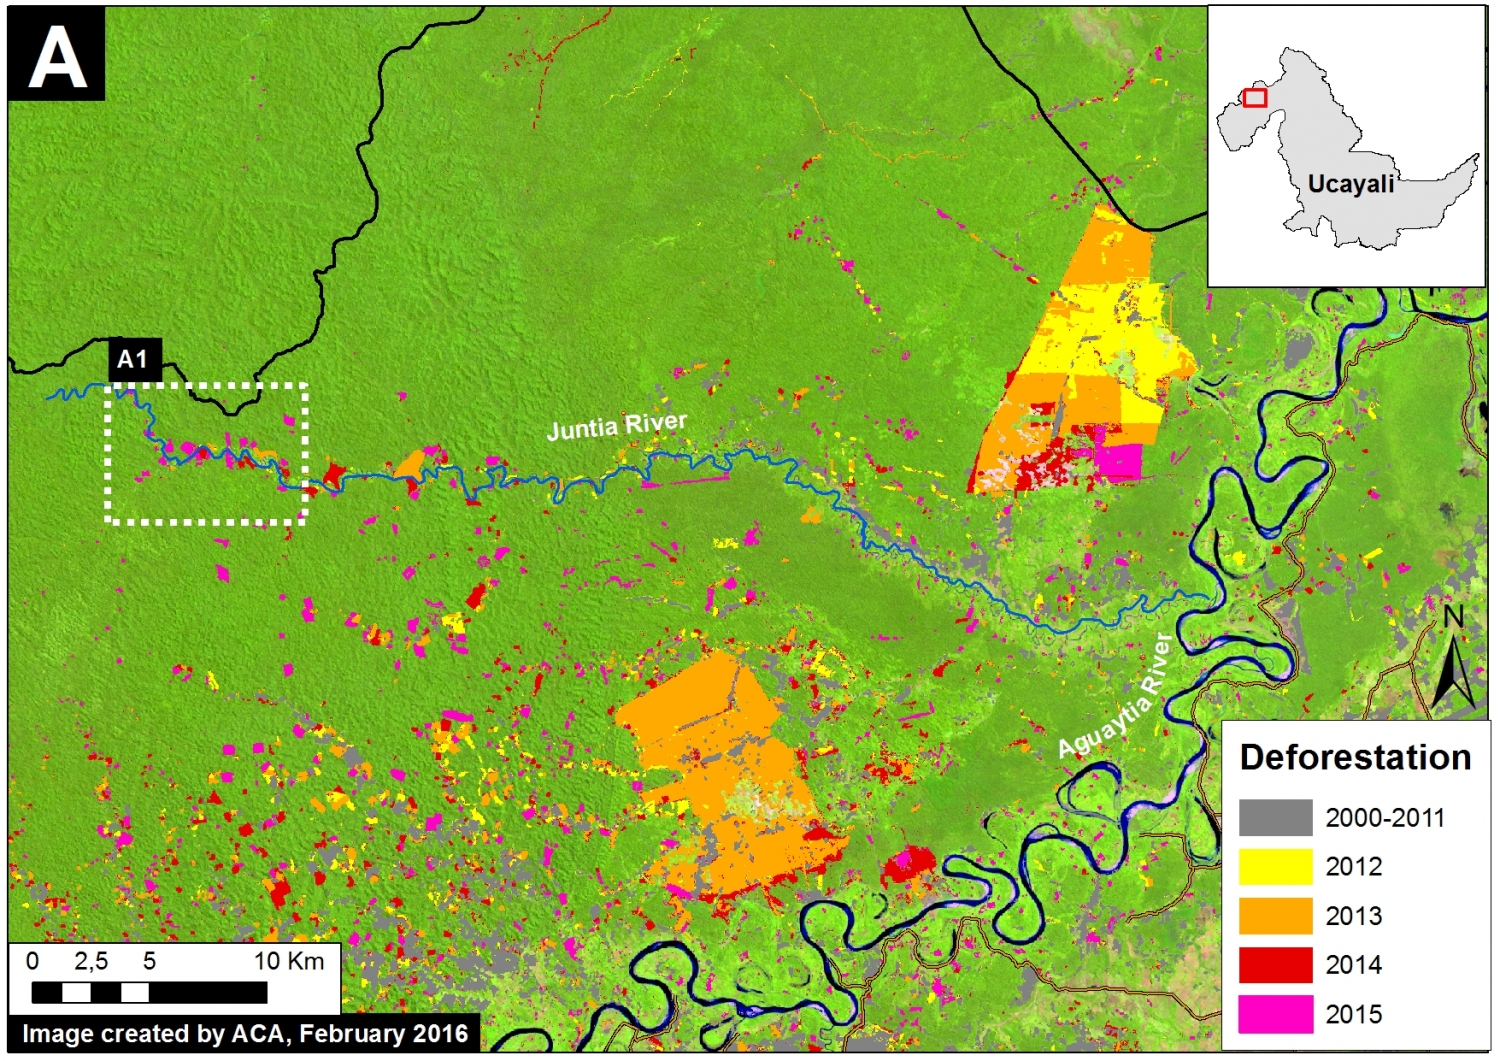
Image 26b shows detailed deforestation information for the area indicated in Inset A (from Image 26a). Note the extensive 2015 deforestation just to the west of two large-scale oil palm plantations (201 hectares, see pink areas).
Further below, Image 26c shows a high-resolution satellite image of the area in Inset A1 before (left panel) and after (right panel) the recent deforestation events.

Inset B

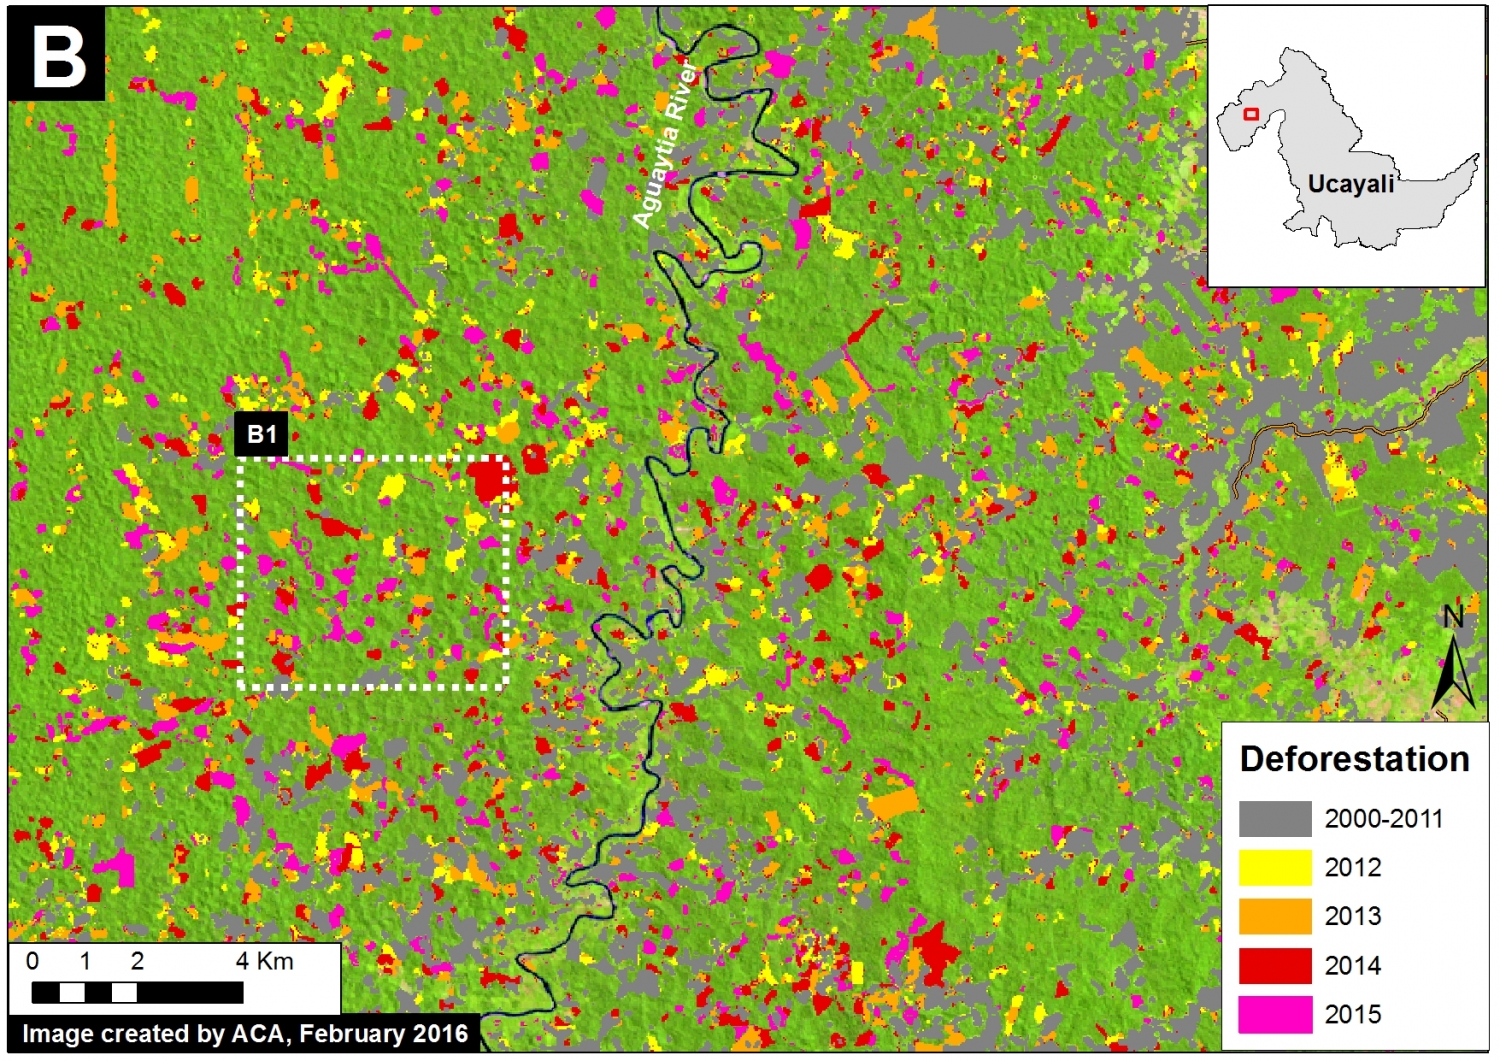
Image 26d shows detailed deforestation information for the area indicated in Inset B (from Image 26a). Note the extensive 2015 deforestation along the Aguaytia River (164 hectares, see pink areas). Recent deforestation (2012-14) appears to be associated with agricultural and logging activities.
Further below, Image 26e shows a high-resolution satellite image of the area in Inset B1 before (left panel) and after (right panel) the recent deforestation events.

Methodology
We conducted this analysis using the Kernel Density tool from Spatial Analyst Tool Box of ArcGis 10.1 software. Our goal was to emphasize local concentrations of deforestation in the raw data while still representing overarching patterns of deforestation between 2012 and 2014. We accomplished this using the following parameters:
Search Radius: 15000 layer units (meters)
Kernel Density Function: Quartic kernel function
Cell Size in the map: 200 x 200 meters (4 hectares)
Everything else was left to the default setting.
Reference
1 Hansen, M.C., A. Krylov, A. Tyukavina, P.V. Potapov, S. Turubanova, B. Zutta, S. Ifo, B. Margono, F. Stolle, and R. Moore. Humid tropical forest disturbance alerts using Landsat data. Environmental Research Letters, in press. Accessed through Global Forest Watch on March 2, 2016. www.globalforestwatch.org
Citation
Finer M, Novoa S, Snelgrove C (2015) 2015 Deforestation Hotspots in the Peruvian Amazon. MAAP: 26.


