MAAP #70: “Hurricane Winds” in the Peruvian Amazon, a 13 Year Analysis
October 9, 2017
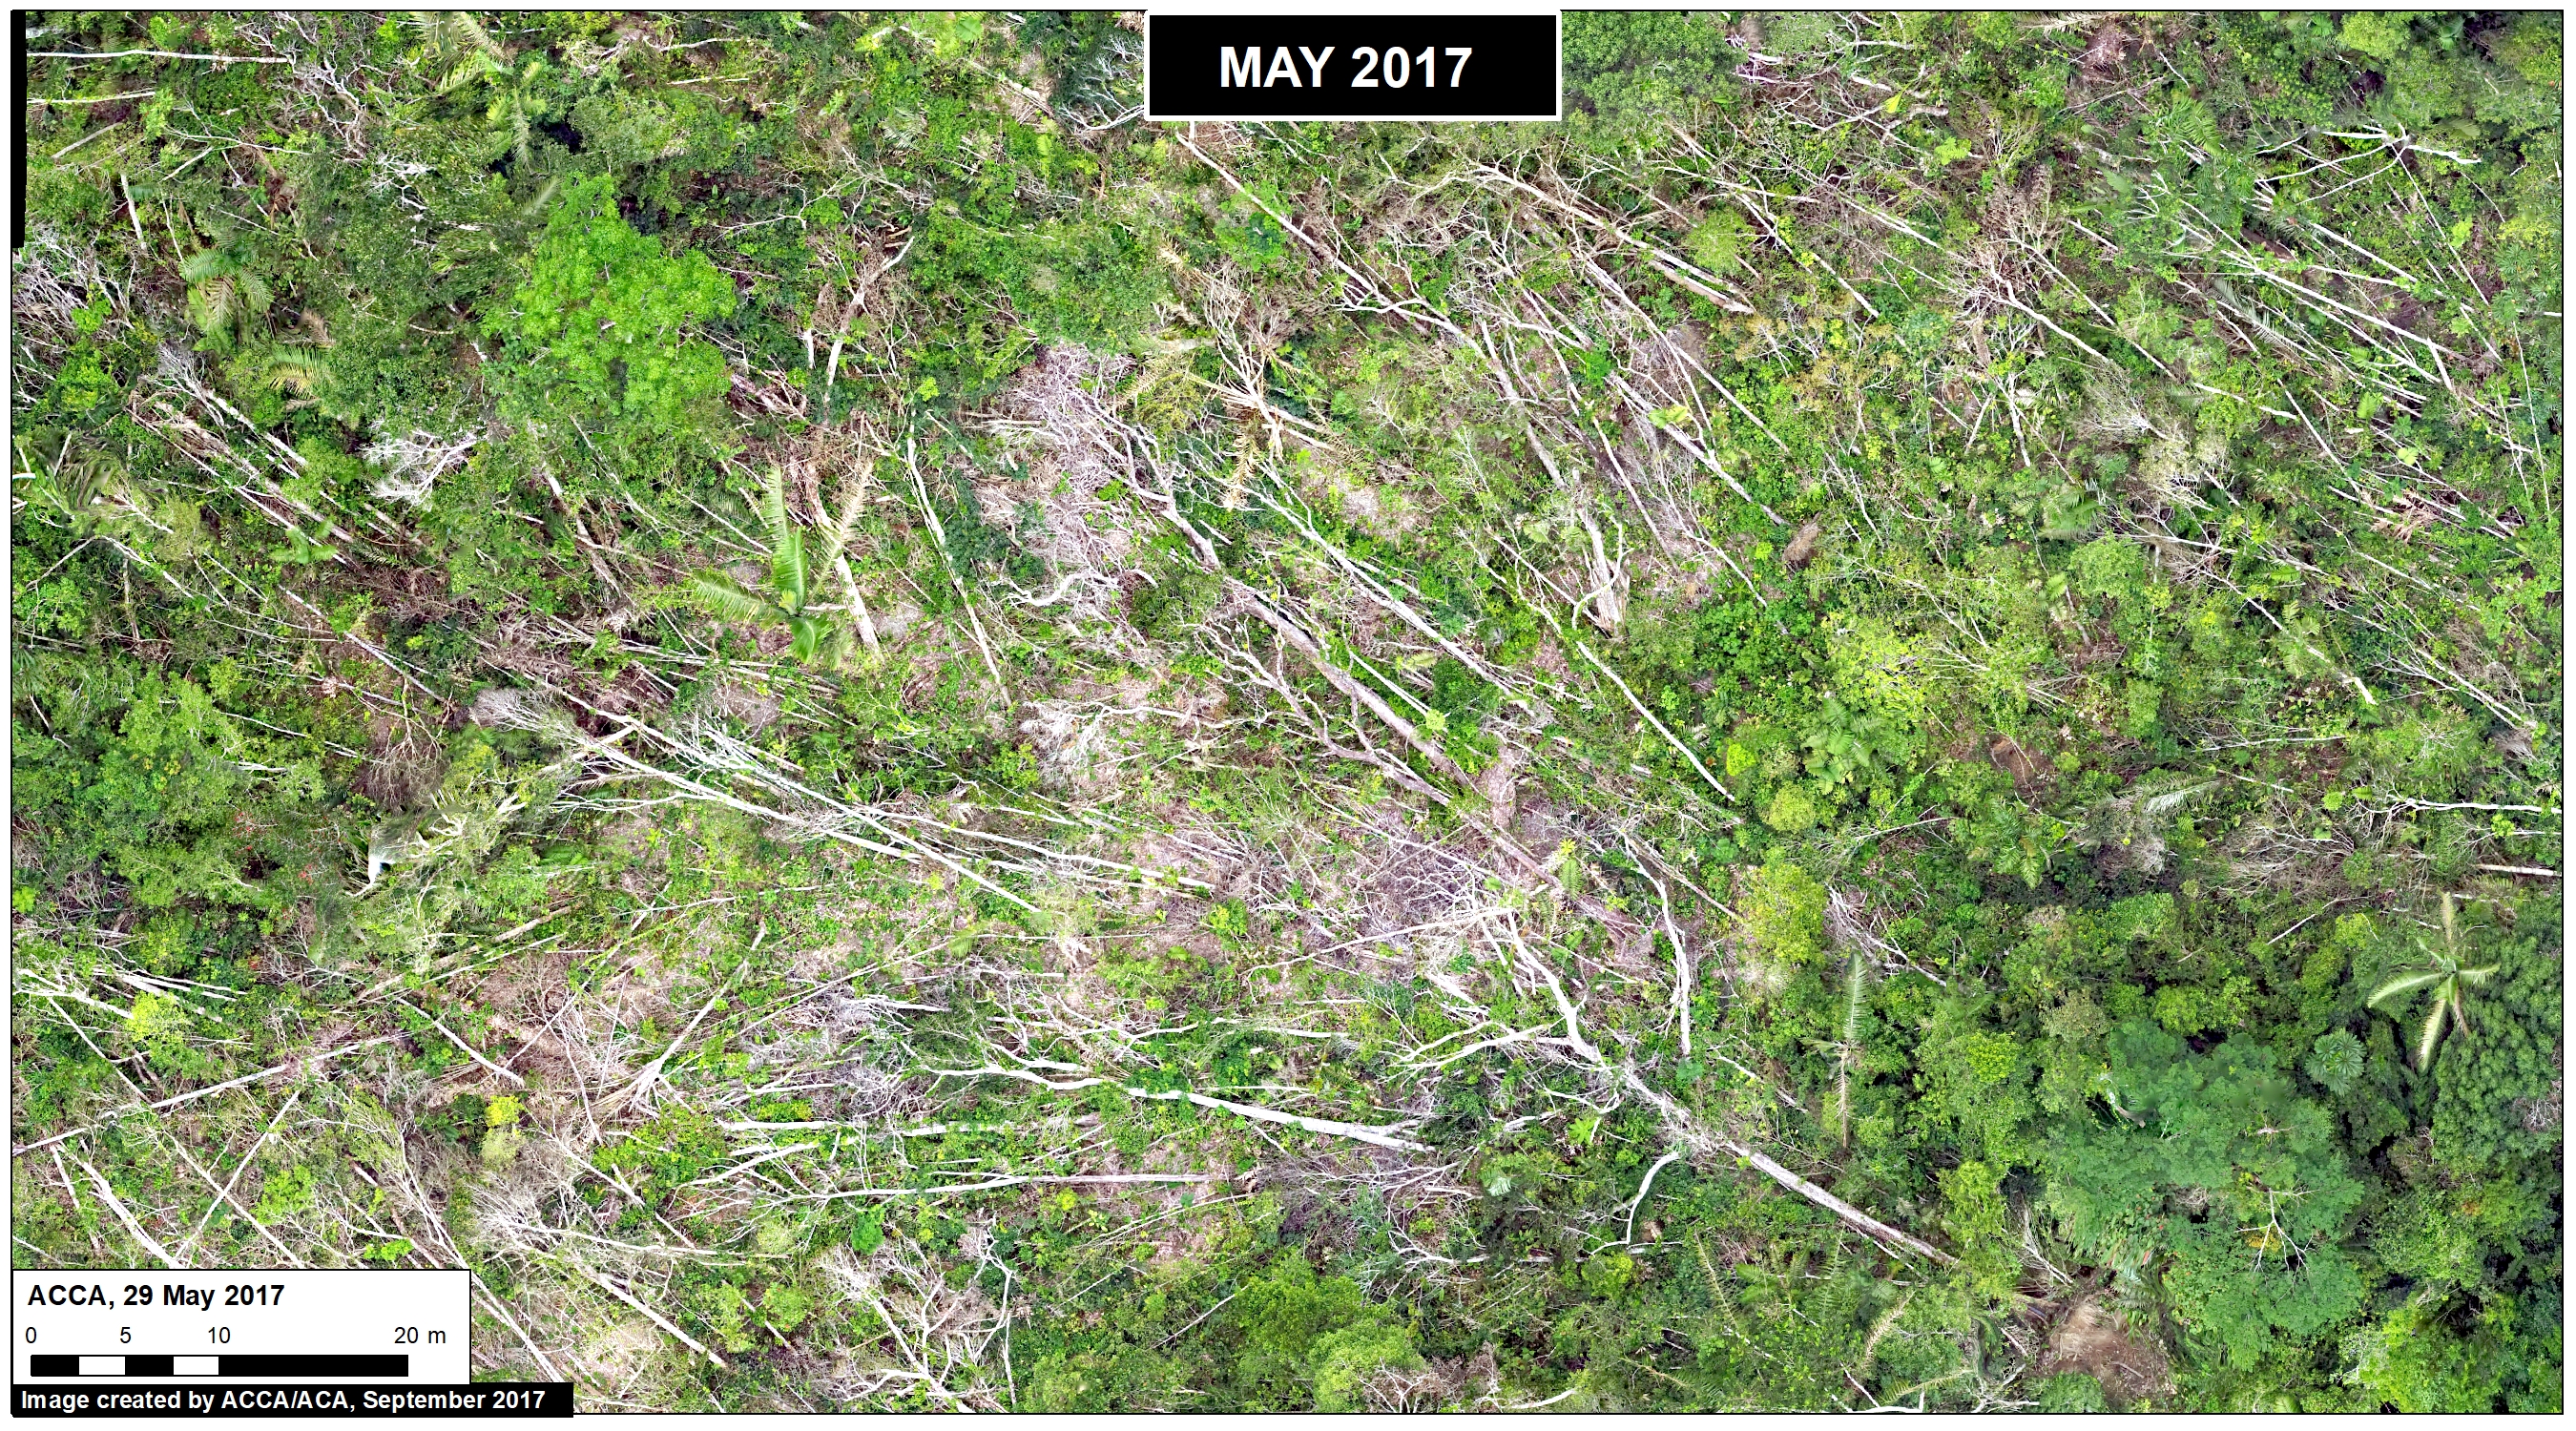
In an earlier report, MAAP #54, we described the natural phenomenon of “hurricane winds” in the Peruvian Amazon. These strong wind storms (not true hurricanes) cause a chain reaction of fallen trees and may blow down hundreds of acres of Amazonian forest (see Drone Image below).
This report presents an analysis of the frequency and intensity of hurricane winds in the Peruvian Amazon over the past 13 years (2005-17). The analysis is based on the annual forest loss data and early warning alerts data.
Temporal Patterns
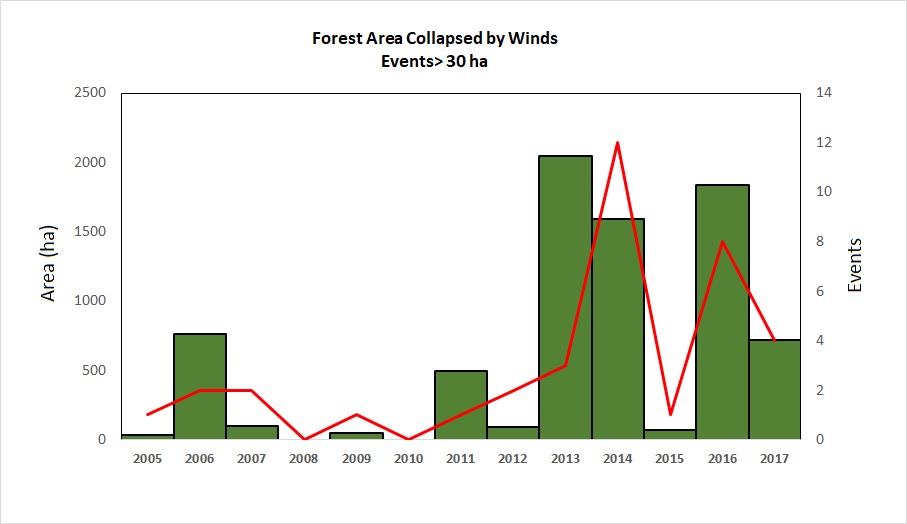
Graph 70 shows the temporal patterns for two important annual variables: Number of hurricane wind events (red line) and the total forest blowdown area (green bars). We found a total of 37 hurricane wind events resulting in the blowdown of 19,275 acres (7,800 hectares) between 2005 and 2017 in the Peruvian Amazon. Note the major increase in 2013, 2014, and 2016; these three years account for two-thirds of the total events and blowdown area.
Spatial Patterns
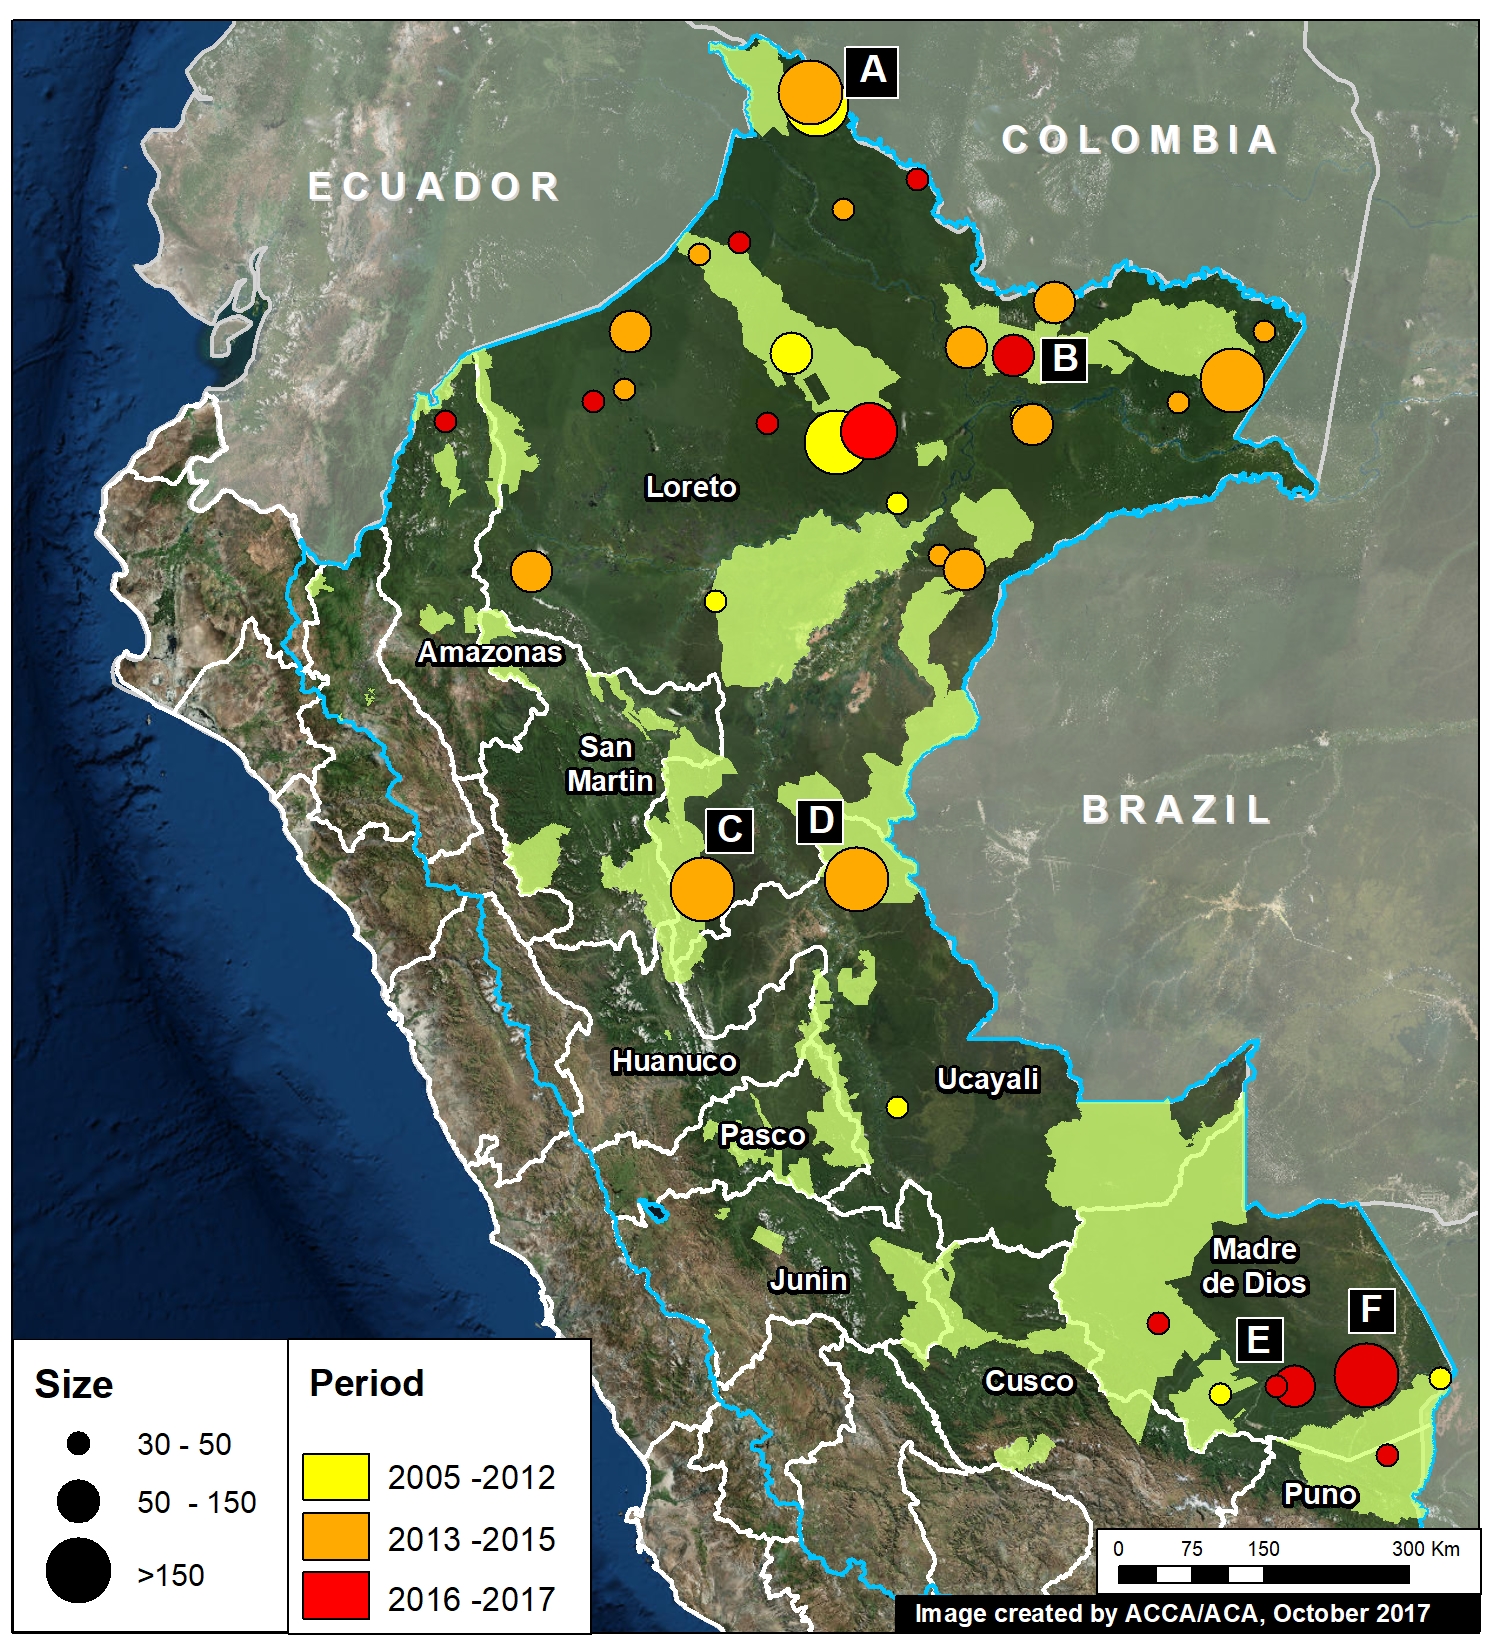
Image 70 shows the spatial patterns of the hurricane winds. Note the following highlights:
– Most of the events occurred in the regions of Loreto and Madre de Dios.
– In Loreto, most of the events occurred since 2013; in Madre de Dios, most occurred since 2016.
– There were 7 major events over 150 hectares (370 acres) each. The largest of these events was 2,255 acres (912 hectares).
Satellite Images
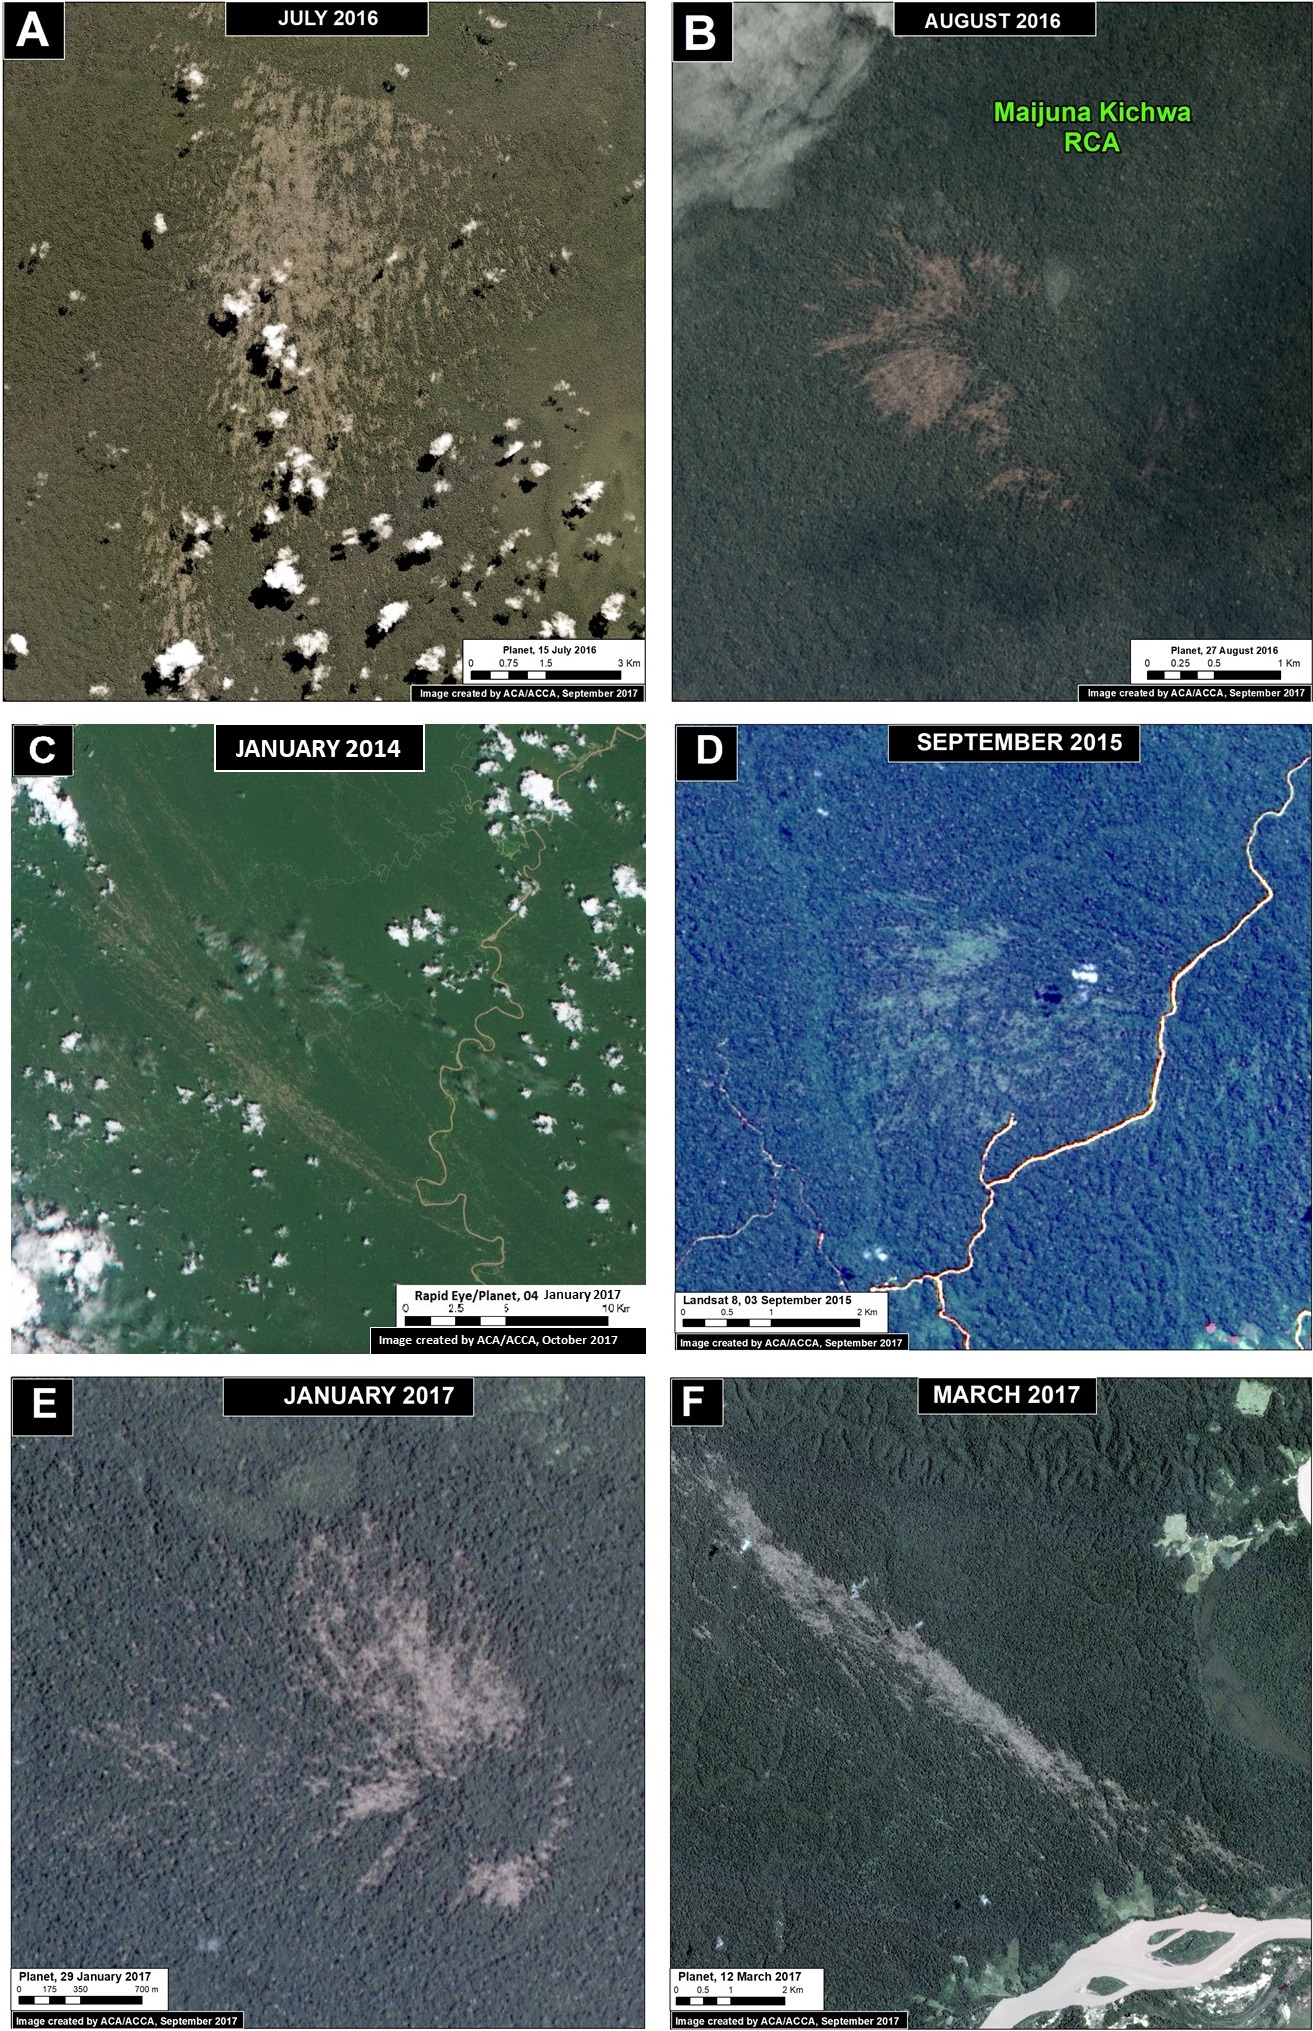
Below, we show satellite images of some of the major hurricane wind events. The letters (A-F) correspond the the locations in Image 70.
Methodology
- To determine the natural forest loss areas, we utilized the forest loss data from the GEOBOSQUES’ portal of the PNCBCC – MINAM, as well as the forest loss data from the University of Maryland, through their Global Forest Change portal that provides data from 2001 – 2015. We decided to evaluate both database due to the different criteria for excluding areas in remote locations. For the analysis, it was only considered events resulting in forest loss of 30 hectares or higher.
- We determined the natural forest loss through the visual interpretation of the fan-shaped pattern of these natural phenomena. This pattern was then validated with the high and medium resolution images from the years where the loss were detected.
- Identifying the period in the year where these events happened, for the years 2015, 2016 and 2017 was determined initially under the Julian calendar that is compatible with the table of attributes of the forest loss database. Consequently, we utilized major series of continuous high resolution images to reduce the timeframe in which these event could have occurred.
References
Planet Team (2017). Planet Application Program Interface: In Space for Life on Earth. San Francisco, CA. https://api.planet.com.
Citation
Novoa S, Finer M (2017) Hurricane Winds in the Last 12 Years in Peru. MAAP: 70.


