As deforestation continues to threaten primary forest across the Amazon, key land use designations are one of the best hopes for the long-term conservation of critical remaining intact forests.
Here, we evaluate the impact of two of the most important: protected areas & indigenous territories.
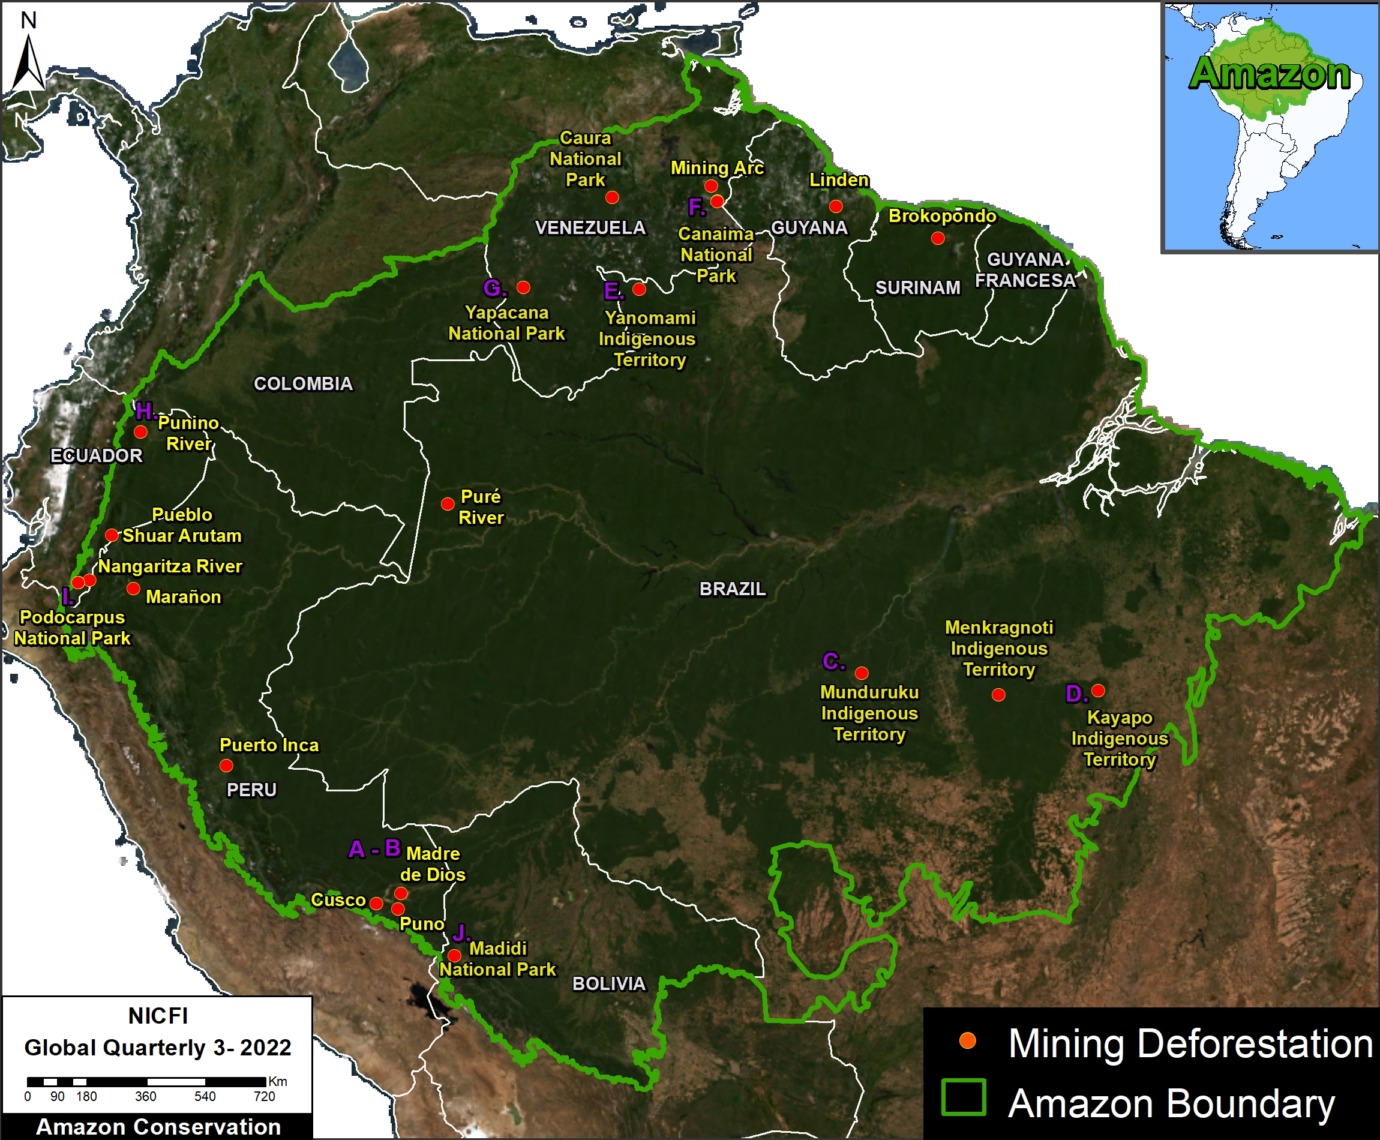
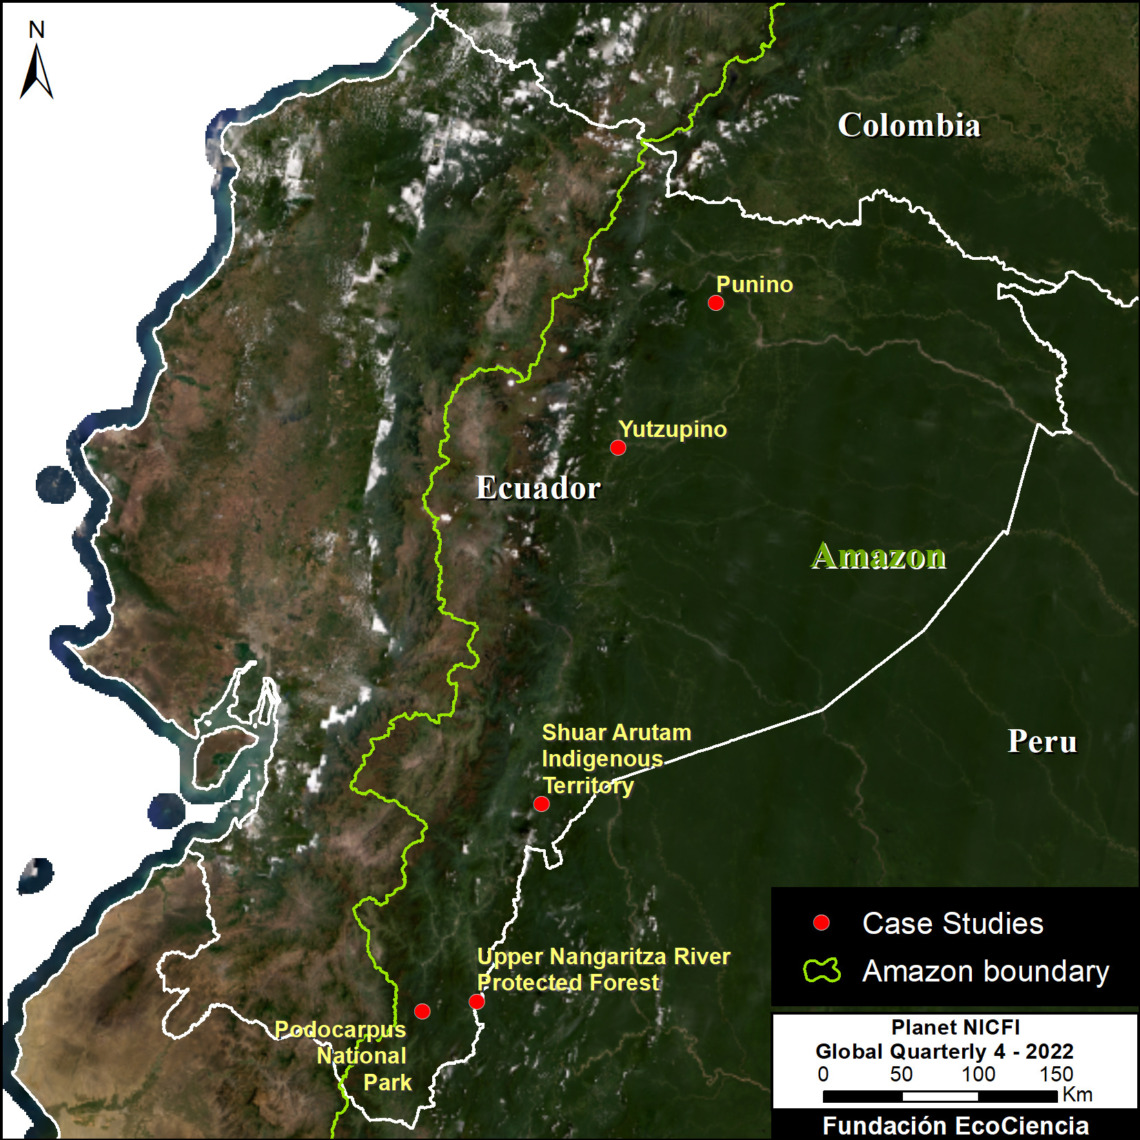
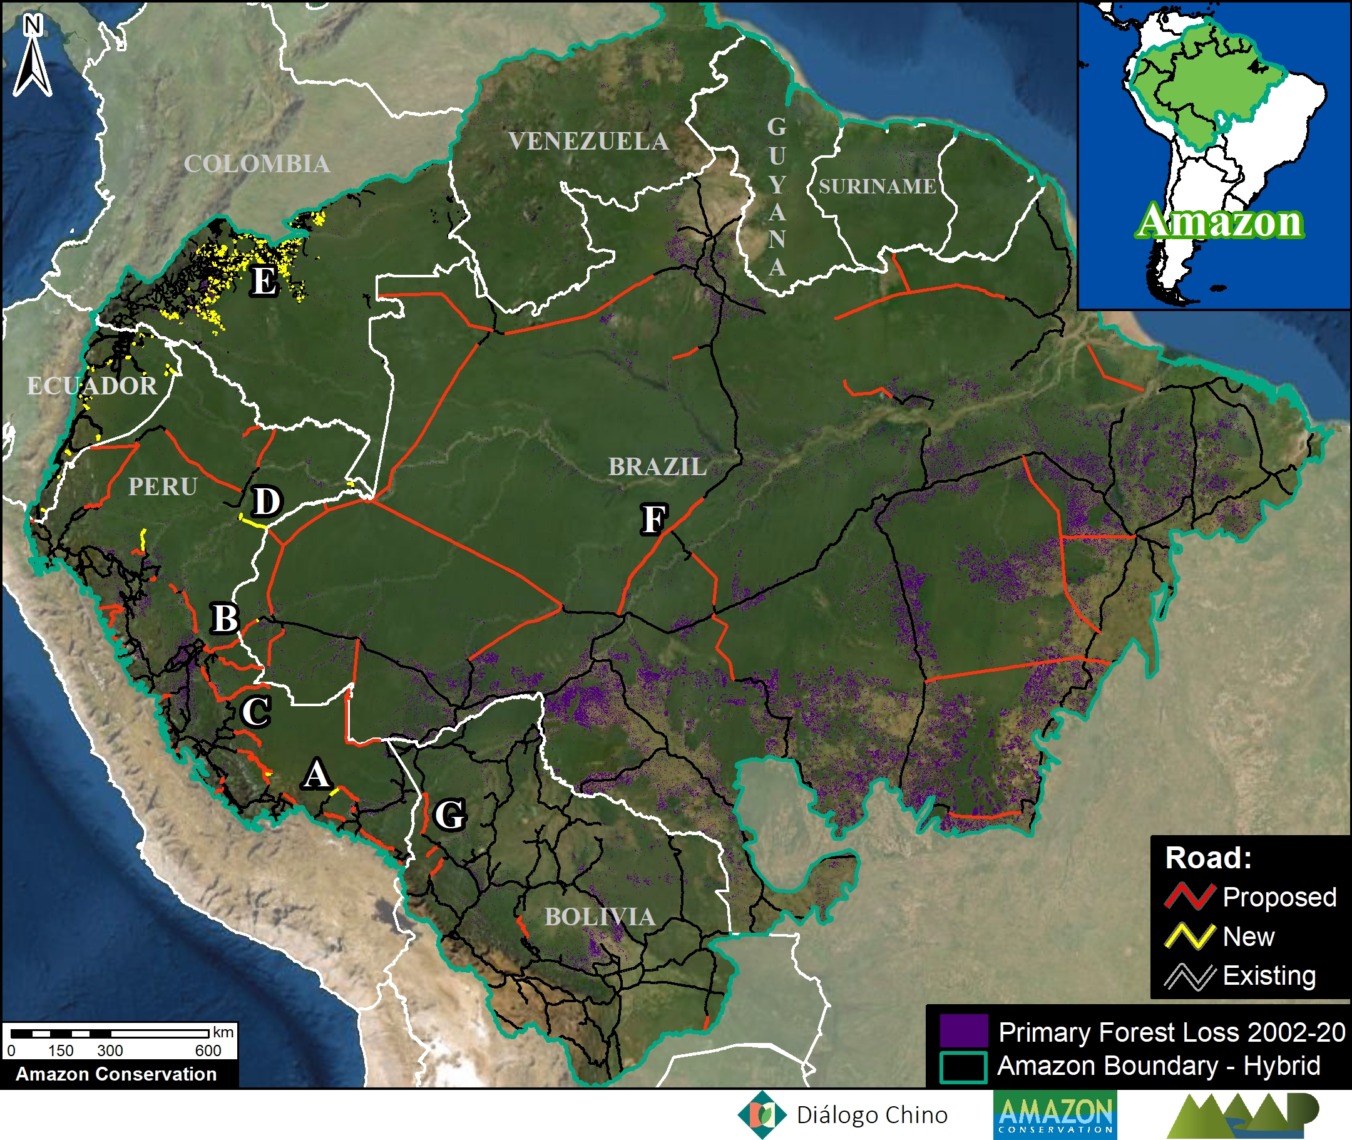
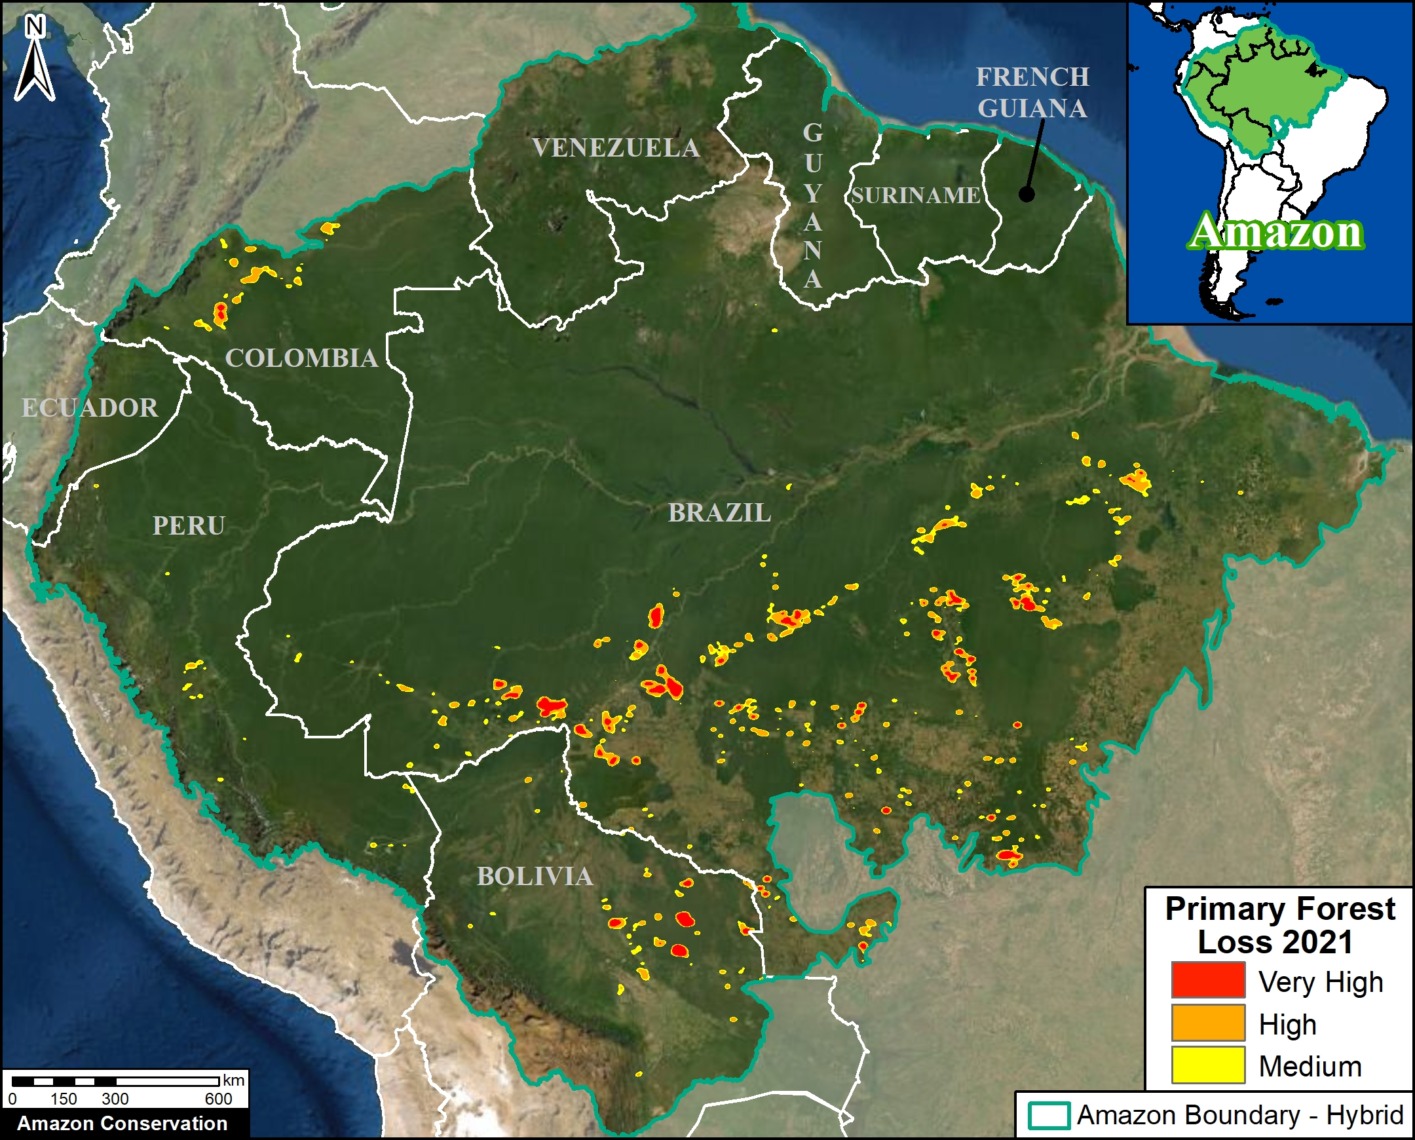
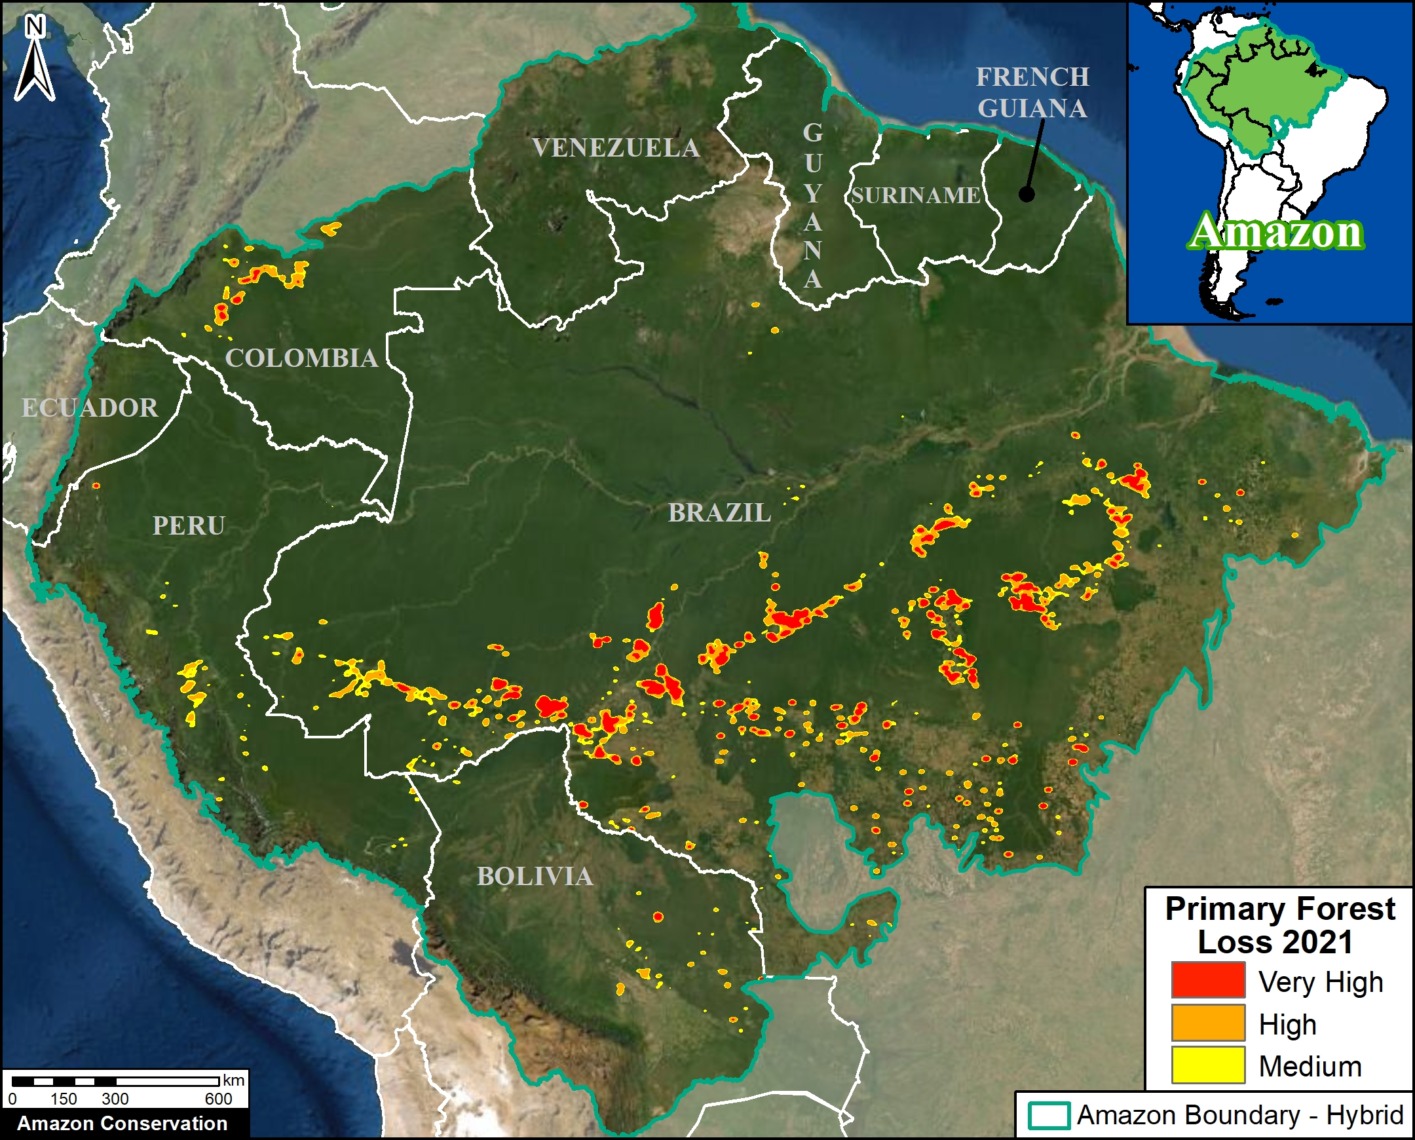
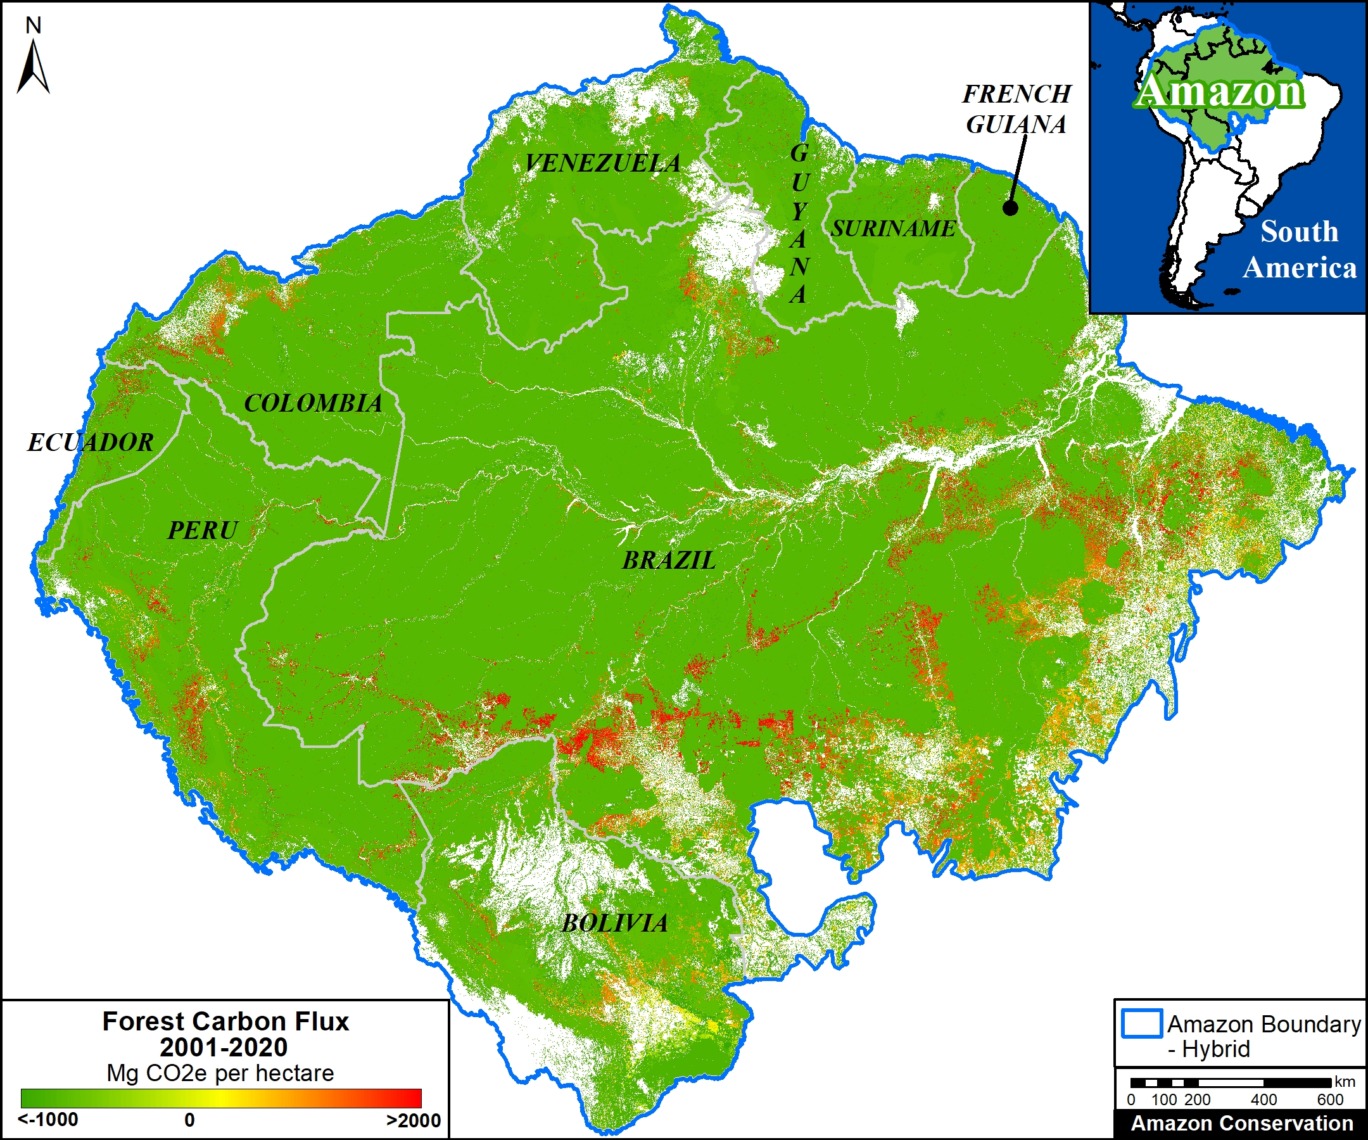
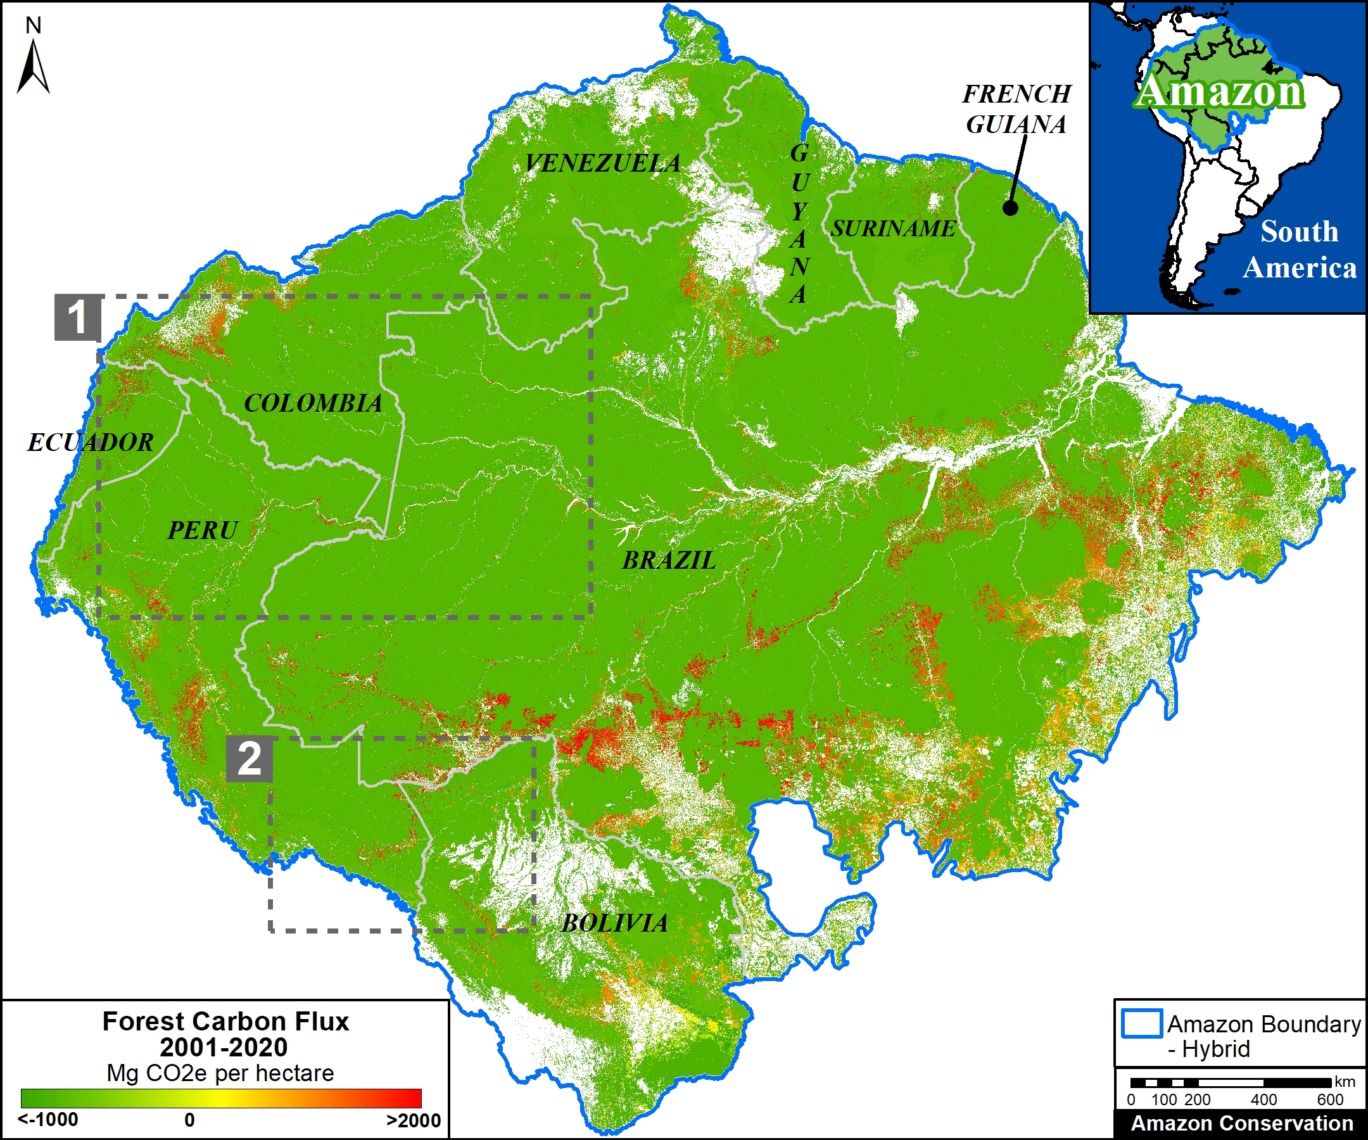
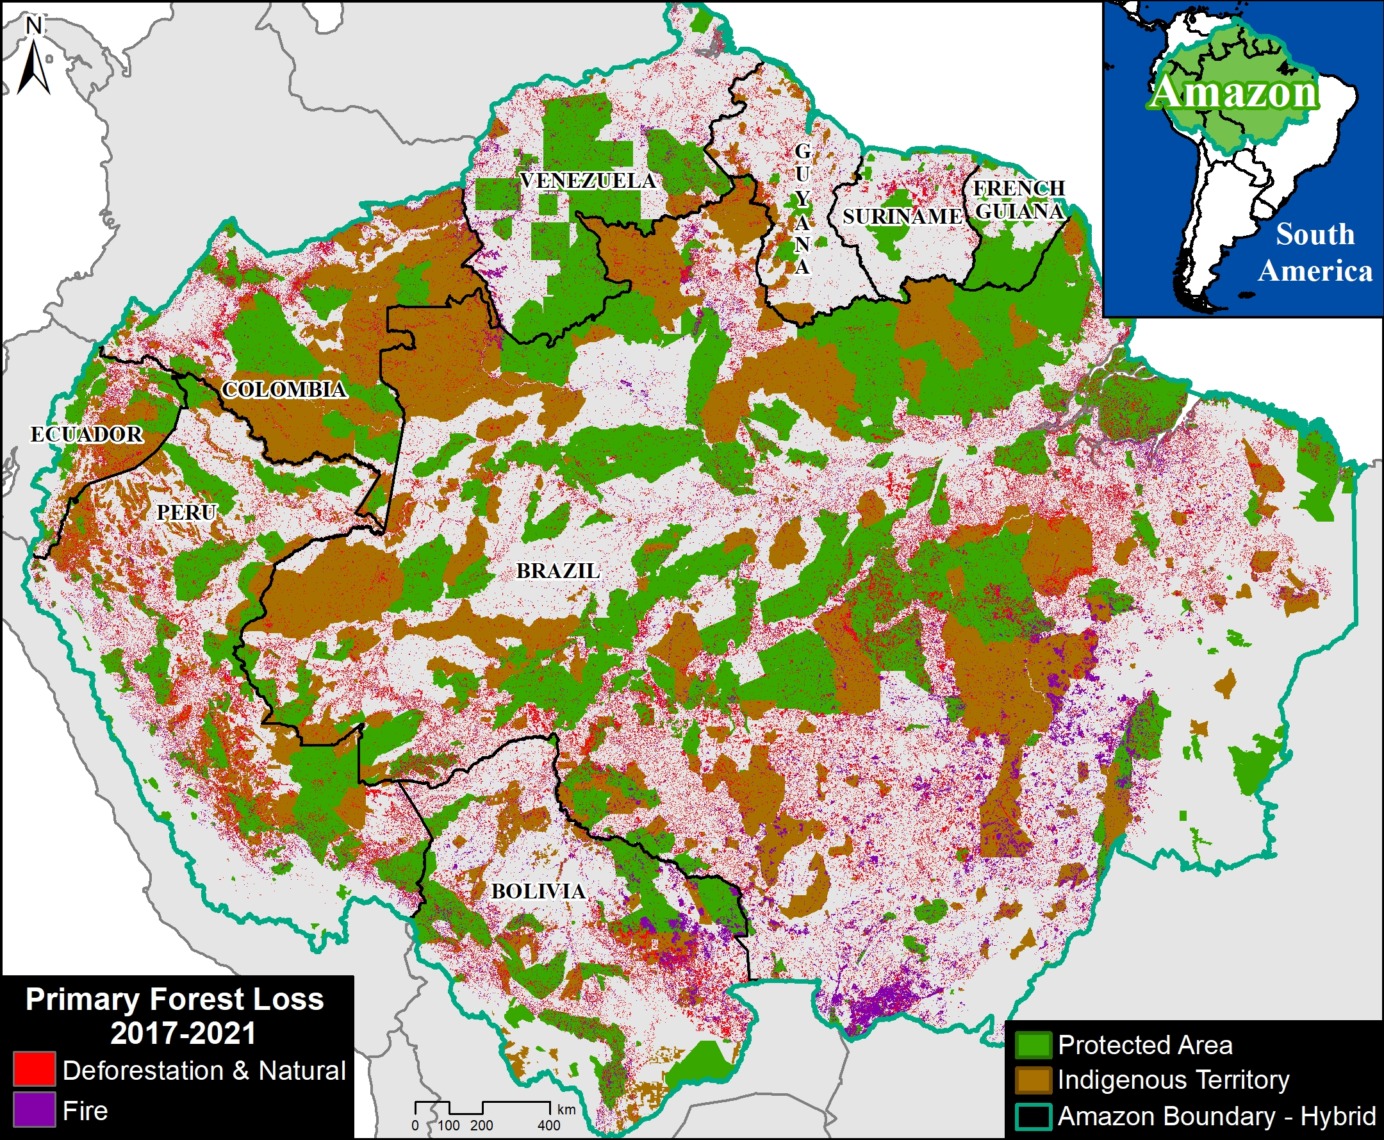
Our study looked across all nine countries of the Amazon biome, a vast area of 883.7 million hectares (see Base Map).
We calculated primary forest loss over the past 5 years (2017-2021).
For the first time, we were able to distinguish fire vs non-fire forest loss. For non-fire, while this does include natural events (such as landslides and wind storms), we consider this our best proxy for human-caused deforestation.
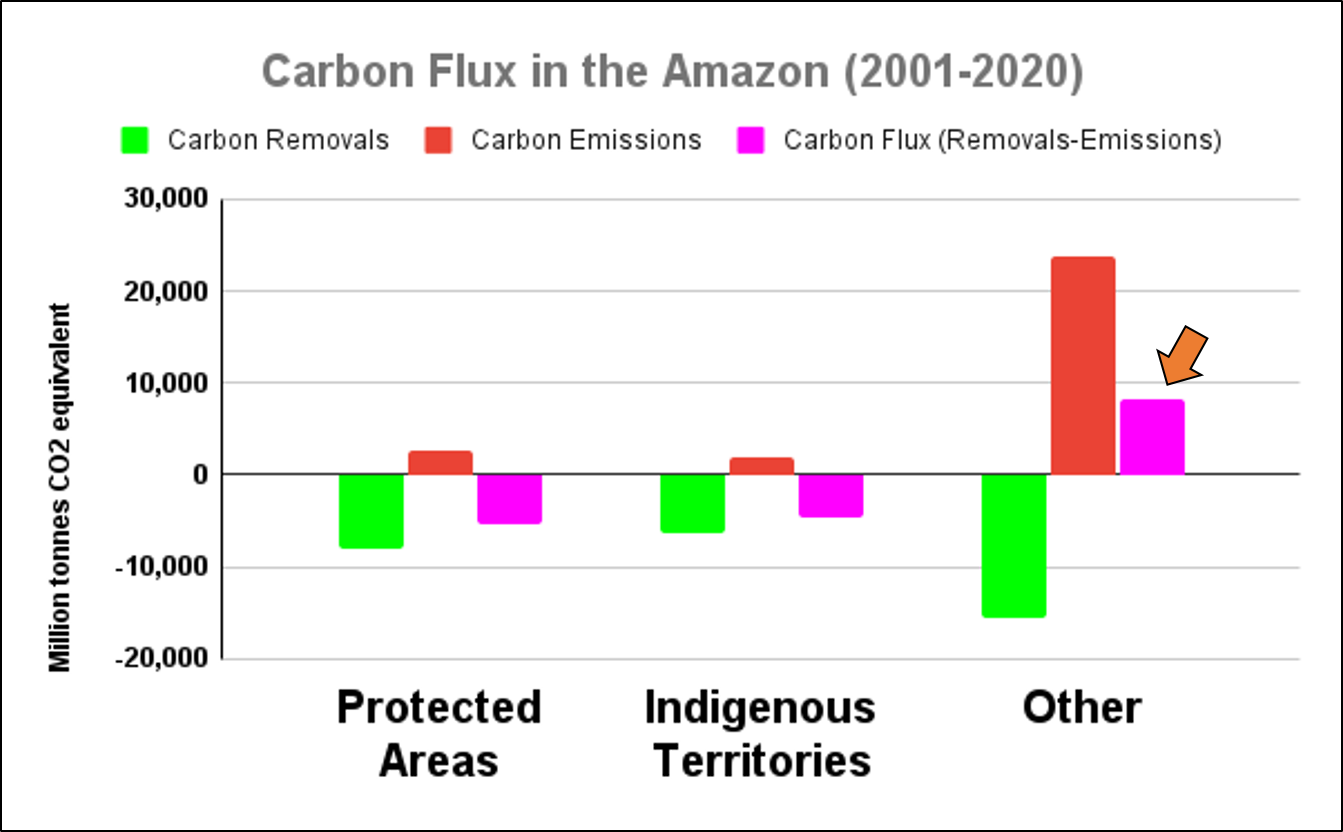
We analyzed the results across three major land use categories:
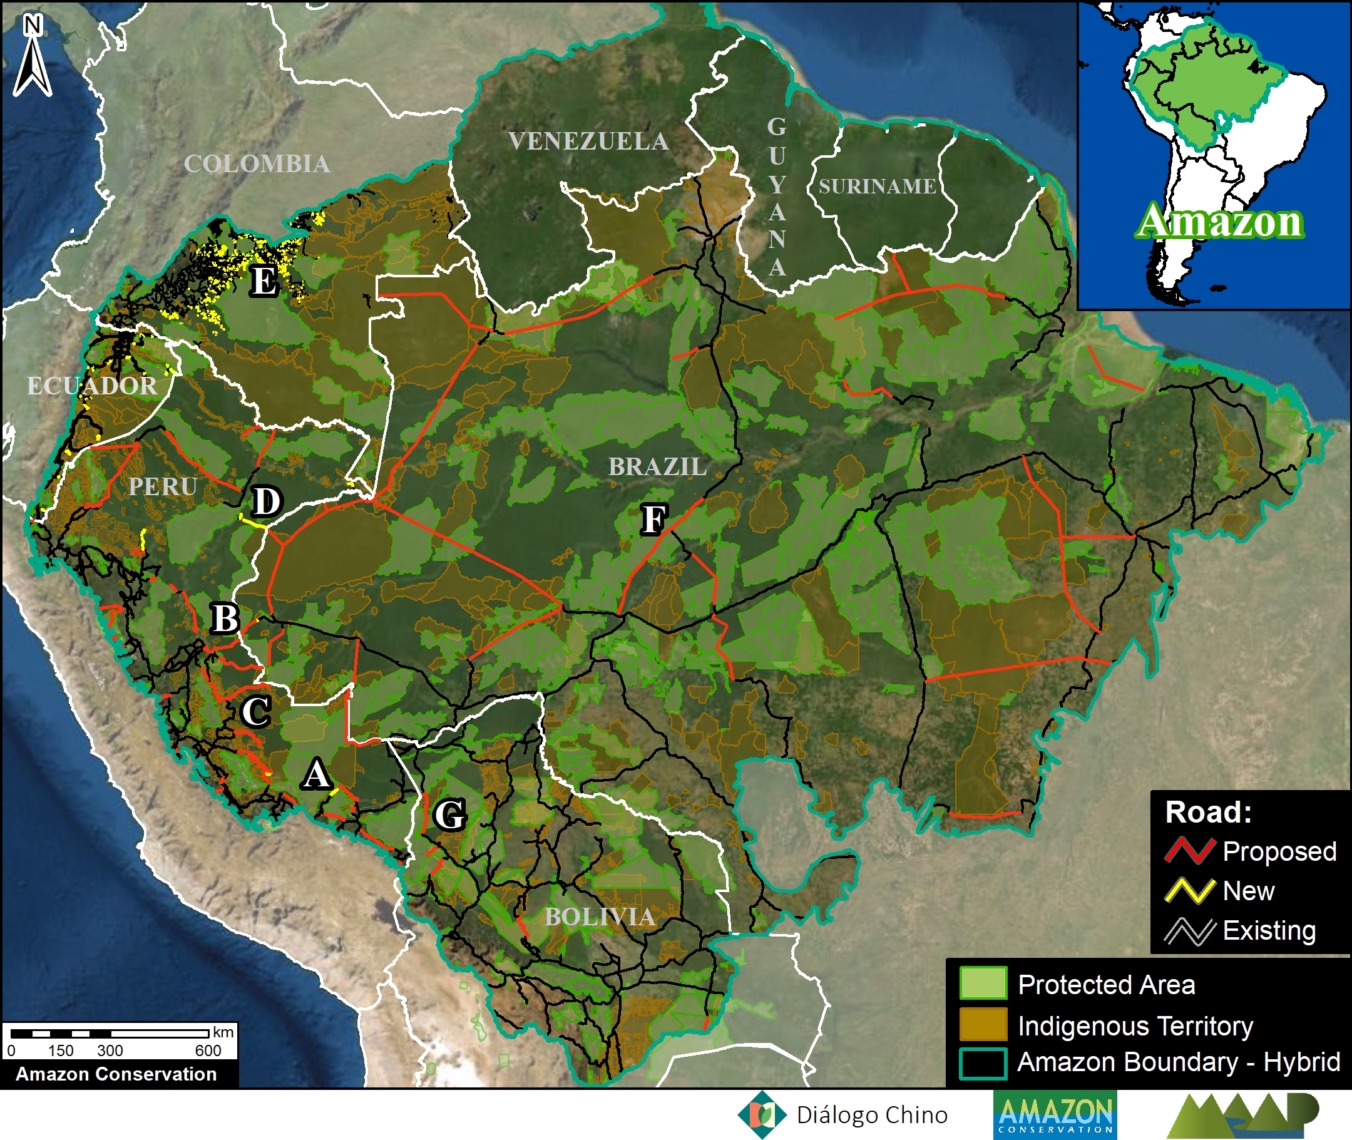
1) Protected Areas (national and state/department levels), which cover 197 million hectares (23.6% of Amazon).
2) Indigenous Territories (official), which cover 163.8 million hectares (19.6% of Amazon).
3) Other (all remaining areas outside protected areas and indigenous territories), which cover 473 million hectares (56.7% of Amazon).
In summary, we found that deforestation was the primary driver of forest loss, with fire always being a smaller subset. Averaged across all 5 years, protected areas and indigenous territories had similar levels of effectiveness, reducing primary forest loss rate by 3x compared to areas outside of these designations.
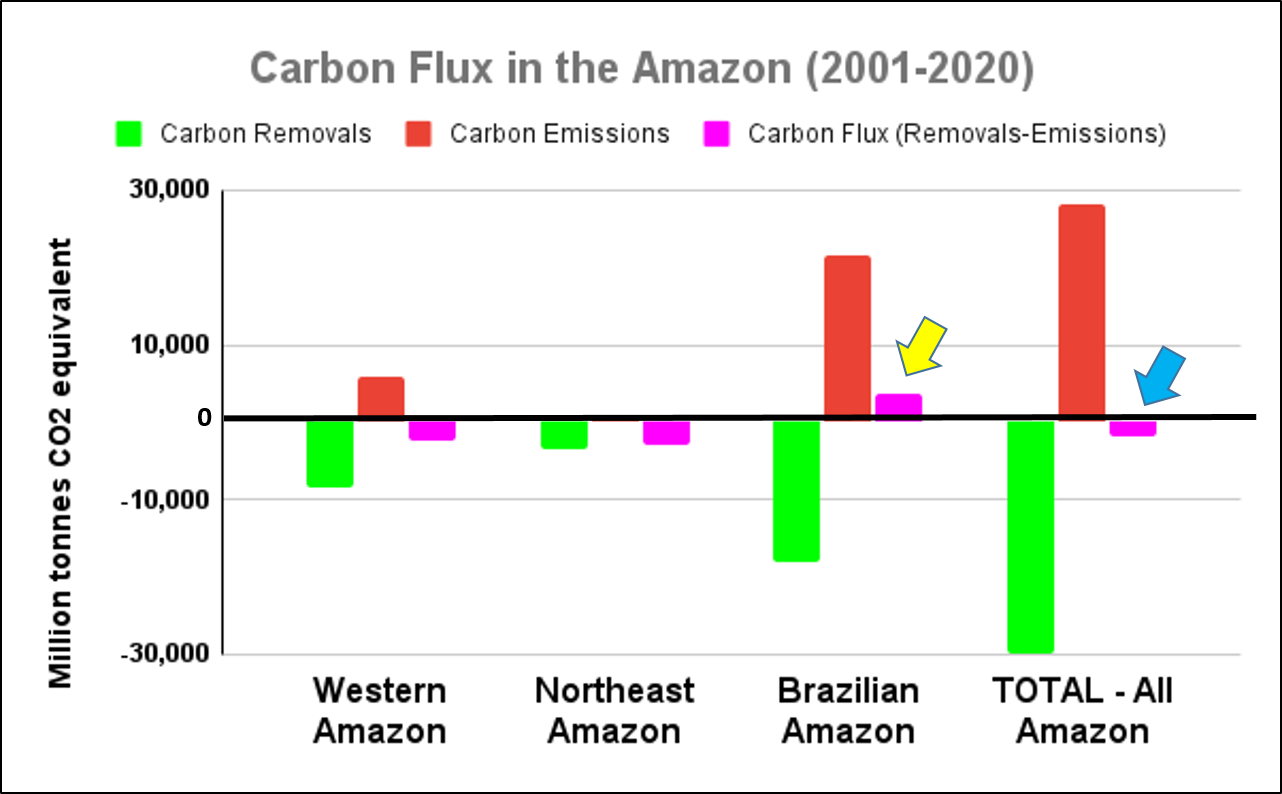
Below, we show the key results across the Amazon in greater detail, including a breakdown for the western Amazon (Bolivia, Colombia, Ecuador, and Peru) and the Brazilian Amazon.
Key Findings
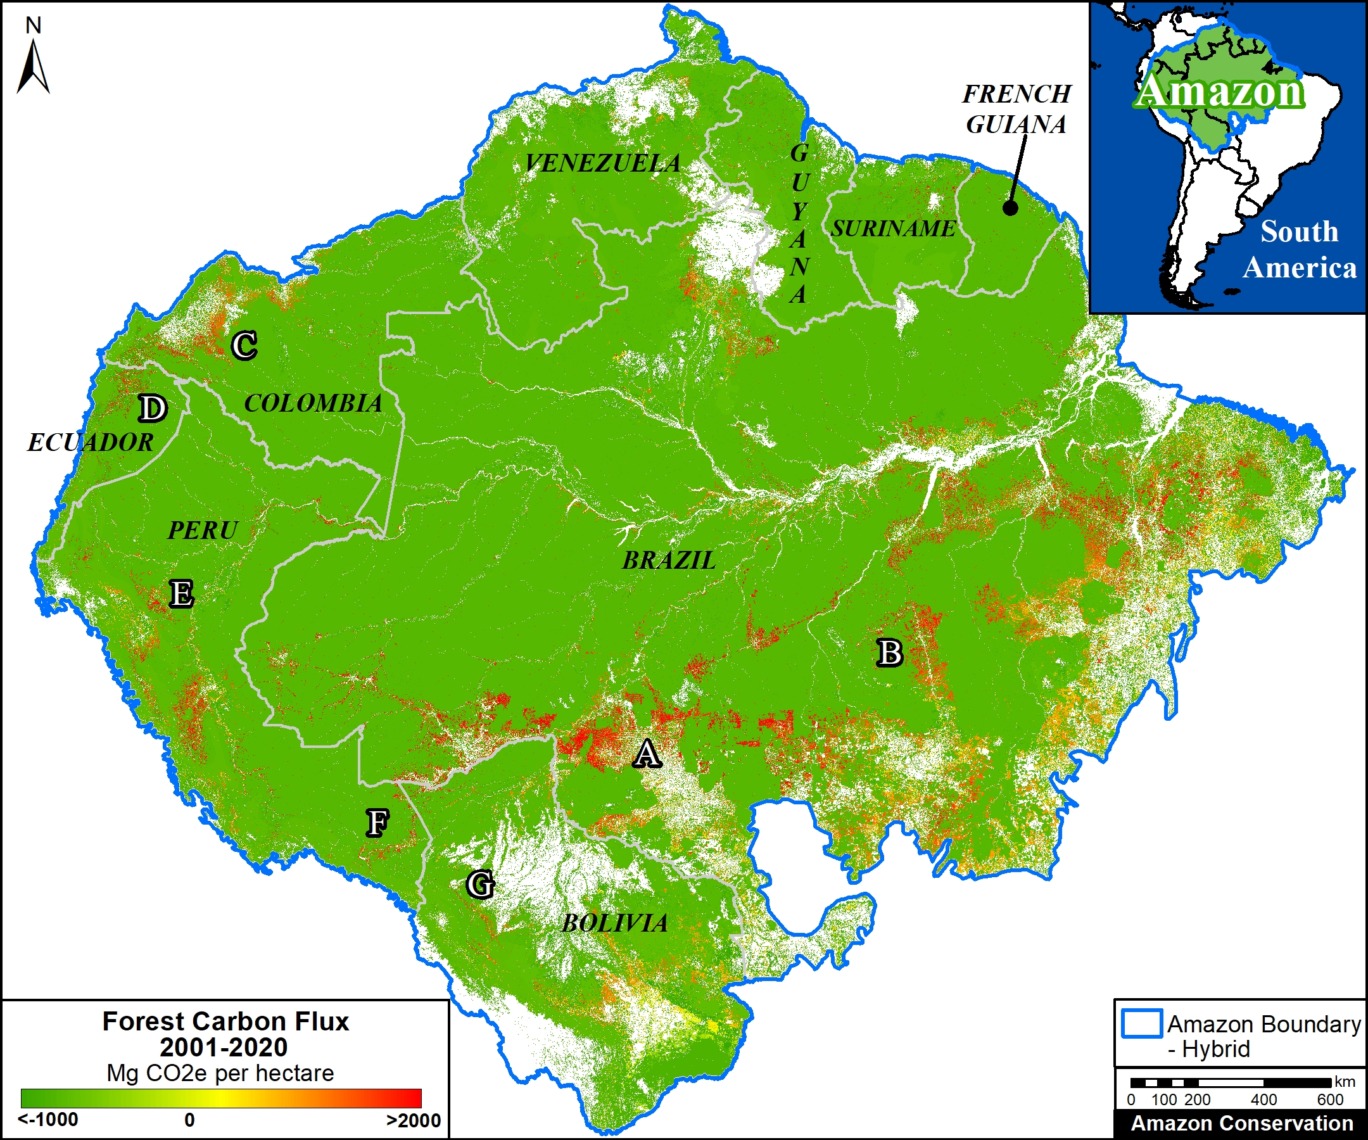
Amazon Biome
We documented the loss of 11 million hectares of primary forests across all nine countries of the Amazon biome between 2017 and 2021. Of this total, 71% was non-fire (deforestation and natural) and 29% was fire.
For the major land use categories, 11% of the forest loss occurred in both protected areas and indigenous territories, respectively, while the remaining 78% occurred outside these designations.
To standardize these results for the varying area coverages, we calculated annual primary forest loss rates (loss/total area of each category). Figure 1 displays the results for these rates across all nine countries of the Amazon biome.
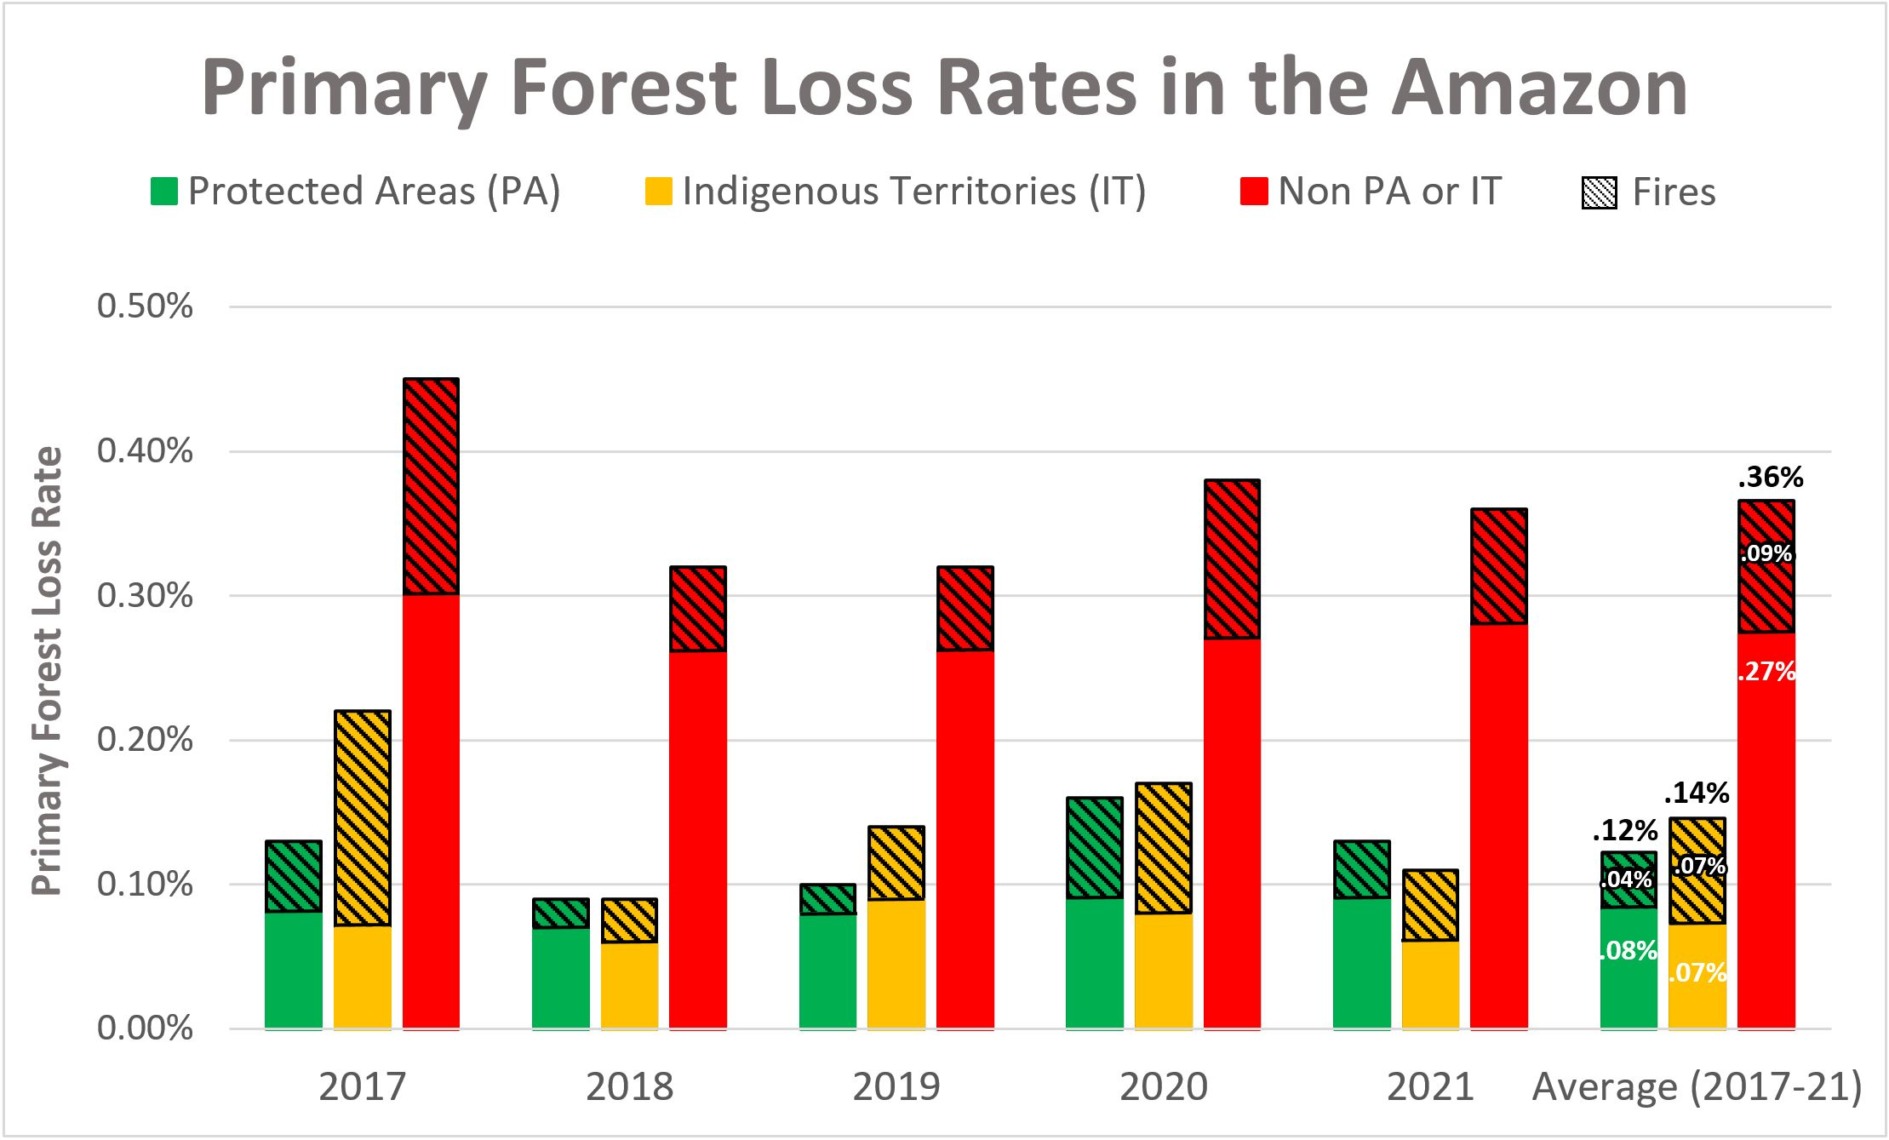
Broken down by year, 2017 had the highest forest loss rates, with both a severe deforestation and fire season. In addition, 2021 had the second highest deforestation rate, while 2020 had the second highest fire loss rate.
Averaged across all five years, protected areas (green) had the lowest overall primary forest loss rate (0.12%), closely followed by indigenous territories (0.14%).
Interestingly, indigenous territories (orange) actually had a slightly lower deforestation rate compared to protected areas (0.7 vs 0.8%), but higher fire loss rate (o.7 vs .04%), resulting in the overall higher forest loss rate noted above.
Outside of these designations (red), the primary forest loss rate was triple (.36%), especially due to much higher deforestation.
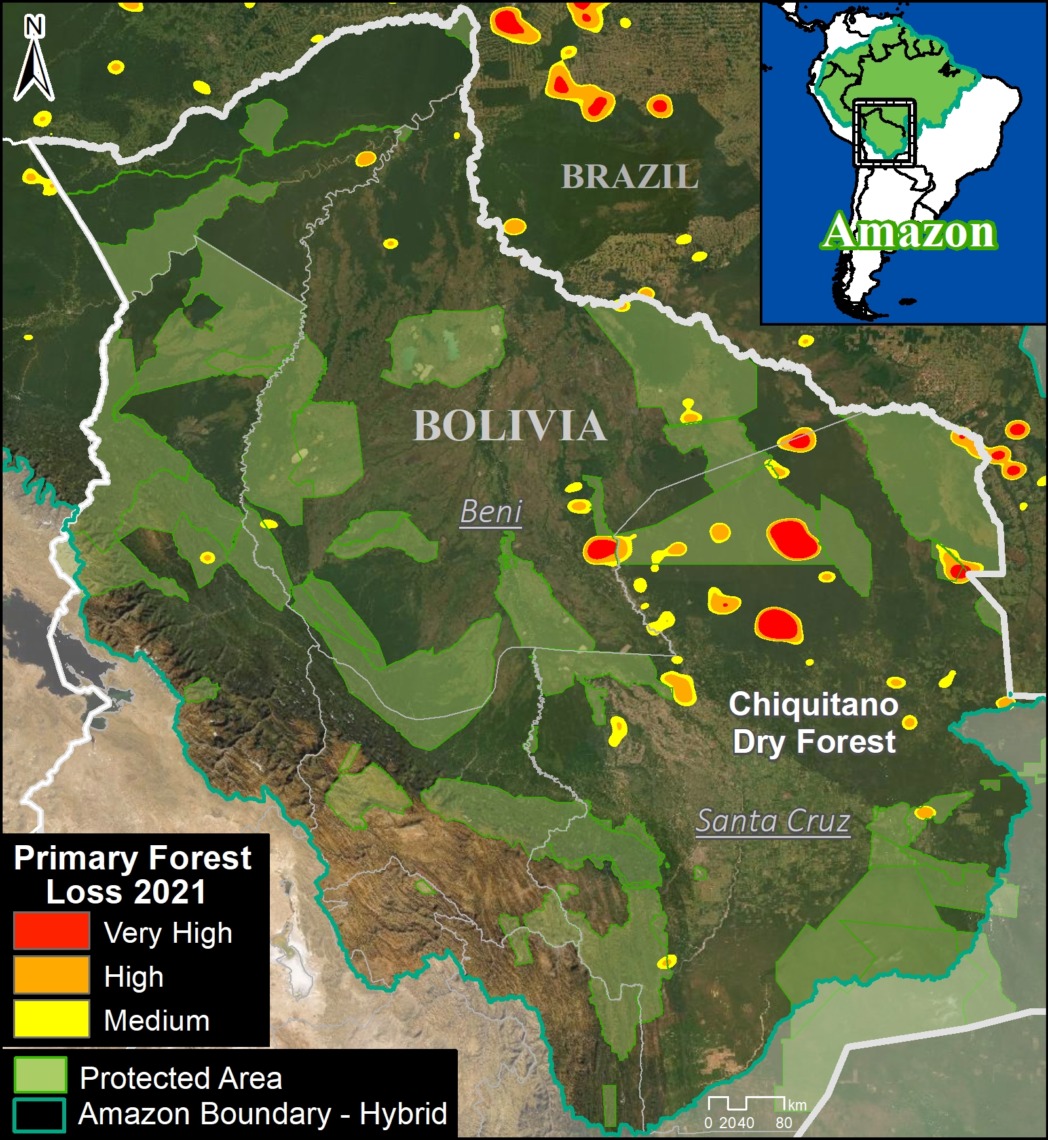
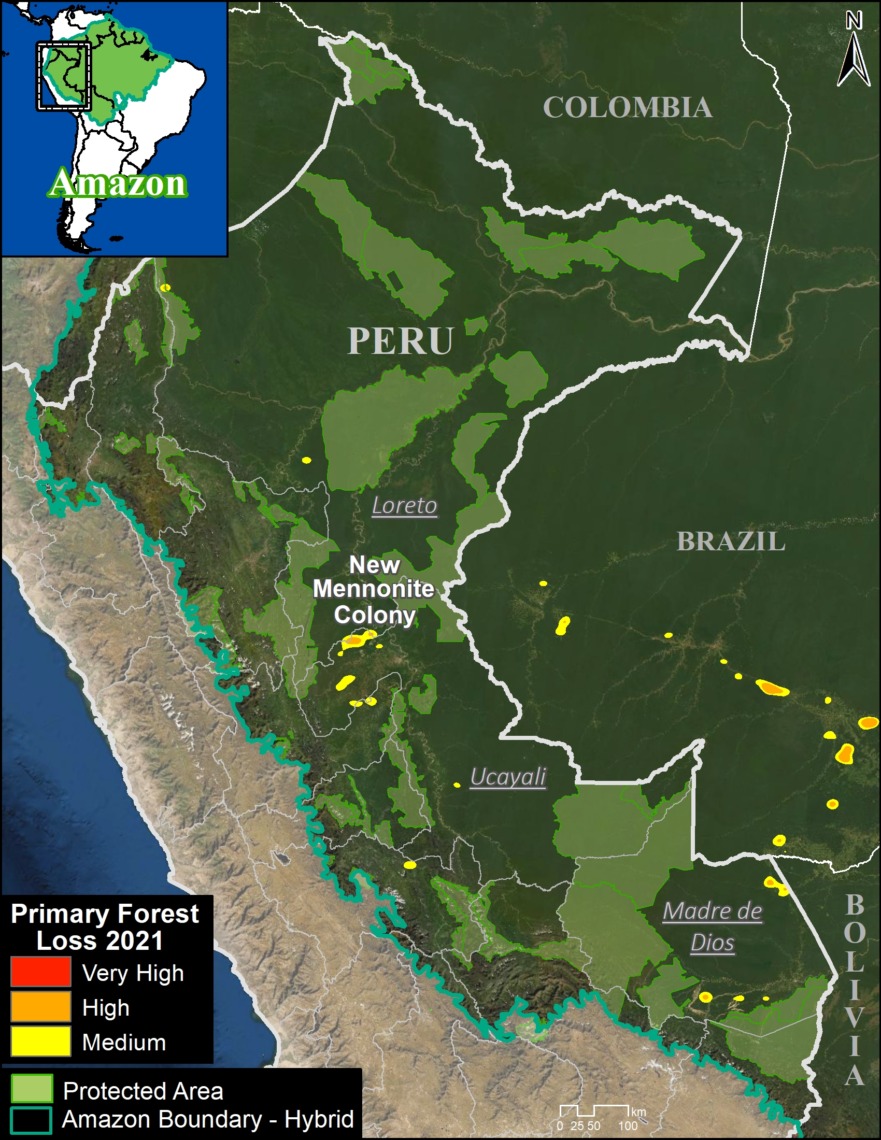
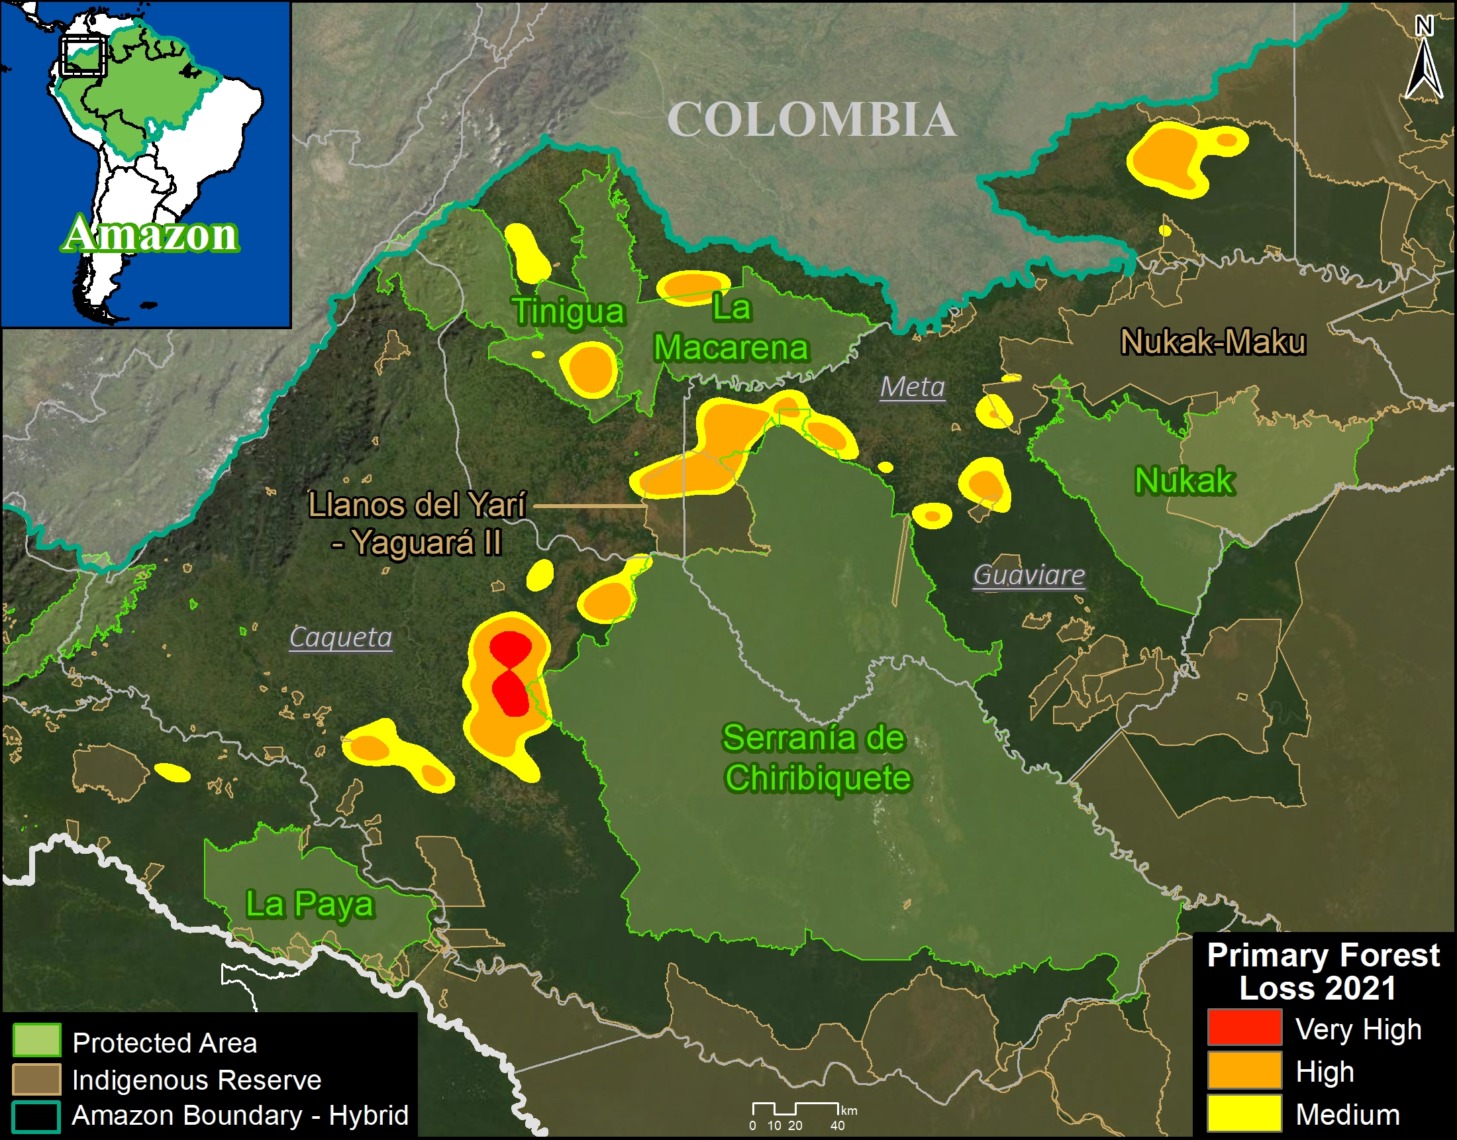
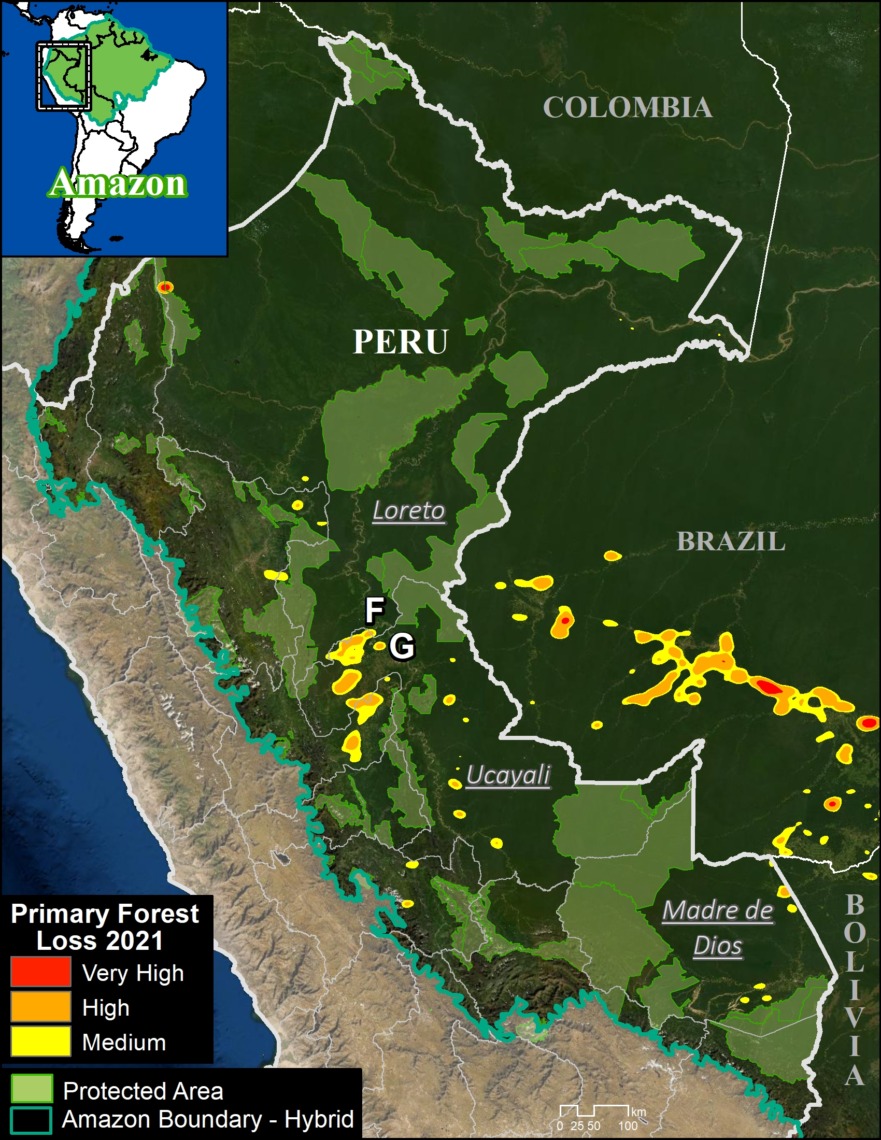
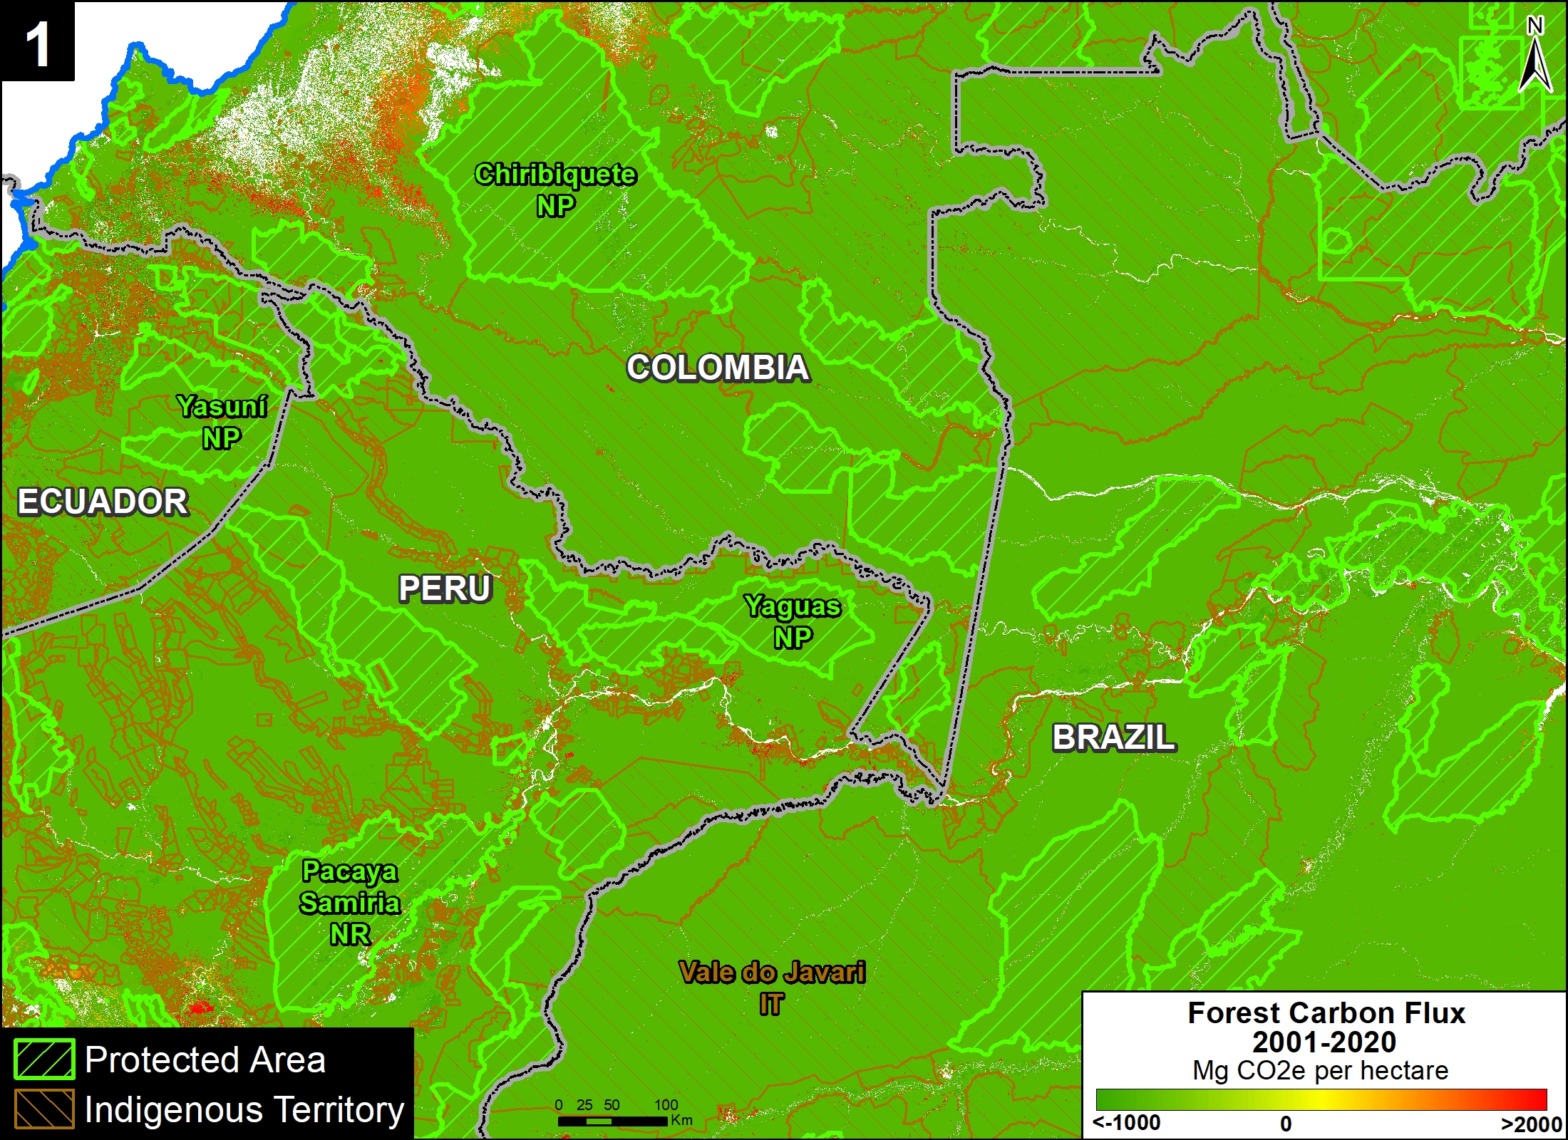
Western Amazon
Breaking the results down specifically for the western Amazon (Bolivia, Colombia, Ecuador, and Peru), we documented the loss of 2.6 million hectares of primary forests between 2017 and 2021. Of this total, 80% was non-fire (deforestation and natural) and 20% was fire.
For the major land use categories, 9.6% occurred in protected areas, 15.6% in indigenous territories, and the remaining 74.8% occurred outside these designations.
Figure 2 displays the standardized primary forest loss rates across the western Amazon.

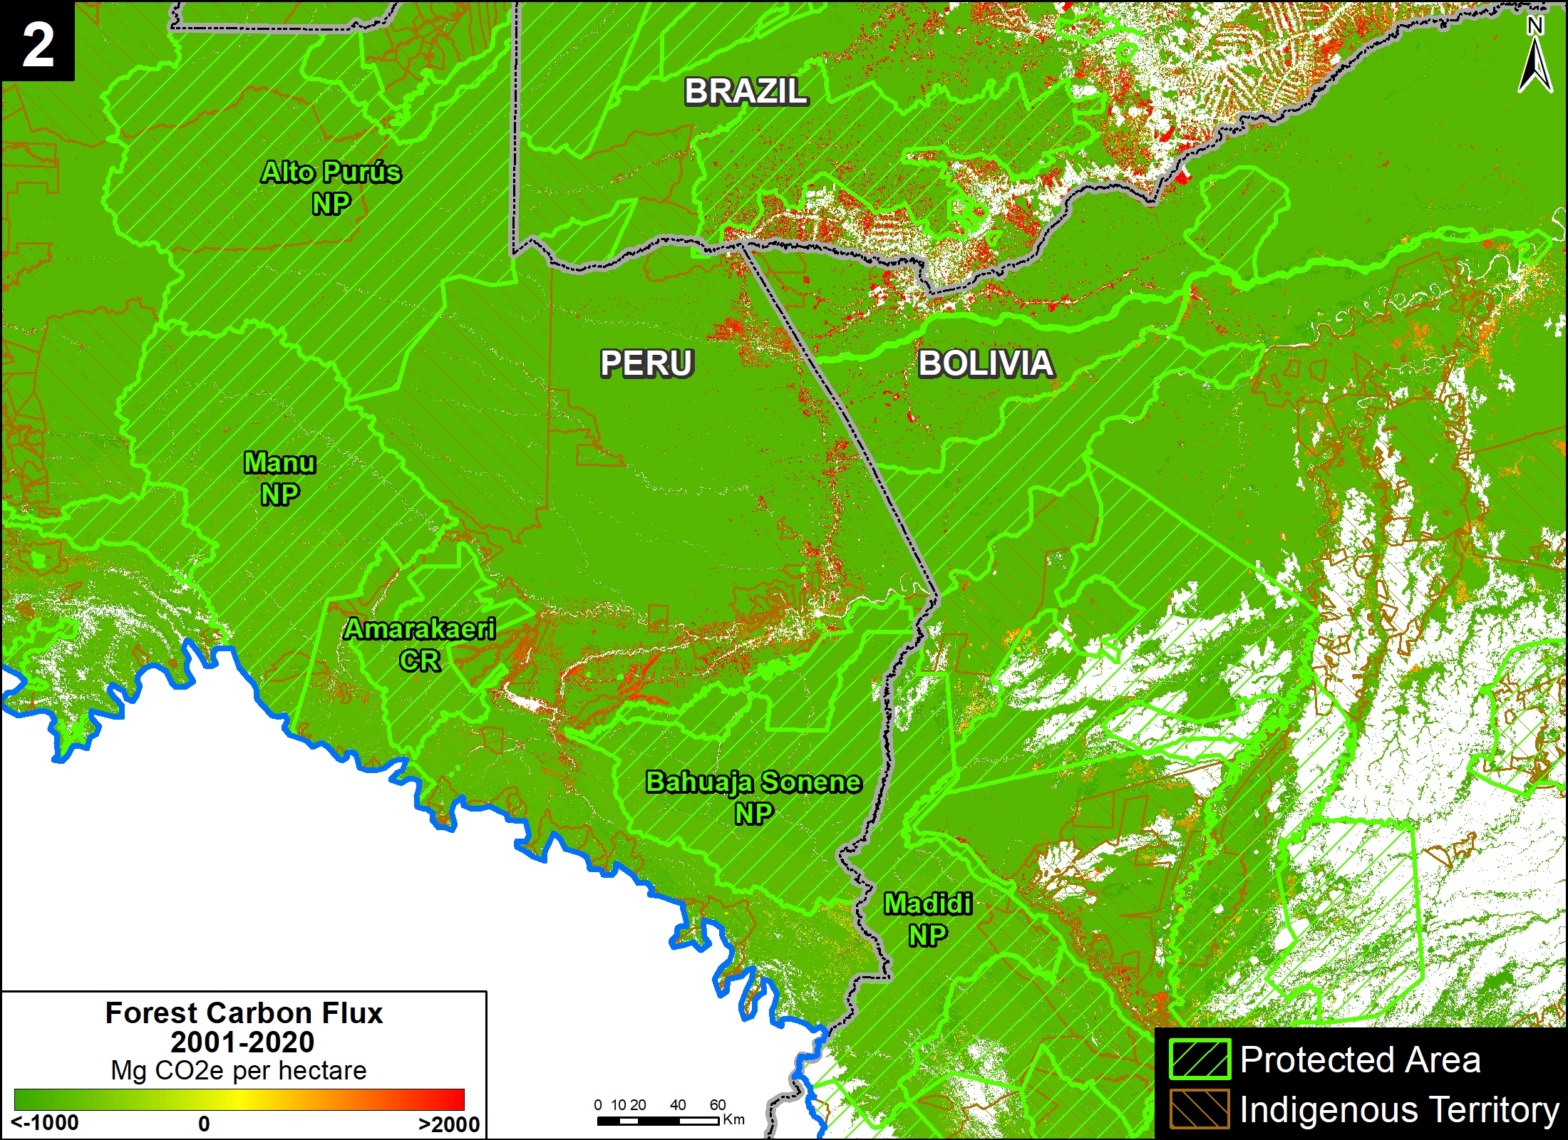
Broken down by year, 2017 had the highest deforestation rate and overall forest loss rates. But 2020 had the highest fire loss rate, mainly due to extensive fires in Bolivia. 2021 also had a relatively high deforestation rate. Also, note the high level of fires in protected areas in 2020 and 2021, and indigenous territories in 2019.
Averaged across all five years, protected areas had the lowest overall primary forest loss rate (0.11%), followed by indigenous territories (0.16%).
Outside of these designations, the primary forest loss rate was .30%. That is, triple the protected areas rate and double the indigenous territories rate.
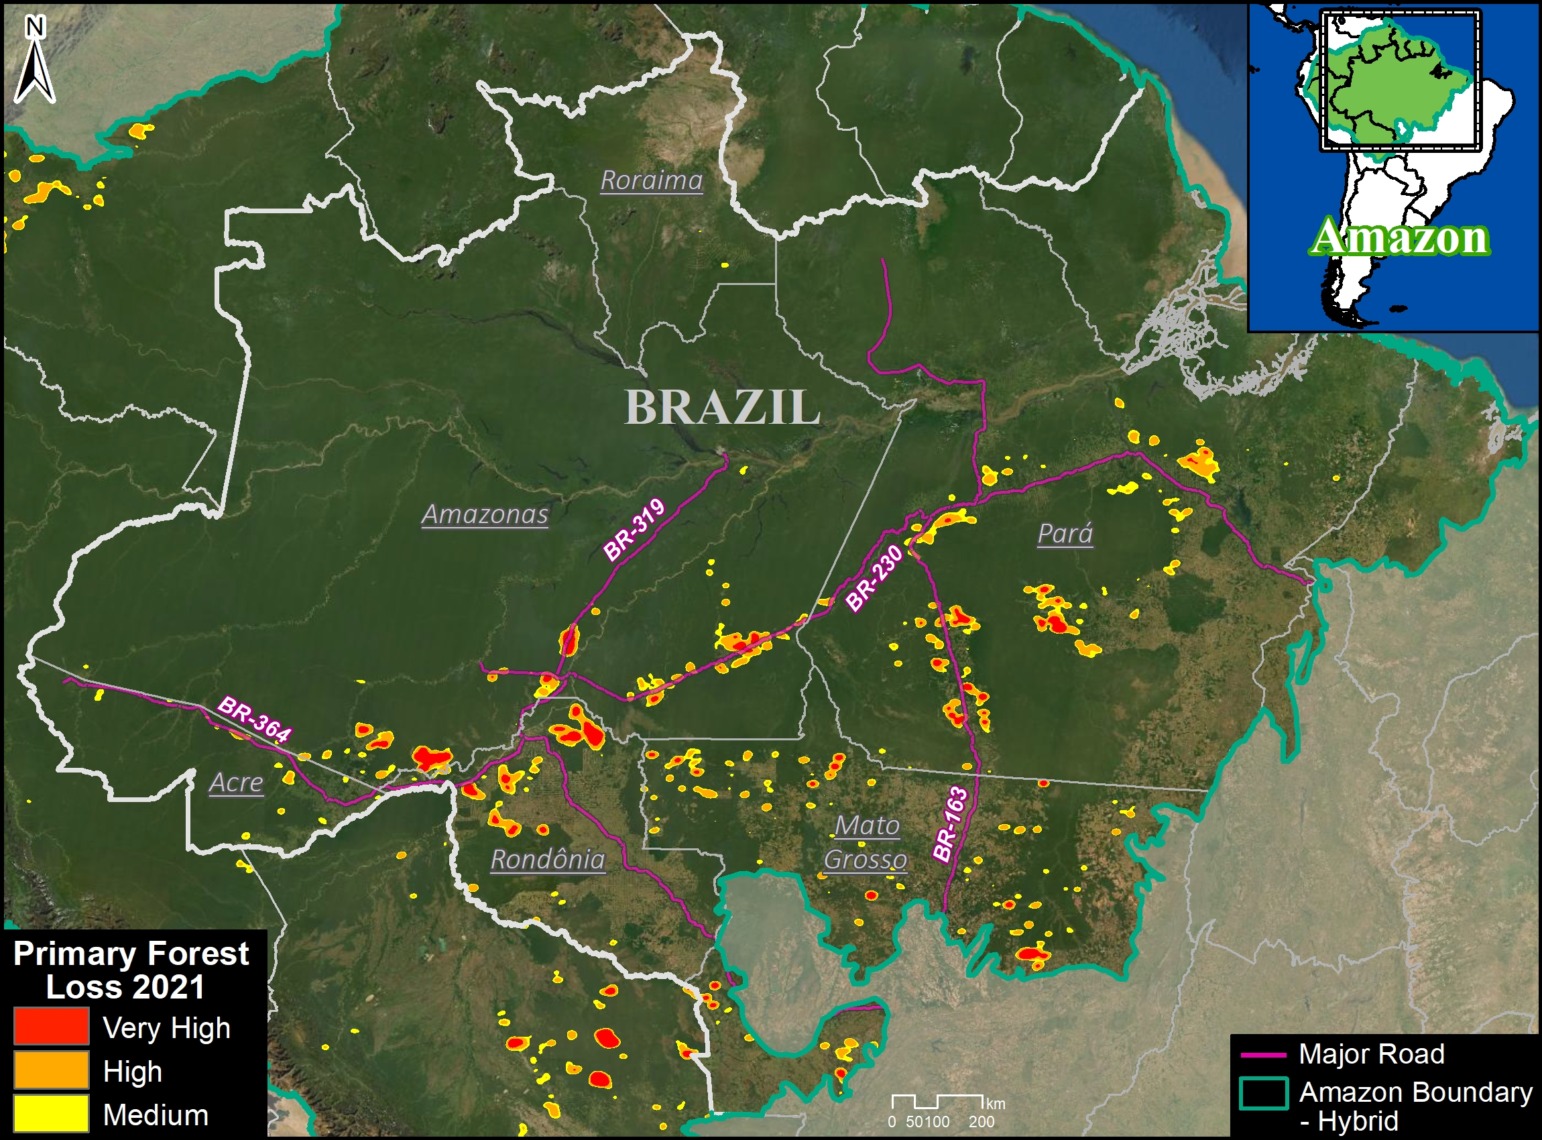
Brazilian Amazon
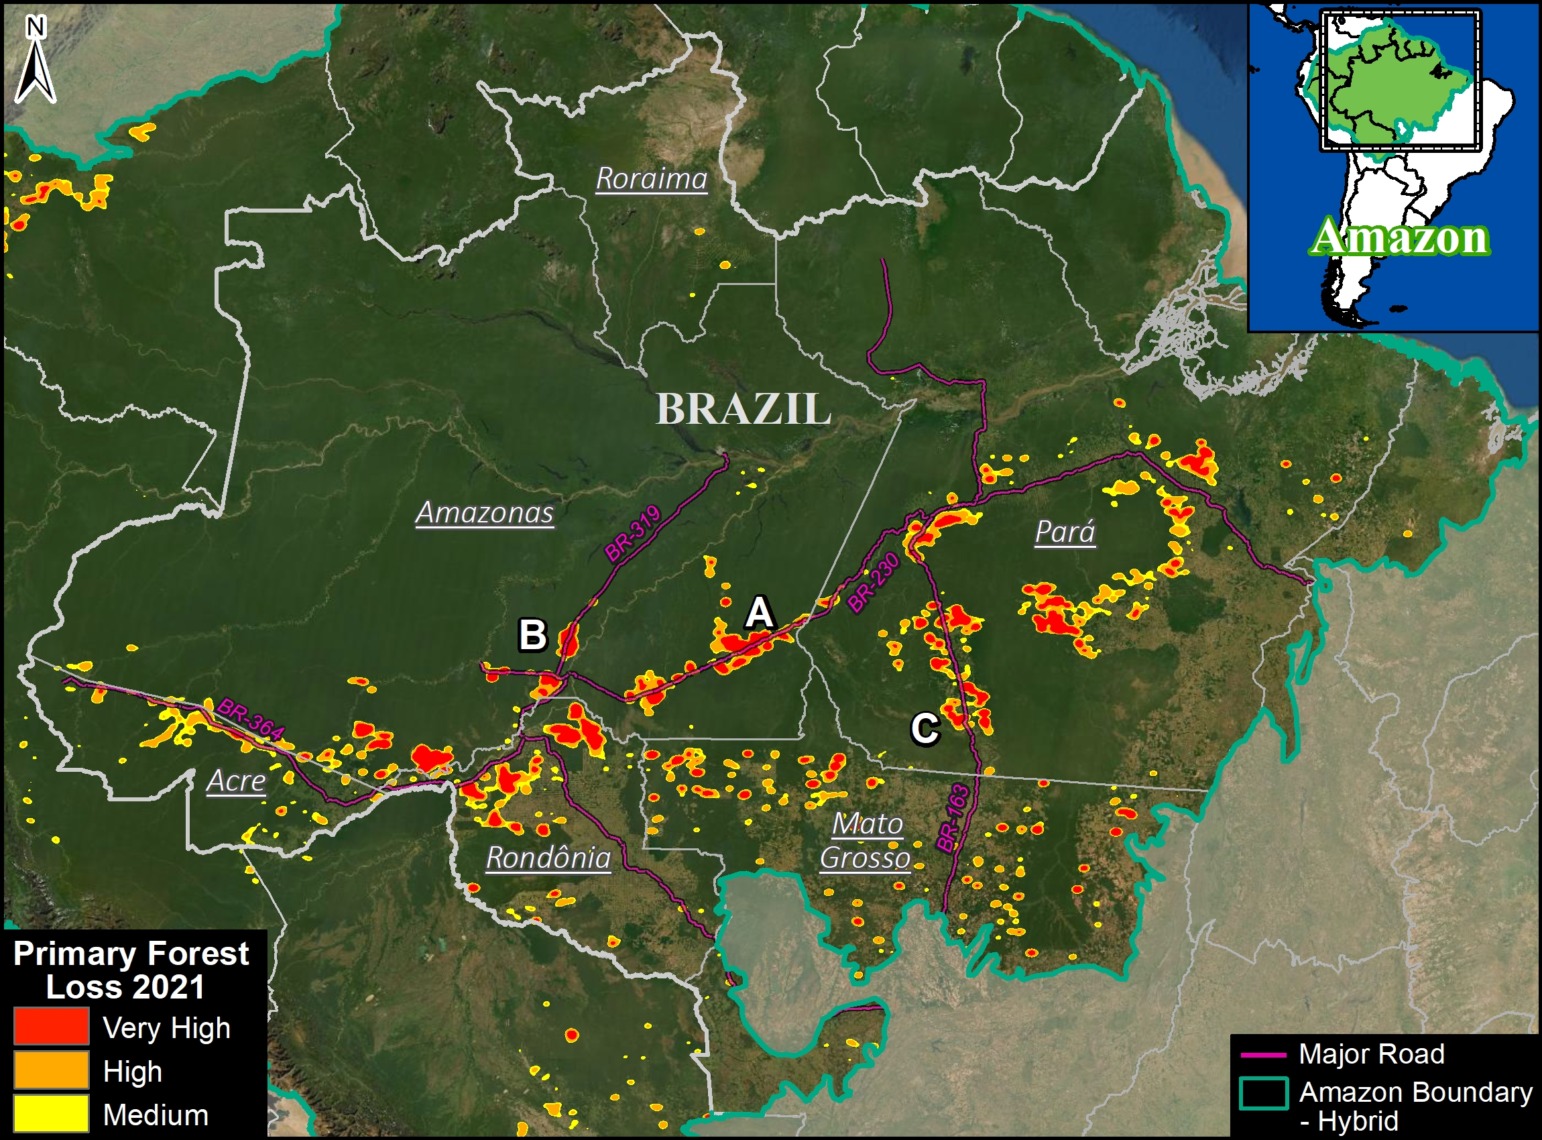
Breaking the results down specifically for the Brazilian Amazon, we documented the loss of 8.1 million hectares of primary forests between 2017 and 2021. Of this total, 68% was non-fire (deforestation and natural) and 32% was fire.
For the major land use categories, 9.4% occurred in indigenous territories, 11.2% occurred in protected areas, and the remaining 79.4% occurred outside these designations.
Figure 3 displays the standardized primary forest loss rates across the Brazilian Amazon.
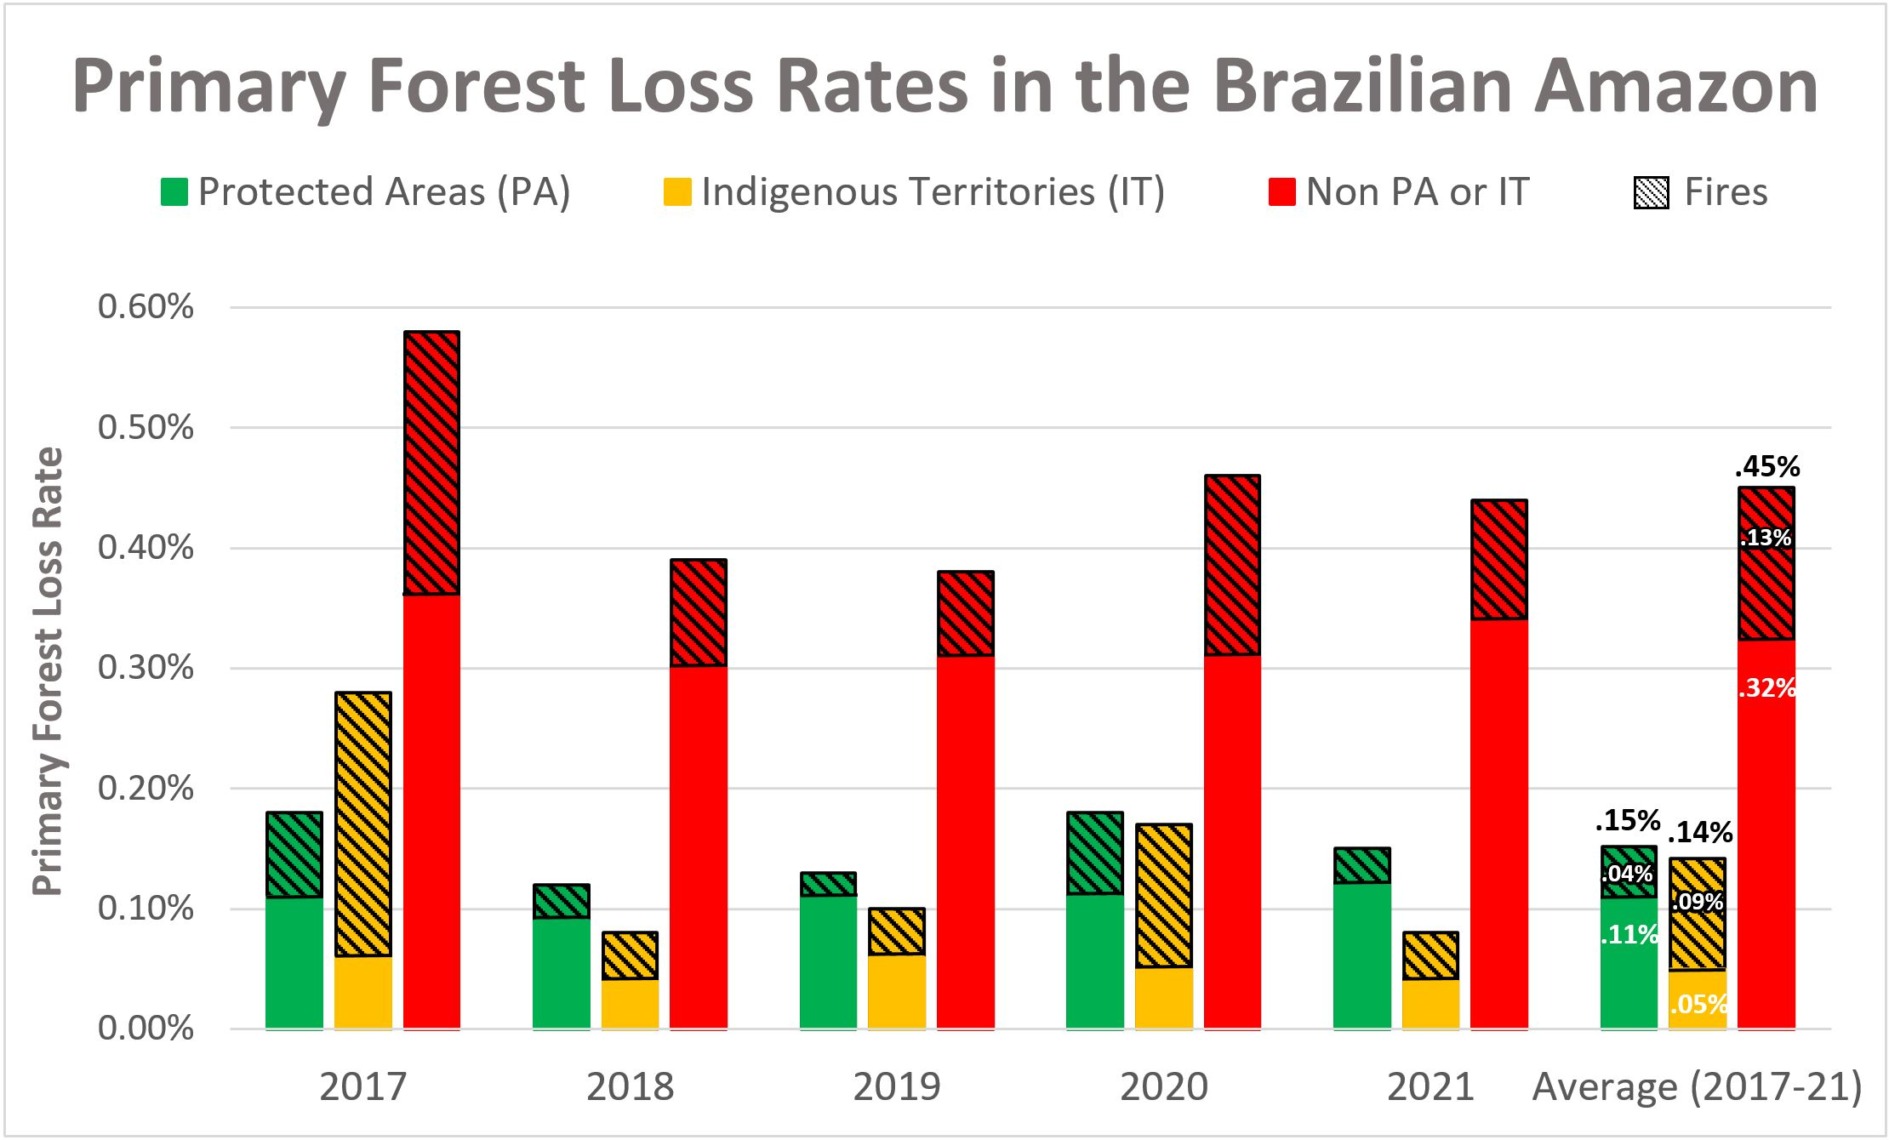
Broken down by year, 2017 had the highest forest loss rate recorded in the entire study (.58%), due to both elevated deforestation and fire. Note that indigenous territories were particularly impacted by fire in 2017.
2020 had the next highest forest loss rate, also driven by an intense fire season. Fires were not as severe the following year in 2021, but deforestation increased.
Averaged across all five years, indigenous territories had the lowest overall primary forest loss rate (0.14%), closely followed by protected areas (0.15%).
Interestingly, indigenous territories had a lower deforestation rate compared to protected areas (0.5 vs 0.11%), but higher fire impact (0.09 vs 0.04%).
Outside of these designations (red), the primary forest loss rate was triple (.45%).
Methodology
To estimate deforestation across all three categories (protected areas, indigenous territories, and other), we used annual forest loss data (2017-21) from the University of Maryland (Global Land Analysis and Discovery GLAD laboratory) to have a consistent source across all countries (Hansen et al 2013).
We obtained this data, which has a 30-meter spatial resolution, from the “Global Forest Loss due to Fires 2000–2021” data download page. It is also possible to visualize and interact with the data on the main Global Forest Change portal.
The annual data is disaggregated into forest loss due to fire vs. non-fire (other disturbance drivers). It is important to note that the non-fire drivers include both human-caused deforestation and forest loss caused by natural forces (landslides, wind storms, etc.).
We also filtered this data for only primary forest loss, following the established methodology of Global Forest Watch. Primary forest is generally defined as intact forest that has not been previously cleared (as opposed to previously cleared secondary forest, for example). We applied this filter by intersecting the forest cover loss data with the additional dataset “primary humid tropical forests” as of 2001 (Turubanova et al 2018). Thus, we often use the term “primary forest loss” to describe this filtered data.
Data presented as primary forest loss rate is standardized per the total area covered of each respective category per year (annual). For example, to properly compare raw forest loss data in areas that are 100 hectares vs 1,000 hectares total size respectively, we divide by the area to standardize the result.
Our geographic range extends from the Andes to the Amazon plain and reaching the transitions with the Cerrado and the Pantanal. This range includes nine countries of the Amazon (or Pan-Amazon region as defined by RAISG) and consists of a combination of the Amazon watershed limit, the Amazon biogeographic limit and the Legal Amazon limit in Brazil. See Base Map above for delineation of this hybrid Amazon limit, designed for maximum inclusion.
Additional data sources include:
- National and state/department level protected areas: RUNAP 2020 (Colombia), SNAP 2022 (Ecuador), SERNAP & ACEAA 2020 (Bolivia), SERNANP 2022 (Peru), INPE/Terrabrasilis 2022 (Brazil), SOS Orinoco 2021 (Venezuela), and RAISG 2020 (Guyana, Suriname, and French Guiana.)
- Indigenous Territories: RAISG & Ecociencia 2022 (Ecuador), INPE/Terrabrasilis 2022 (Brazil), RAISG 2020 (Colombia, Bolivia, Venezuela, Guyana, Suriname, and French Guiana), and MINCU & ACCA 2021 (Peru). For Peru, this includes titled native communities and Indigenous/Territorial Reserves for indigenous groups in voluntary isolation.
For analysis, we categorized Protected Areas first, then Indigenous Territories to avoid overlapping areas. Each category was disaggregated by year created/recognized to match the annual report of forest loss, for example. If a Protected area was created in December 2018, it would be considered within the analysis for the year 2019.
Acknowledgements
This work was supported by the Andes Amazon Fund (AAF), Norwegian Agency for Development Cooperation (NORAD), and International Conservation Fund of Canada (ICFC).
We thank M. MacDowell and M. Cohen for helpful comments on this report.
Citation
Finer M, Mamani N (2023) Protected Areas & Indigenous Territories Effective Against Deforestation Across Amazon. MAAP: 176.