MAAP #215: Unprecedented Look at Carbon across the Amazon (part 1)
August 9, 2024

The Amazon biome has long been one of the world’s largest carbon sinks, helping stabilize the global climate.
Precisely estimating this carbon, however, has been a challenge. Fortunately, new satellite-based technologies are providing major advances, most notably NASA’s GEDI mission (see MAAP #213) and, most recently, Planet Forest Carbon Diligence.1
Here, we focus on the latter, analyzing Planet’s cutting-edge new dataset, featuring a 10-year historical time series (2013 – 2022) with wall-to-wall estimates for aboveground carbon density at 30-meter resolution.
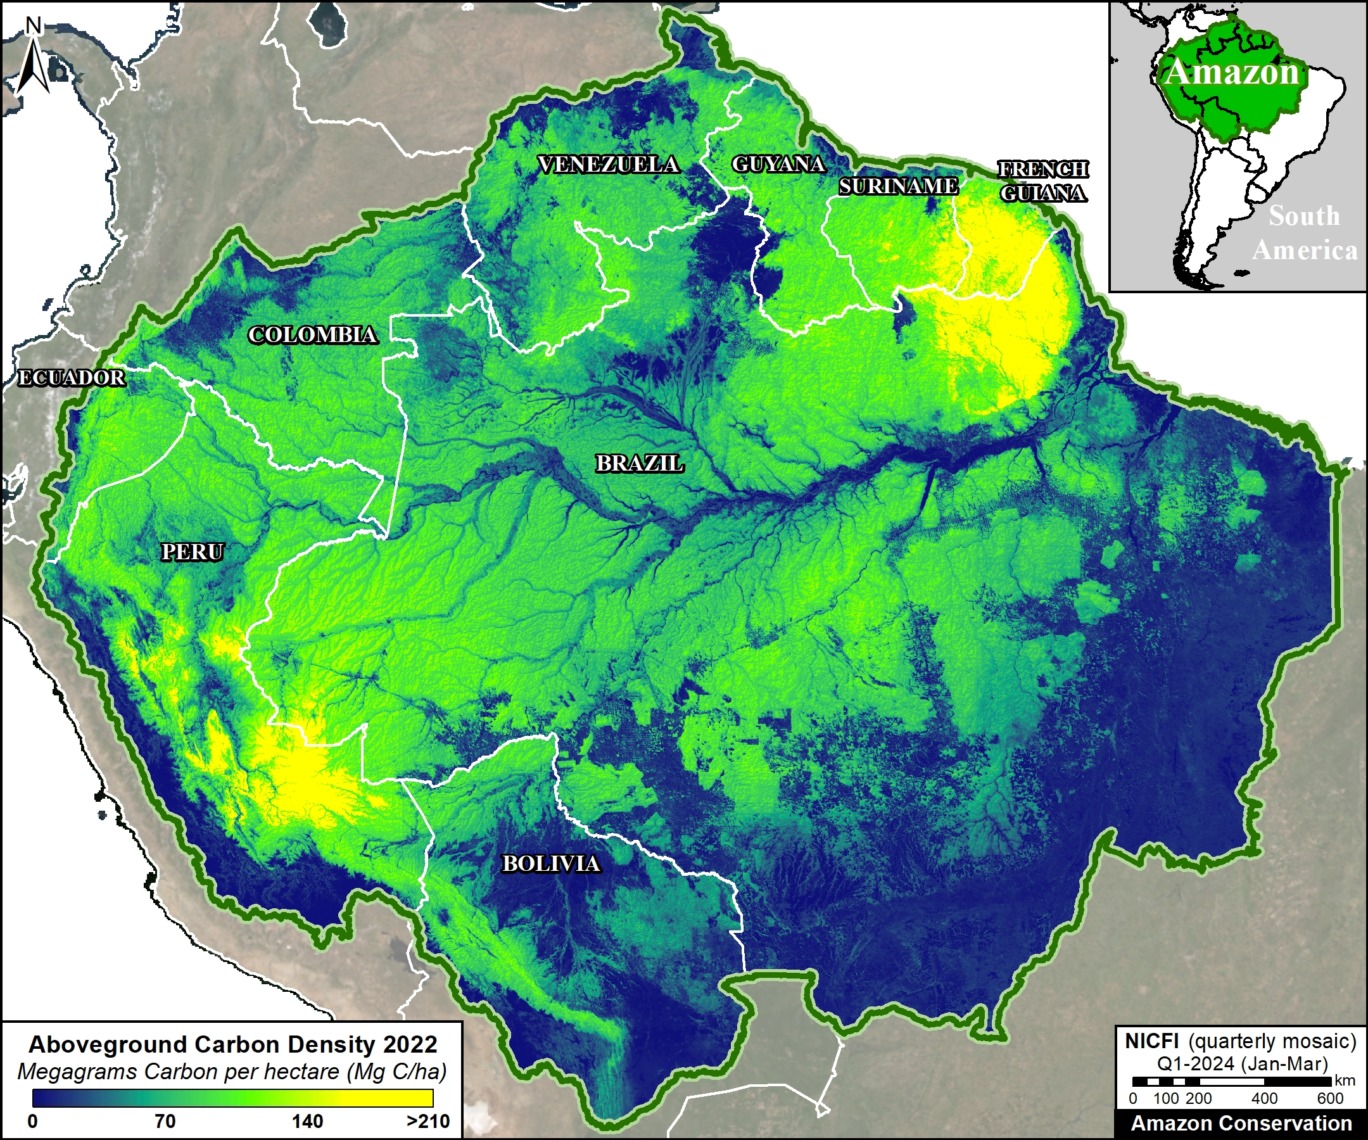
As a result, we can produce high-resolution aboveground carbon maps and estimates for anywhere and everywhere across the vast Amazon (see Figure 1).
Through a generous sharing agreement with Planet, we have been granted access to this data across the entire Amazon biome for the analysis presented in the following three-part series:
- Estimate and illustrate total aboveground forest carbon across the Amazon biome in unprecedented detail (see results of this first report, below).
j - Highlight which parts of the Amazon are home to the highest aboveground carbon levels, including protected areas and Indigenous territories (see second report, MAAP #217).
l - Present emblematic deforestation cases that have resulted in the highest aboveground carbon emissions across the Amazon (see third report, MAAP #220).
Major Results
Carbon across the Amazon
Based on our analysis of Planet Forest Carbon Diligence, we estimate that the Amazon contained 56.8 billion metric tons of aboveground carbon, as of 2022 (see Base Map). Applying a standard root-to-shoot ratio conversion (26%), this estimate increases to 71.5 billion metric tons of above and belowground carbon. This total is equivalent to nearly two years of global carbon dioxide emissions at the peak 2022 level (37.15 billion metric tons).5
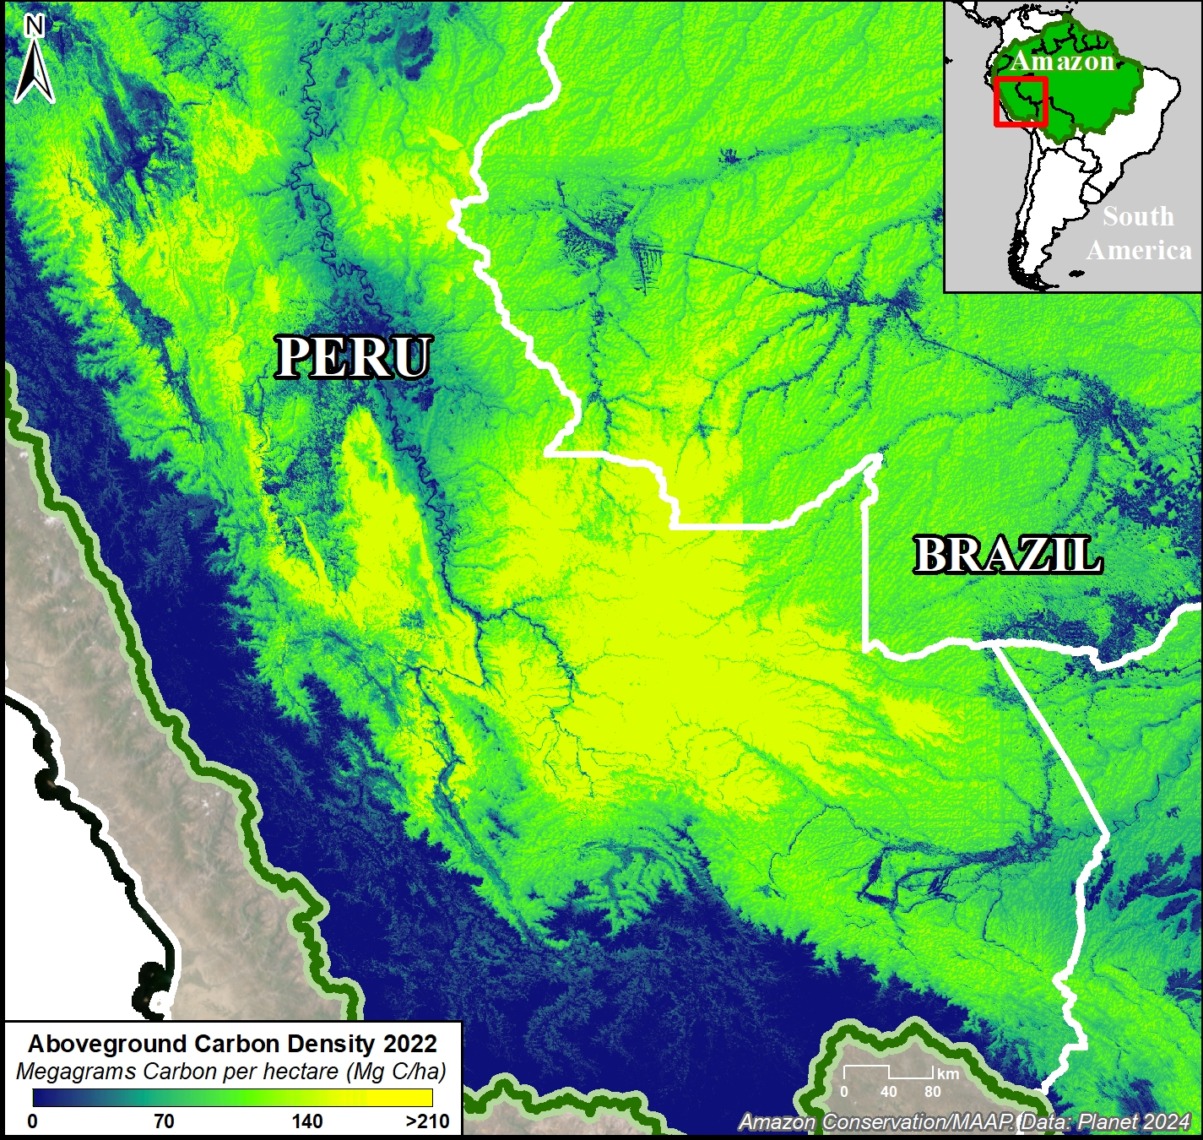
The peak carbon levels are largely concentrated in the southwest Amazon (southern Peru and adjacent western Brazil) and northeast Amazon (northeast Brazil, French Guiana, and Suriname).
Total Carbon by Country
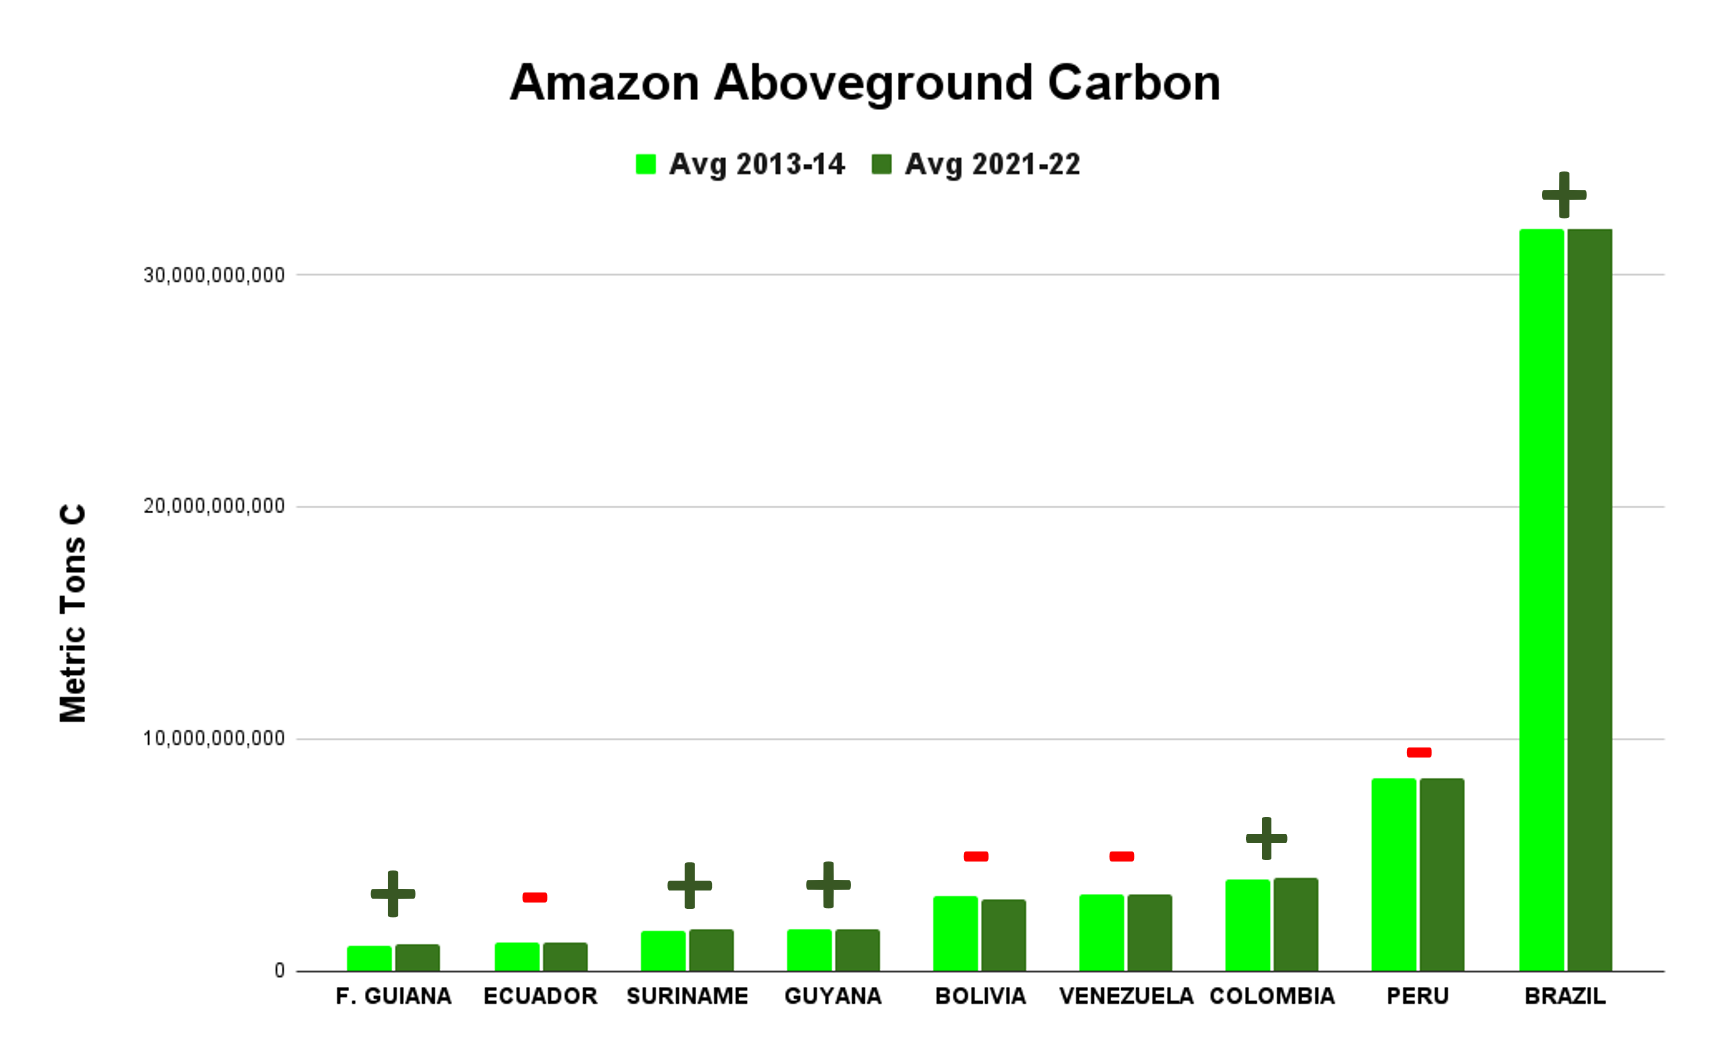
As shown in Graph 1, countries with the most aboveground carbon are 1) Brazil (57%; 32.1 billion metric tons), 2) Peru (15%; 8.3 billion metric tons), 3) Colombia (7%; 4 billion metric tons), 4) Venezuela (6%; 3.3 billion metric tons), and 5) Bolivia (6%; 3.2 billion metric tons). These countries are followed by Guyana (3%; 2 billion metric tons), Suriname (3%; 1.6 billion metric tons), Ecuador (2%; 1.2 billion metric tons), and French Guiana (2%; 1.1 billion metric tons).
Overall, we documented the total gain of 64.7 million metric tons of aboveground carbon across the Amazon during the ten years between 2013 and 2022.2 In other words, the Amazon is still functioning as a critical carbon sink.
The countries with the most aboveground carbon gain over the past ten years are 1) Brazil, 2) Colombia, 3) Suriname, 4) Guyana, and 5) French Guiana. Note that we show Brazil as a carbon sink (gain of 102.8 million metric tons), despite other recent studies showing it as a carbon source.3 Also note the important gains in aboveground carbon across several key High Forest cover, Low Deforestation (HFLD) countries, namely Colombia, Suriname, Guyana, and French Guiana.4
In contrast, the countries with the most aboveground carbon loss over the past ten years are 1) Bolivia, 2) Venezuela, 3) Peru, and 4) Ecuador.

Carbon Density by Country
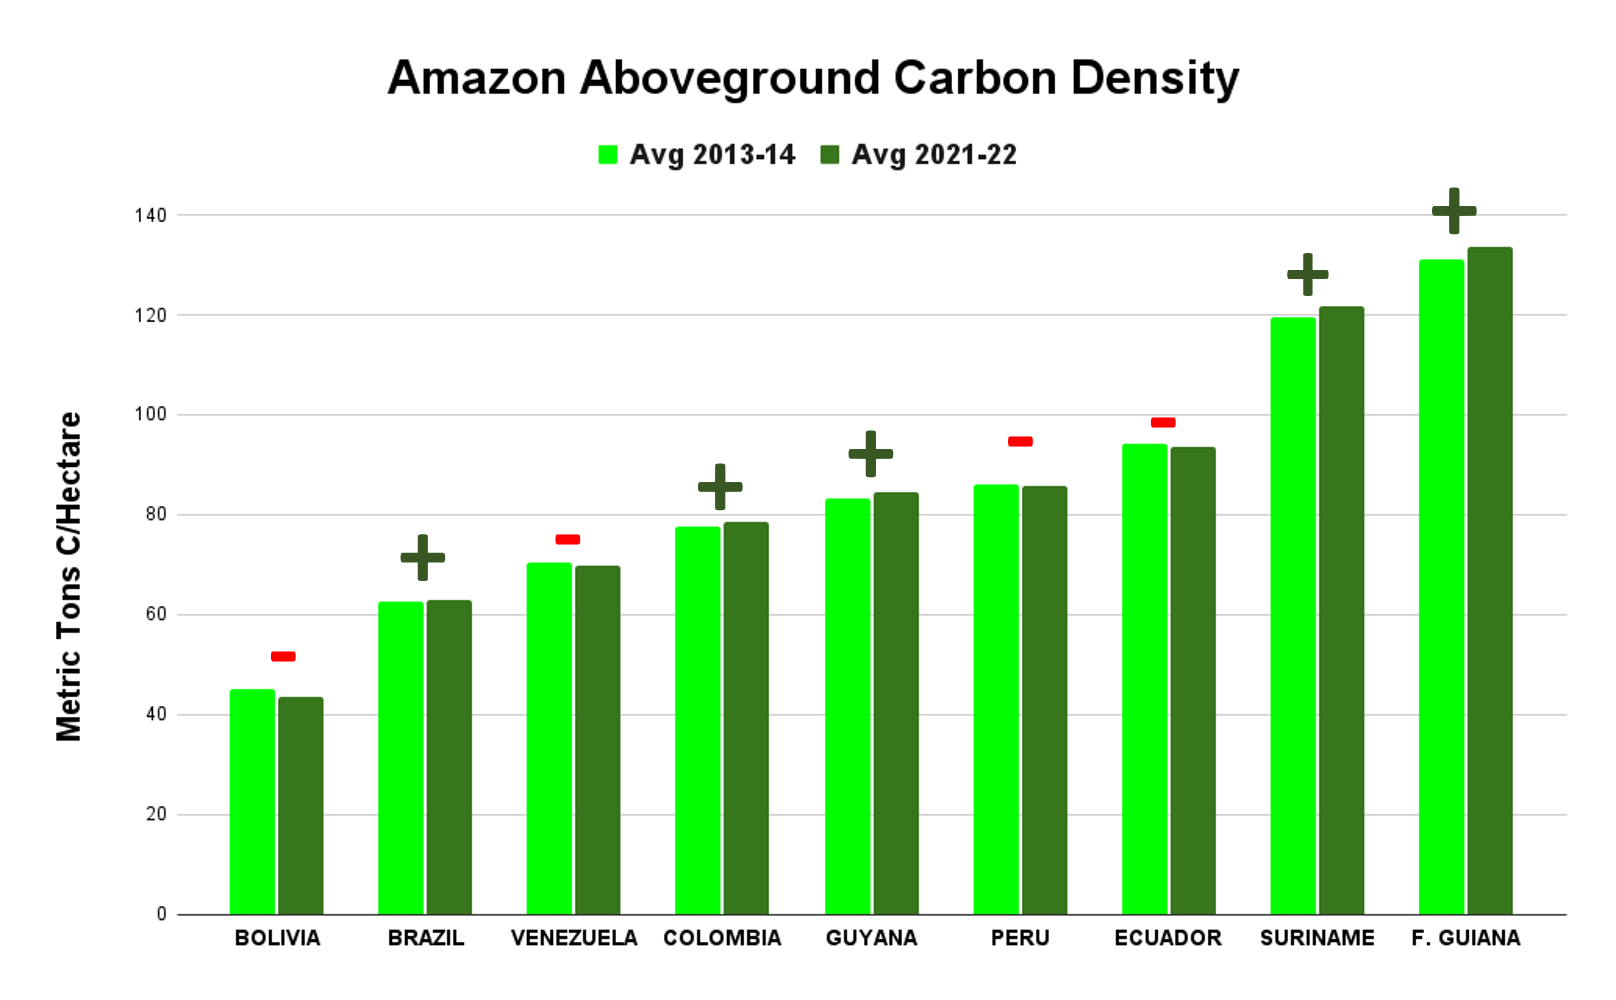
Standardizing for area, Graph 2 shows that countries with the highest aboveground carbon density (that is, aboveground carbon per hectare as of 2021-22) are located in the northeast Amazon: French Guiana (134 metric tons/hectare), Suriname (122 metric tons/hectare), and Guyana (85 metric tons/hectare). Ecuador is also high (94 metric tons/hectare).
Note that countries in the northeast Amazon (French Guiana, Suriname, and Guyana) have lower total aboveground carbon due to their smaller size (Graph 1), but high aboveground carbon density per hectare (Graph 2). This also applies to Ecuador.

Notes & Citations
1 Anderson C (2024) Forest Carbon Diligence: Breaking Down The Validation And Intercomparison Report. https://www.planet.com/pulse/forest-carbon-diligence-breaking-down-the-validation-and-intercomparison-report/
2 In terms of uncertainty, the data contains pixel-level estimates, but not yet at national levels. To minimize annual uncertainty at the country level, we averaged 2013 and 2014 for the baseline and 2021 and 2022 for the current state.
3 Recently, in MAAP #144, we showed Brazil as a carbon source, based on data from 2001 to 2020. In contrast, Planet Forest Carbon Diligence is based on data from 2013 to 2022. Thus, one interpretation of the difference is that most carbon loss occurred in the first decade of the 2000s, which is consistent with historical deforestation data showing peaks in the early 2000s. It also highlights the likely importance of the interplay between forest loss/degradation (carbon loss) and forest regeneration (carbon gain) in terms of whether a country is a carbon source or sink during a given timeframe.
4 HFDL, or “High Forest cover, Low Deforestation” describes countries with both a) high forest cover (>50%) and low deforestation rates (<0.22% per year). For more information on HFDL, see https://www.conservation.org/blog/what-on-earth-is-hfld-hint-its-about-forests
5 Annual carbon dioxide (CO₂) emissions worldwide from 1940 to 2023
Citation
Finer M, Mamani N, Anderson C, Rosenthal A (2024) Unprecedented Look at Carbon across the Amazon. MAAP #215.
Acknowledgments
This report was made possible by the generous support of the Norwegian Agency for Development Cooperation (NORAD)


