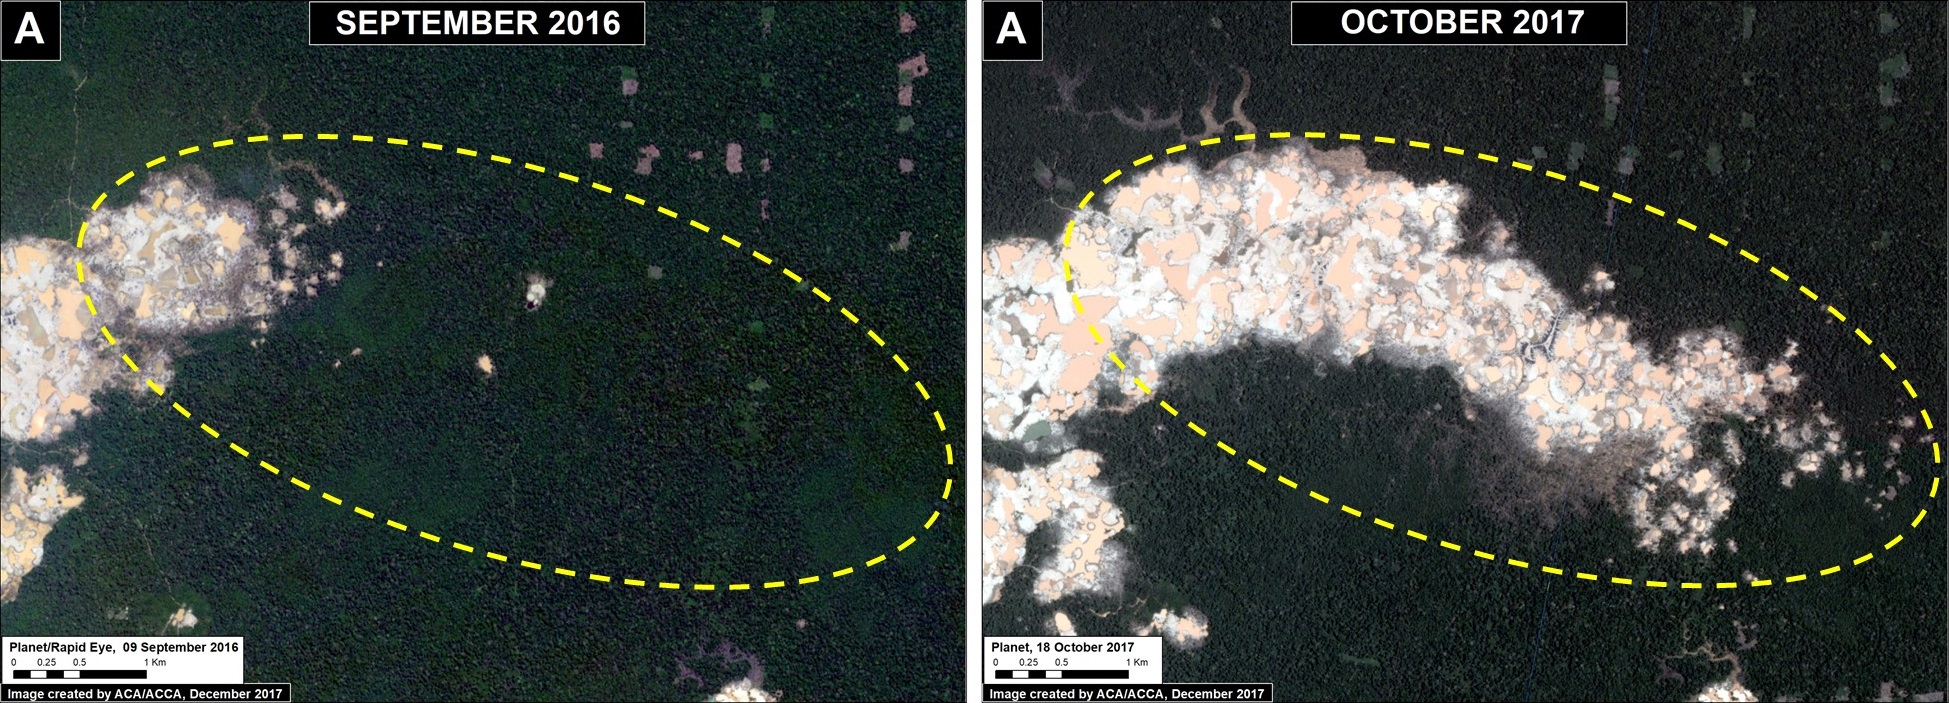
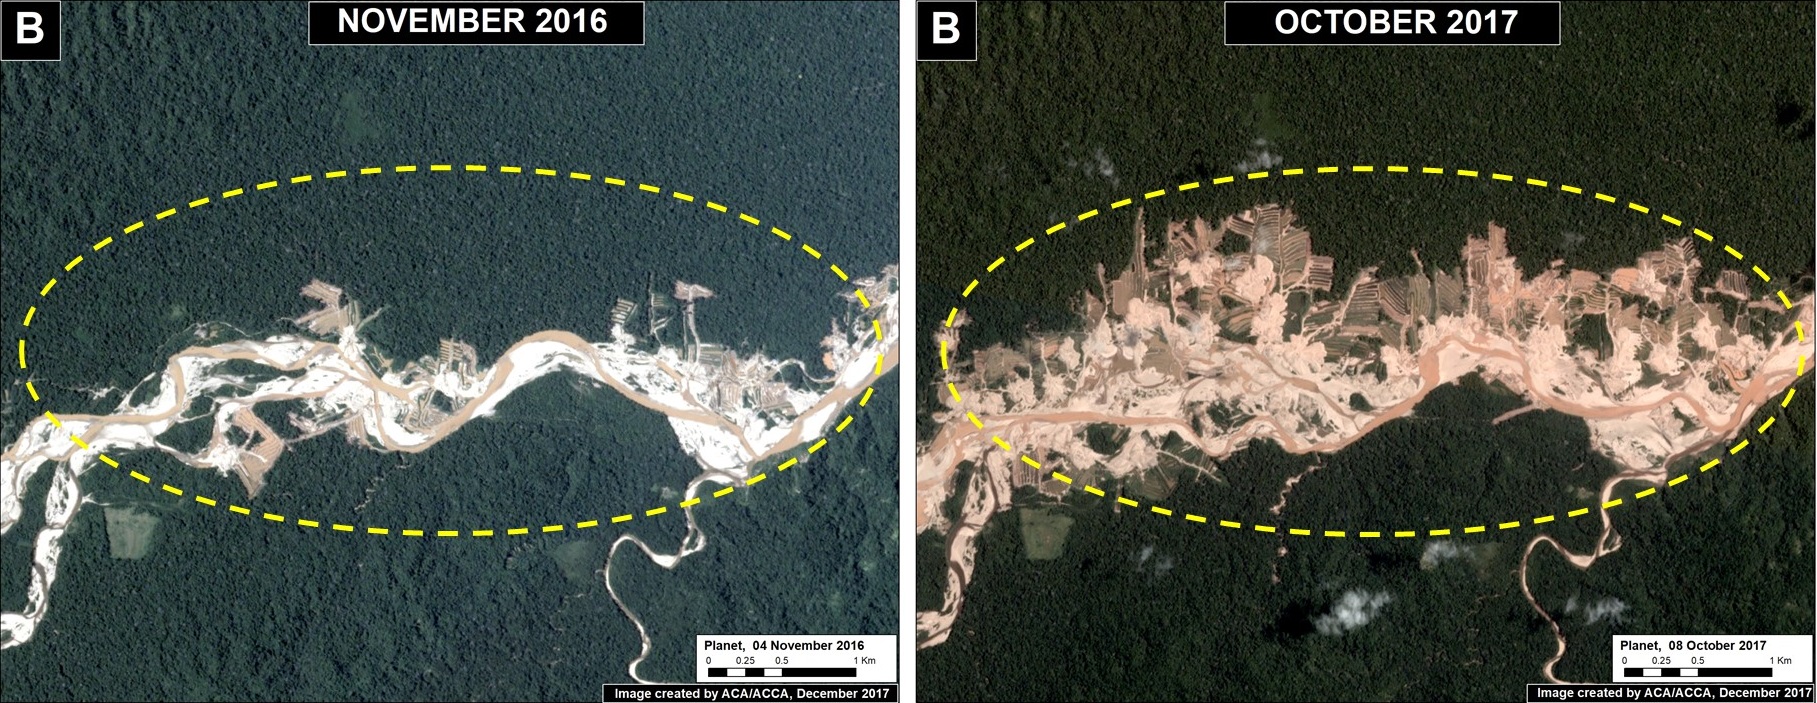
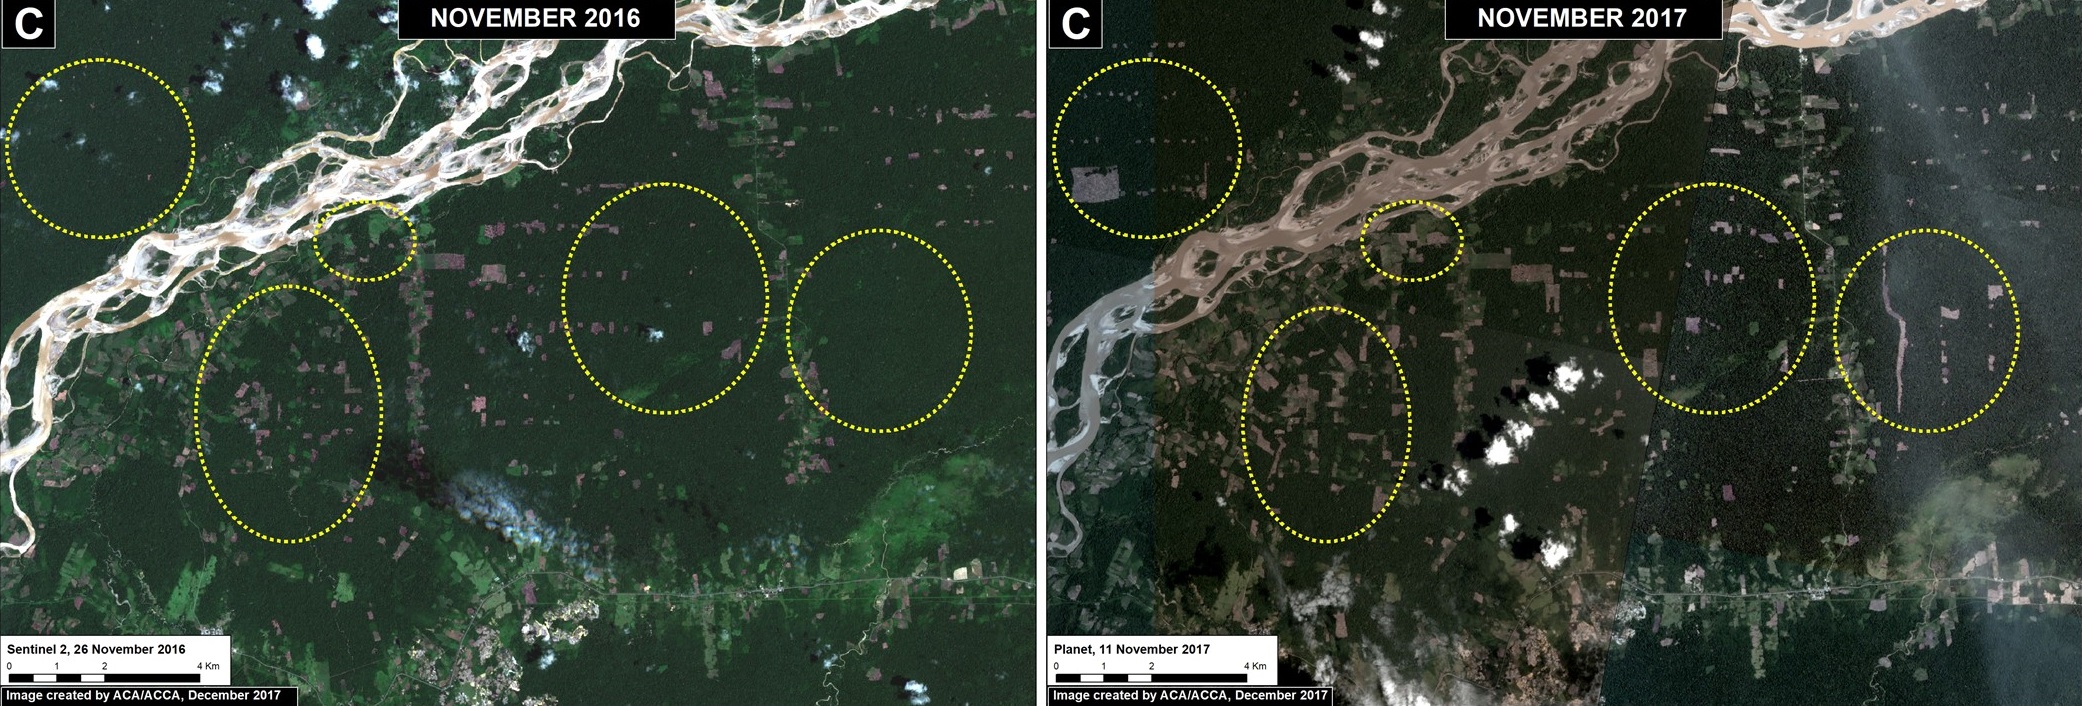
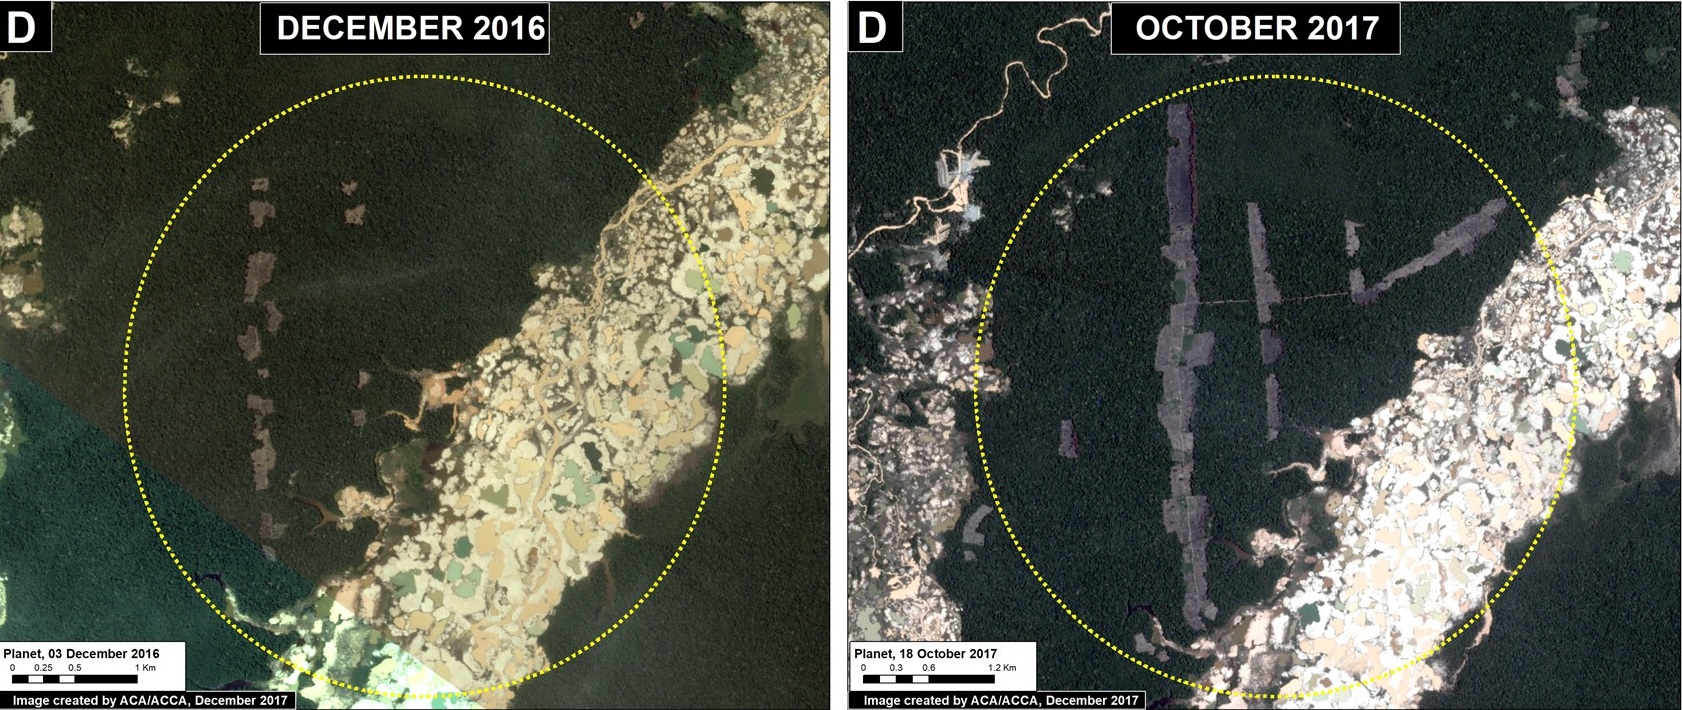
MAAP #88: Deforestation Hotspots in the Ecuadorian Amazon

MAAP #88:
Deforestation Hotspots in the Ecuadorian Amazon
https://www.maapprogram.org/ecuador-hotspots/

Hotspots de deforestación en la Amazonía Ecuatoriana

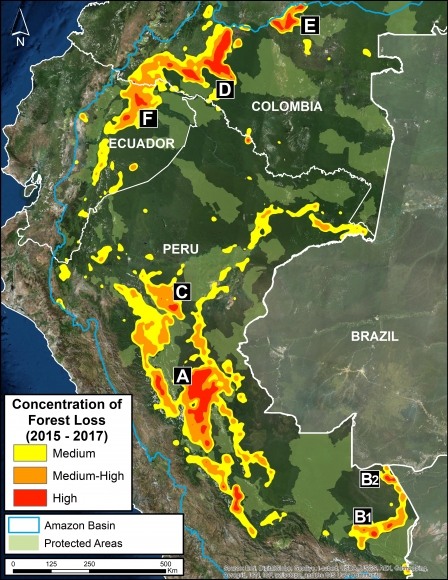
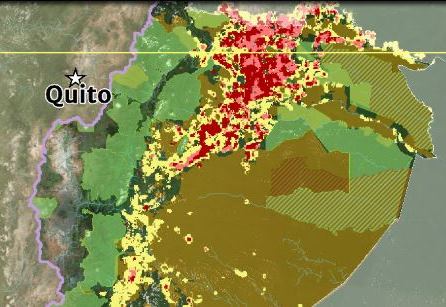
Here, we highlight deforestation hotspots, the areas with the highest deforestation densities, in the mega-diverse Ecuadorian Amazon.

We then zoom in and focus on a dynamic area in the north that is located between three important protected areas (Sumaco, Yasuní y Cuyabeno).

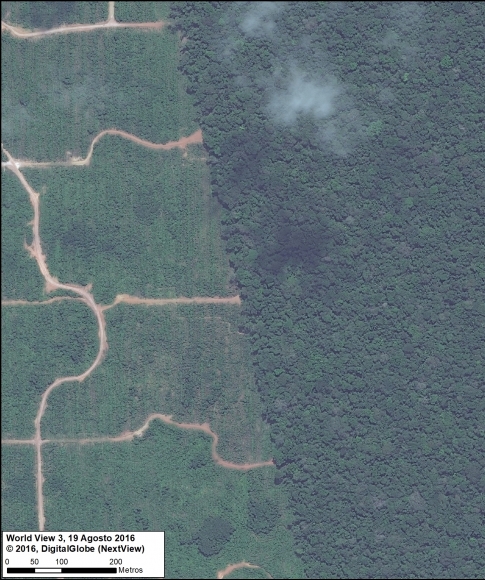
We show a series of satellite images that indicate that the primary deforestation drivers (causes) in these hotspots are oil palm and other agricultural activities.

*The Ecuador series is a collaboration between Amazon Conservation, Amazon Conservation Team, and EcoCiencia, funded by the MacArthur Foundation

MAAP #88: Deforestation Hotspots in the Ecuadorian Amazon
https://www.maapprogram.org/ecuador-hotspots/


MAAP Colombia: Chiribiquete – Deforestation Hotspots in the Colombian Amazon, part 3

MAAP #86: Deforestation Hotspots in the Colombian Amazon, part 3: Chiribiquete-Macarena

We present our third report* in a series investigating deforestation hotspots in the Colombian Amazon. Here, we focus on the “Chiribiquete-Macarena” hotspot, located between the Chiribiquete and La Macarena National Parks.

The Colombian government is finalizing plans to expand the boundaries of Chiribiquete National Park, an important step for conservation. However, we show (with high-resolution images) that deforestation is surging in the area and rapidly expanding towards these new boundaries. In fact, in 2018, deforestation has entered the newly expanded park.

MAAP #86: Deforestation Hotspots in the Colombian Amazon, part 3: Chiribiquete-Macarena

https://www.maapprogram.org/chiribiquete/


*The first report focused on the “Caguan” hotspot in the department of Caquetá. The second report focused on the “La Paya” hotspot in the department of Putumayo.

MAAP #78: Deforestation Hotspots in the Peruvian Amazon, 2017

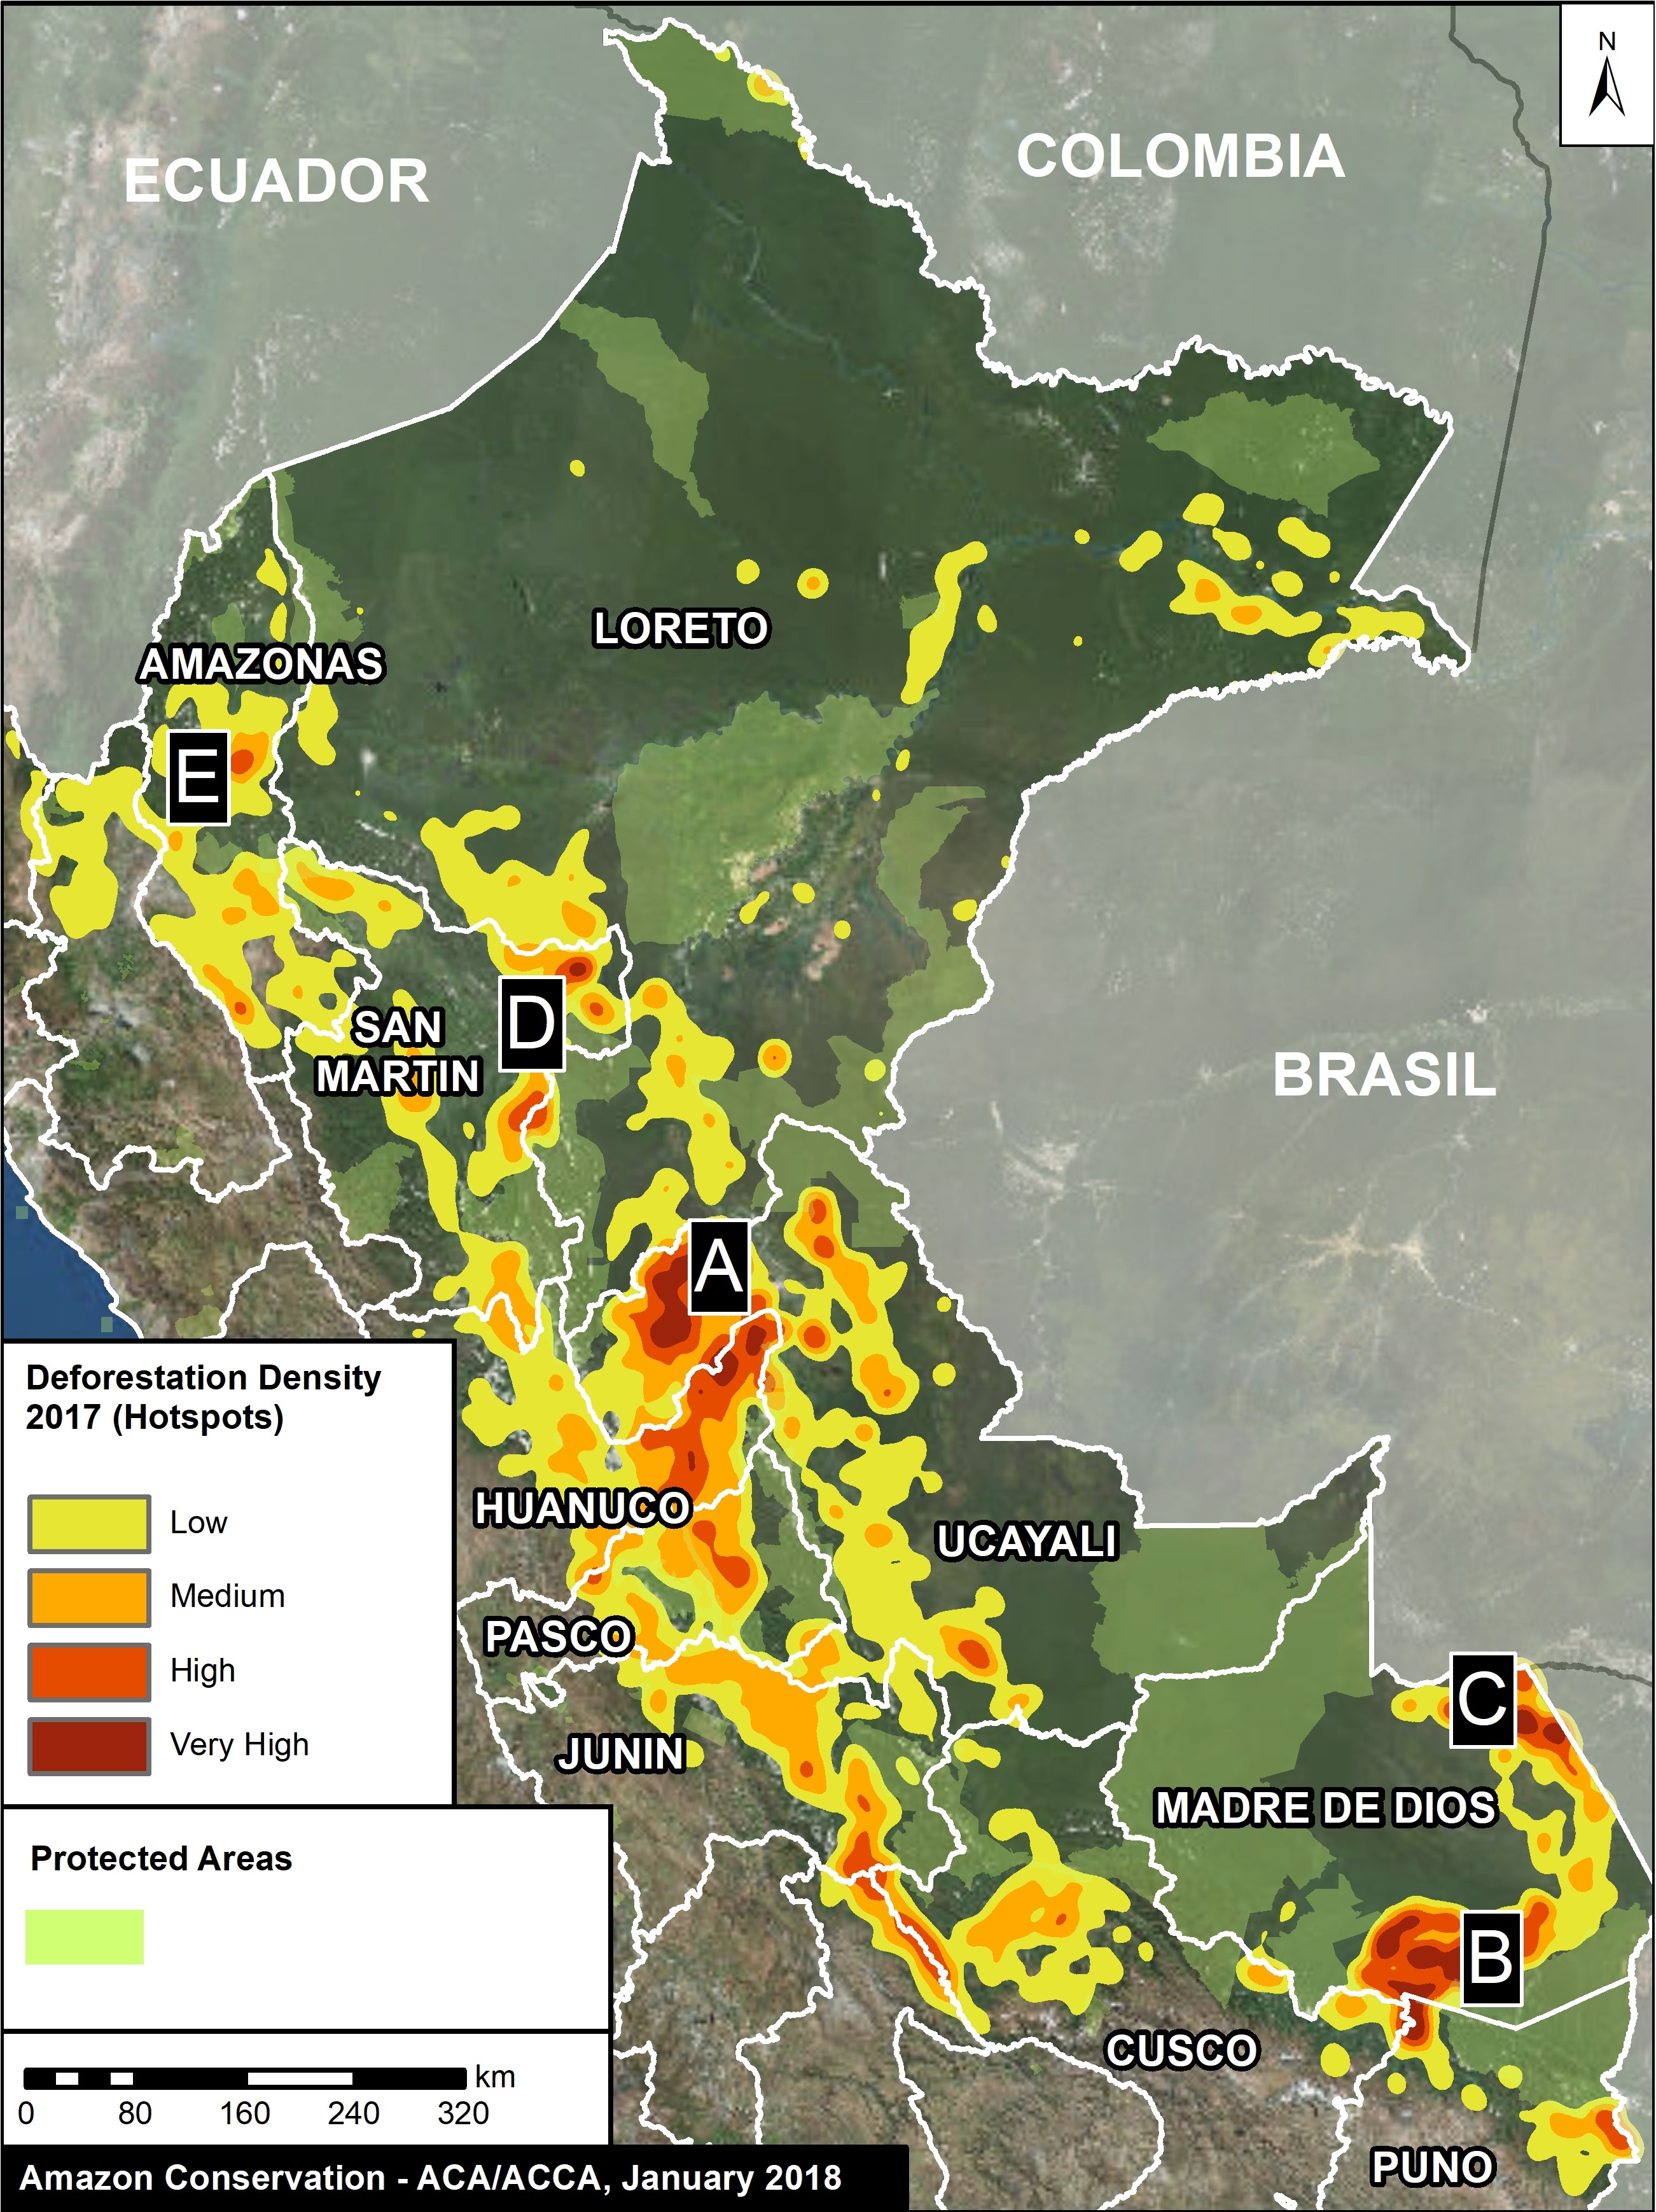
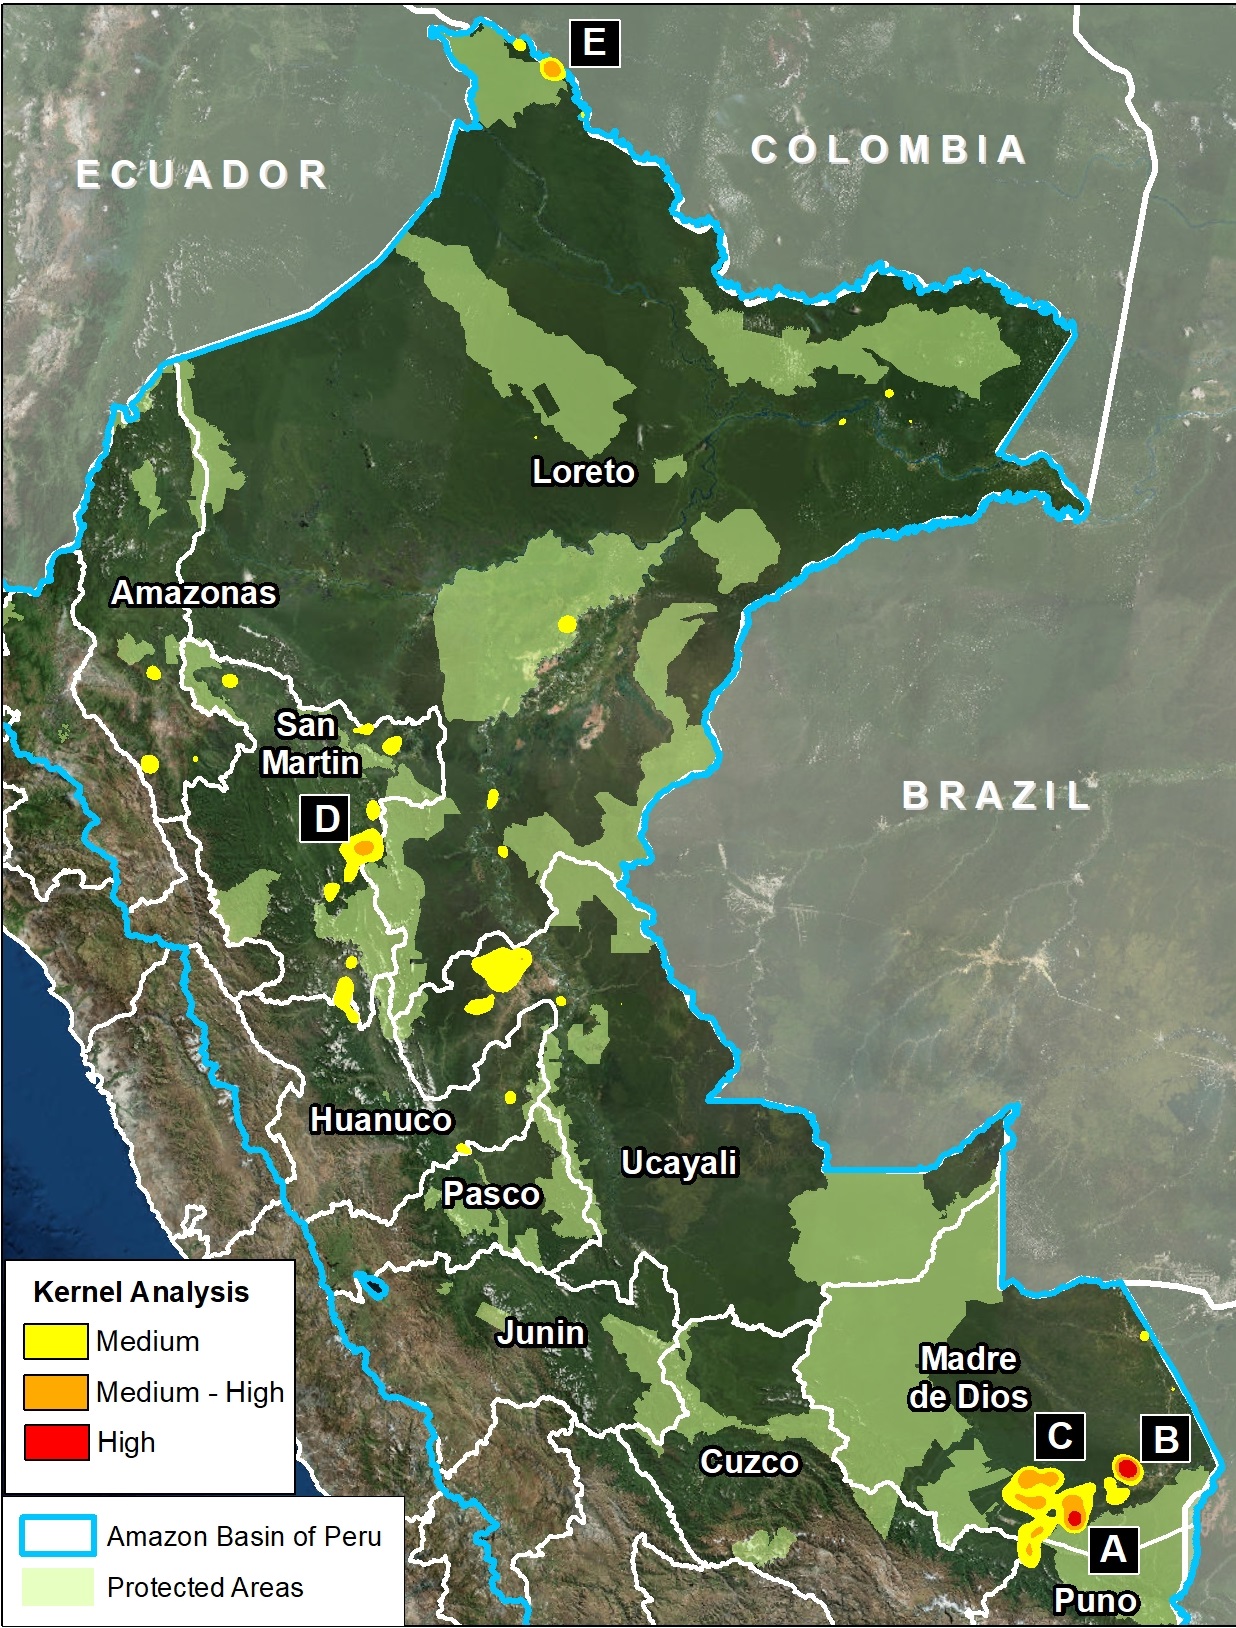
Base Map (Image 78). Data: PNCB/MINAM, UMD/GLAD, SERNANP

As we begin a new year, we make an initial assessment of 2017, estimating deforestation hotspots in the Peruvian Amazon based on early warning alert data.*

We estimate the annual forest loss of 354,410 acres (143,425 hectares) across Peru in 2017. If confirmed, this total represents the lowest in 5 years (average of 394,600 acres since 2012), and a decrease of 13% from last year.**

Deforestation, however, is still widespread. The base map shows the most intense hotspots (areas with highest density of forest loss).

The two main deforestation areas are clearly seen: the central Amazon (Ucayali/Huánuco regions) and the southern Amazon (Madre de Dios). Also, there are several additional hotspots scattered throughout the country.

We present satellite images (slider format) of the most intense hotspots. The images reveal that the main deforestation drivers include gold mining, oil palm, and general agriculture (crops and livestock).

The hotspots detailed below are:

A. Central Amazon (Ucayali/Huánuco)
B. Southern Madre de Dios
C. Iberia (Madre de Dios)
D. Northeast San Martín
E. Nieva (Amazonas)


A. Central Amazon (Ucayali/Huánuco)

As in previous years, there is a concentration of high intensity hotspots in the central Peruvian Amazon (Ucayali and Huánuco regions). We estimate the deforestation of 57,430 acres (23,240 hectares) in this hotspot during 2017. The images show that the main drivers are likely cattle ranching and oil palm plantations. Image 78a is a slider showing an example of the deforestation in this hotspot during 2017.

[twenty20 img1=”6875″ img2=”6876″ width=”78%” offset=”0.5″]

Image 78a. Central Amazon. Data: Planet, NASA/USGS

B. Southern Madre de Dios

As described in MAAP #75, Madre de Dios has become one of the regions with the highest rates of deforestation in Peru, with a concentration along the Interoceanic highway. We estimate the deforestation of 27,465 acres (11,115 hectares) in southern Madre de Dios during 2017. Image 78b is a slider showing the extensive deforestation that occurred in this area during 2017. The images show that the main drivers are gold mining (south of the highway) and small to medium-scale agriculture (north of the road).

[twenty20 img1=”6877″ img2=”6878″ width=”78%” offset=”0.5″]

Image 78b. South Madre de Dios. Data: Planet

C. Iberia (Madre de Dios)

On the other side of Madre de Dios, near the border with Brazil, another hotspot is located around the town of Iberia. We estimate the deforestation of 7,955 acres (3,220 hectares) in this hotspot during 2017.  Image 78c is a slider showing deforestation in the area of the hotspot west of Iberia (known as Pacahuara). The images show that the main deforestation driver is small to medium-scale agriculture (according to local sources, the main crops include corn, papaya, and cacao).

[twenty20 img1=”6880″ img2=”6879″ width=”78%” offset=”0.5″]

Image 78c. Iberia. Data: Planet

D. Northeast of San Martín

A new hotspot emerged in the northeast corner San Martin due to a large-scale agriculture plantation. Image 78d is a slider that shows the deforestation of 1,830 acres (740 hectares) during the last several months of 2017. The Peruvian Environment Ministry has confirmed that the cause is a new oil palm plantation. Indeed, this new deforestation is close to an area that has experienced extensive deforestation for oil palm plantations in recent years (see MAAP #16).

[twenty20 img1=”6882″ img2=”6881″ width=”78%” offset=”0.5″]

Image 78d. San Martin. Data: Planet

E. Nieva (Amazonas)

In northwestern Peru, there is a new isolated hotspot along a road connecting the towns of Bagua and Saramiriza in the district of Nieva (Amazonas region). We estimate the deforestation of 2,805 acres (1,135 hectares) in this hotspot during 2017. Image 78e is a slider that shows an example of the recent deforestation. The images show that the cause of deforestation is mostly small-scale agriculture and cattle pasture.

[twenty20 img1=”6884″ img2=”6883″ width=”78%” offset=”0.5″]

Image 78e. Nieva. Data: Planet

Notes

*We emphasize that the data presented in this report are estimates based on early warning alert data generated by: 1) GLAD/UMD (Hansen et al 2016 ERL 11: (3)), and 2) the National Program for Forest Conservation for Climate Change Mitigation of the Ministry of the Environment of Peru (PNCB/MINAM). The official forest loss data are produced annually by  PNCB/MINAM.

**According to official PNCB/MINAM data, forest loss in 2016 was 164,662 hectares. The average of the last 5 years (2012-16) was 159,688 hectares.

Coordinates

A. -8.289977,-75.415649
B. -12.969013,-69.918365; -12.872639,-70.263062
C. -11.304257,-69.635468
D. -6.26539,-75.800171
E. -4.972954,-78.21167

References

Planet Team (2017). Planet Application Program Interface: In Space for Life on Earth. San Francisco, CA. https://api.planet.com

Citation

Finer M, Mamani N, García R, Novoa S (2018) Deforestation Hotspots in the Peruvian Amazon, 2017. MAAP: 78.

MAAP #77: Deforestation Hotspots in the Colombian Amazon, part 2

We present the second in a series of story maps investigating deforestation hotspots in the Colombian Amazon. Our goal is to identify the most critical hotspots (areas with the highest densities of deforestation) and use satellite imagery to identify the primary deforestation drivers.

The first report focused on a hotspot approaching Chiribiquete National Park in Caquetá department, and the  deforestation was largely driven by cattle pasture.

Here, we move to the south and focus on a hotspot surrounding La Paya National Park in Putumayo Department. We show high-resolution satellite imagery that reveals the major driver is again cattle pasture.

Please follow this link to view the Story Map: Deforestation Hotspots in the Colombian Amazon, part 2


This work reflects an important collaboration with our colleagues at Amazon Conservation Team, funded by the MacArthur Foundation.

MAAP #75: Pope to visit Madre de Dios, region with Deforestation Crisis (Peru)

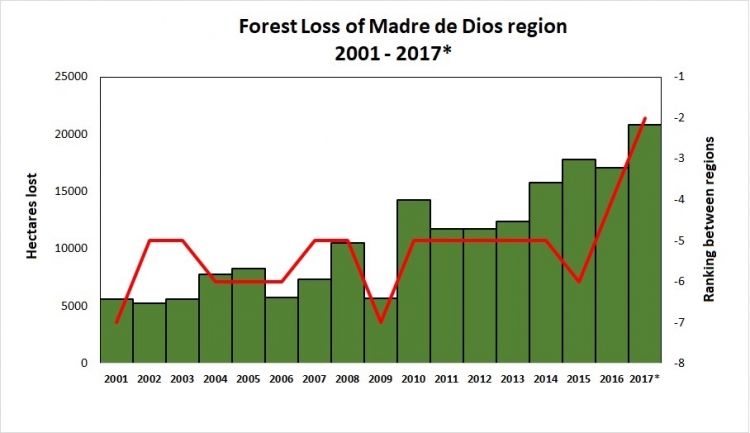
Table 76. Data: PNBC/MINAM (2001-16), UMD/GLAD (2017, until the first week of November).

Pope Francis, as part of his upcoming visit to Peru in January, will visit the Madre de Dios region in the southern Peruvian Amazon. He is expected to address issues facing the Amazon and its indigenous communities, including deforestation.

In this article, we show that Madre de Dios is experiencing a deforestation crisis, due mainly to impacts from gold mining, small-scale agriculture, and roads.

Table 76 shows the increasing trend of annual forest loss since 2001, peaking in 2017. In fact, in 2017 forest loss exceeded 20,000 hectares (49,000 acres) for the first time, doubling the loss in 2008.*

The table also shows the ranking of Madre de Dios in respect to the annual forest loss compared to all other regions of the Peruvian Amazon (see red line). For the first time, Madre de Dios is the region with the second highest forest loss total, behind only Ucayali.

Next, we present a map of deforestation hotspots in Madre de Dios in 2017, along with satellite images of a number of the most intense hotspots.

*The total estimated forest loss in 2017 was based on early warnings alerts generated by the University of Maryland (GLAD alerts) and the Peruvian Environment Ministry (PNCB/MINAM). The estimate is 20,826 hectares as of the first week of November.

Deforestation Hotspots in Madre de Dios

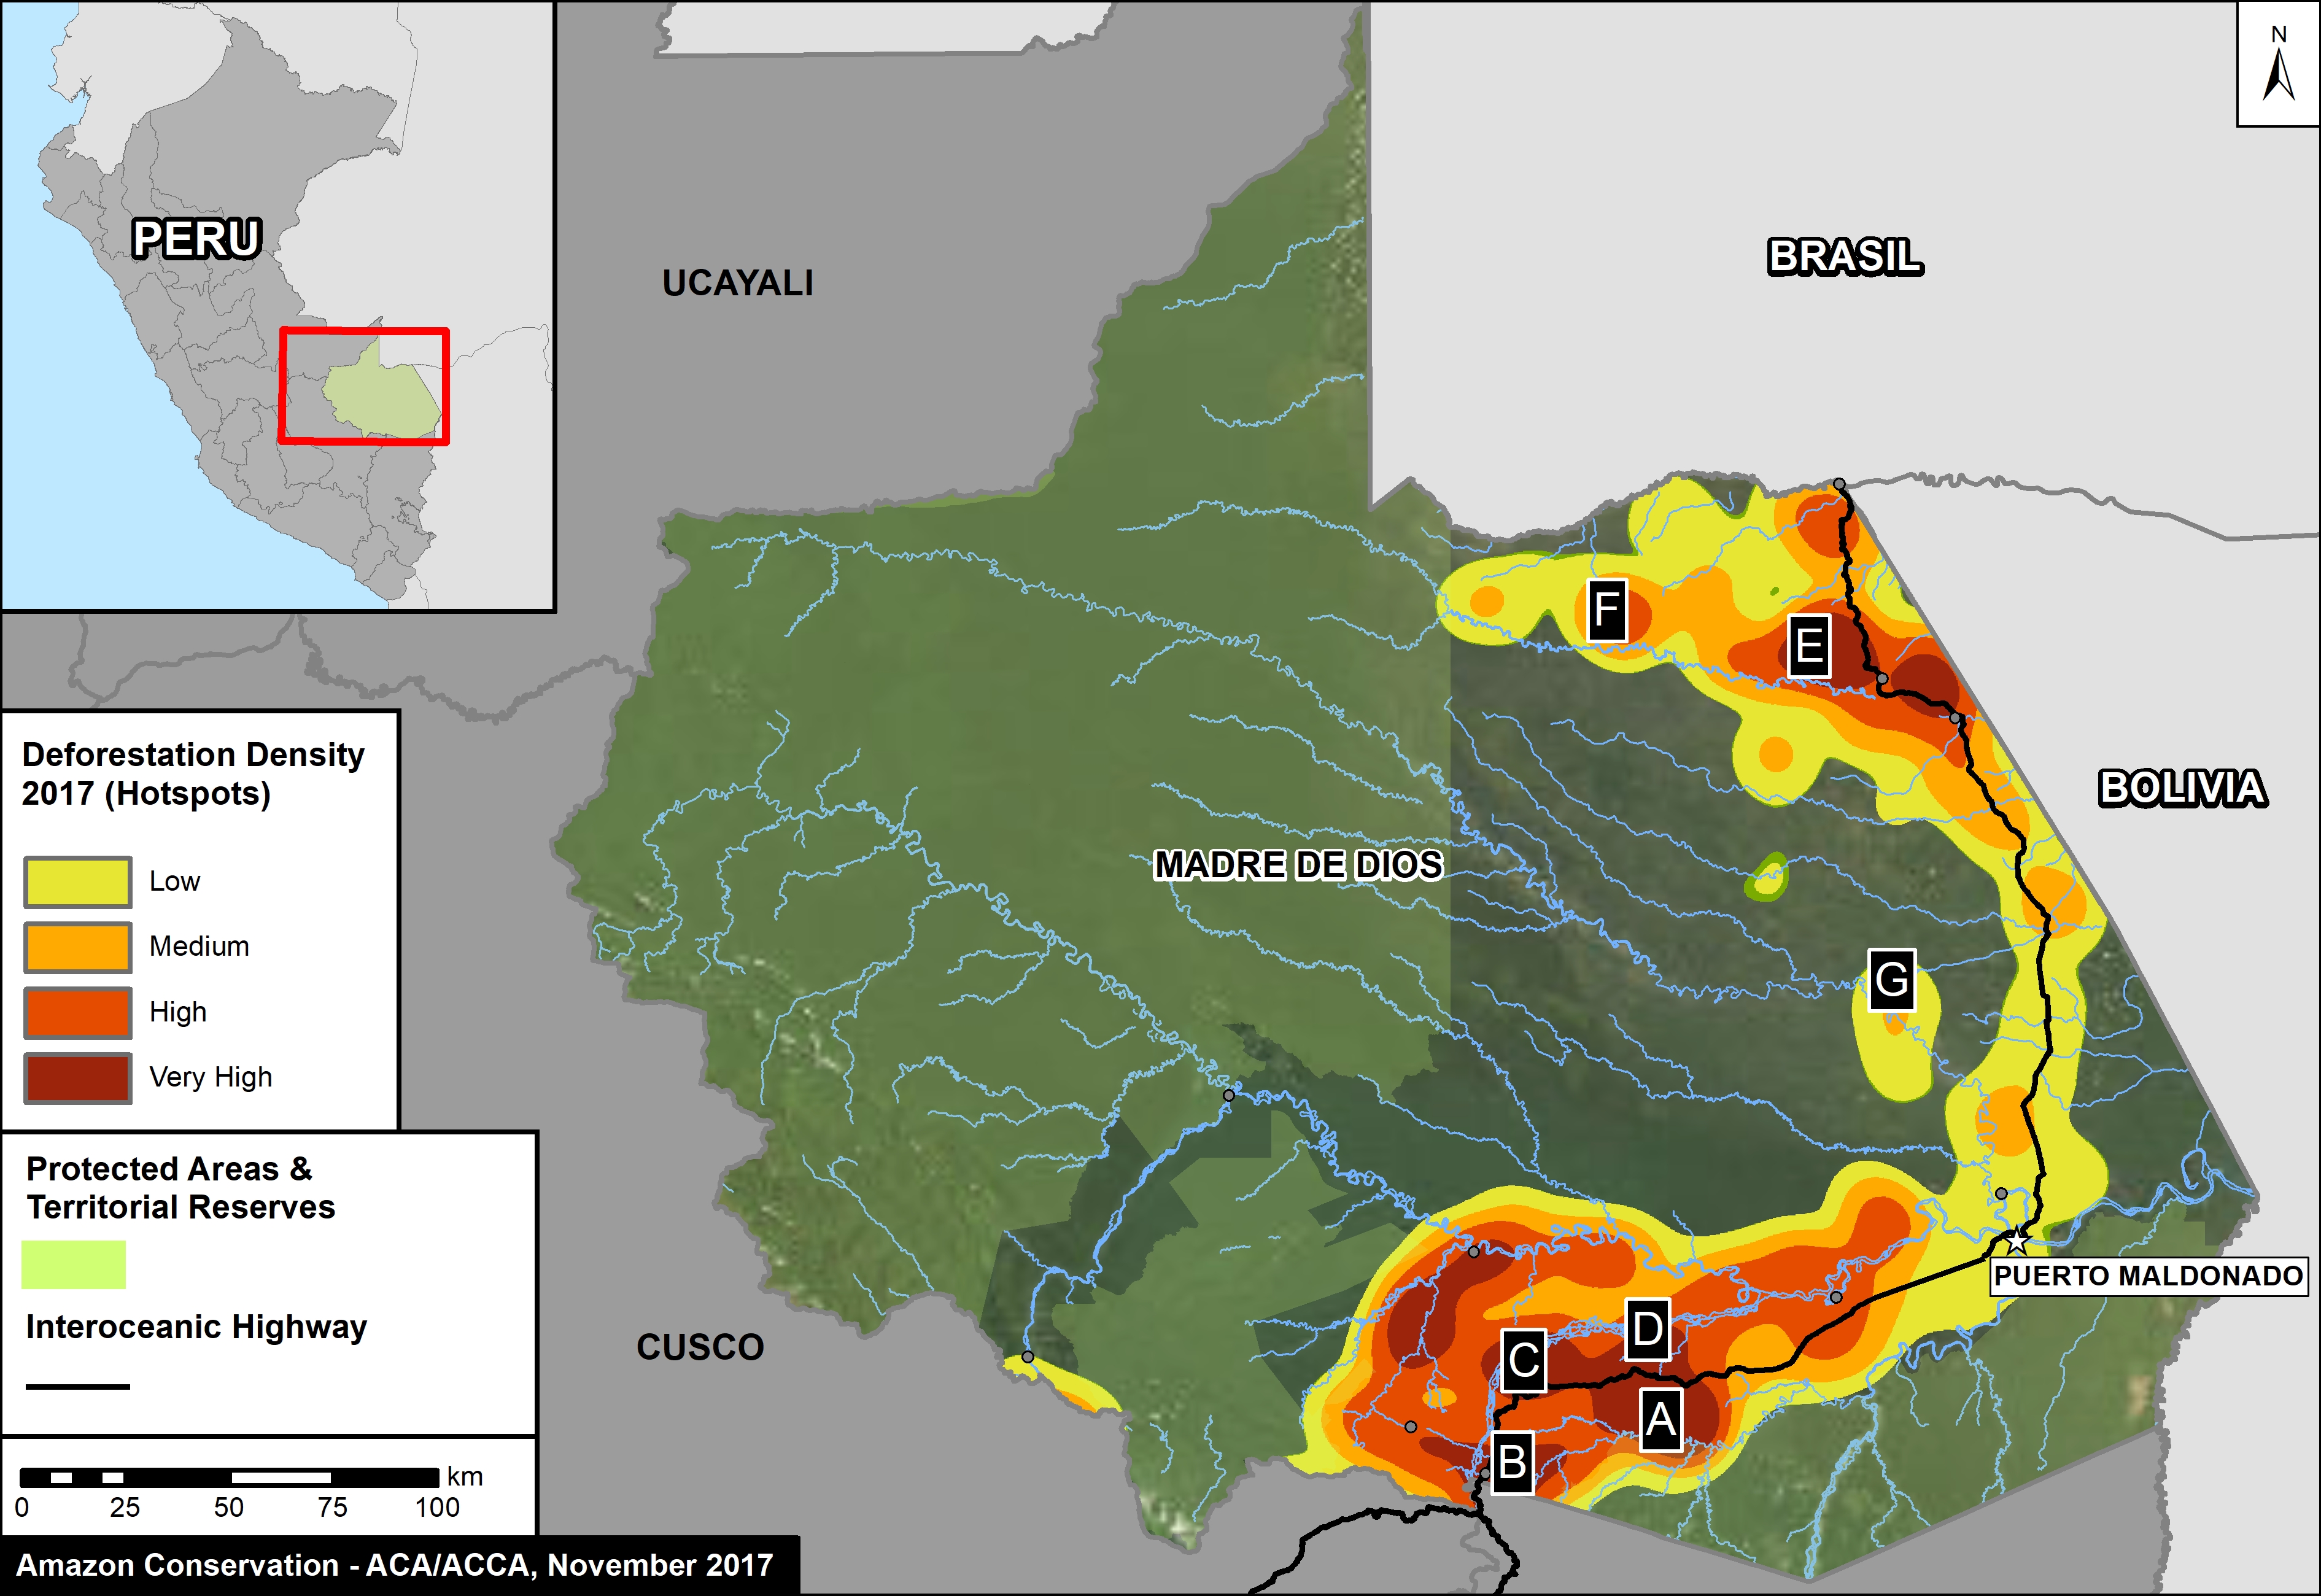
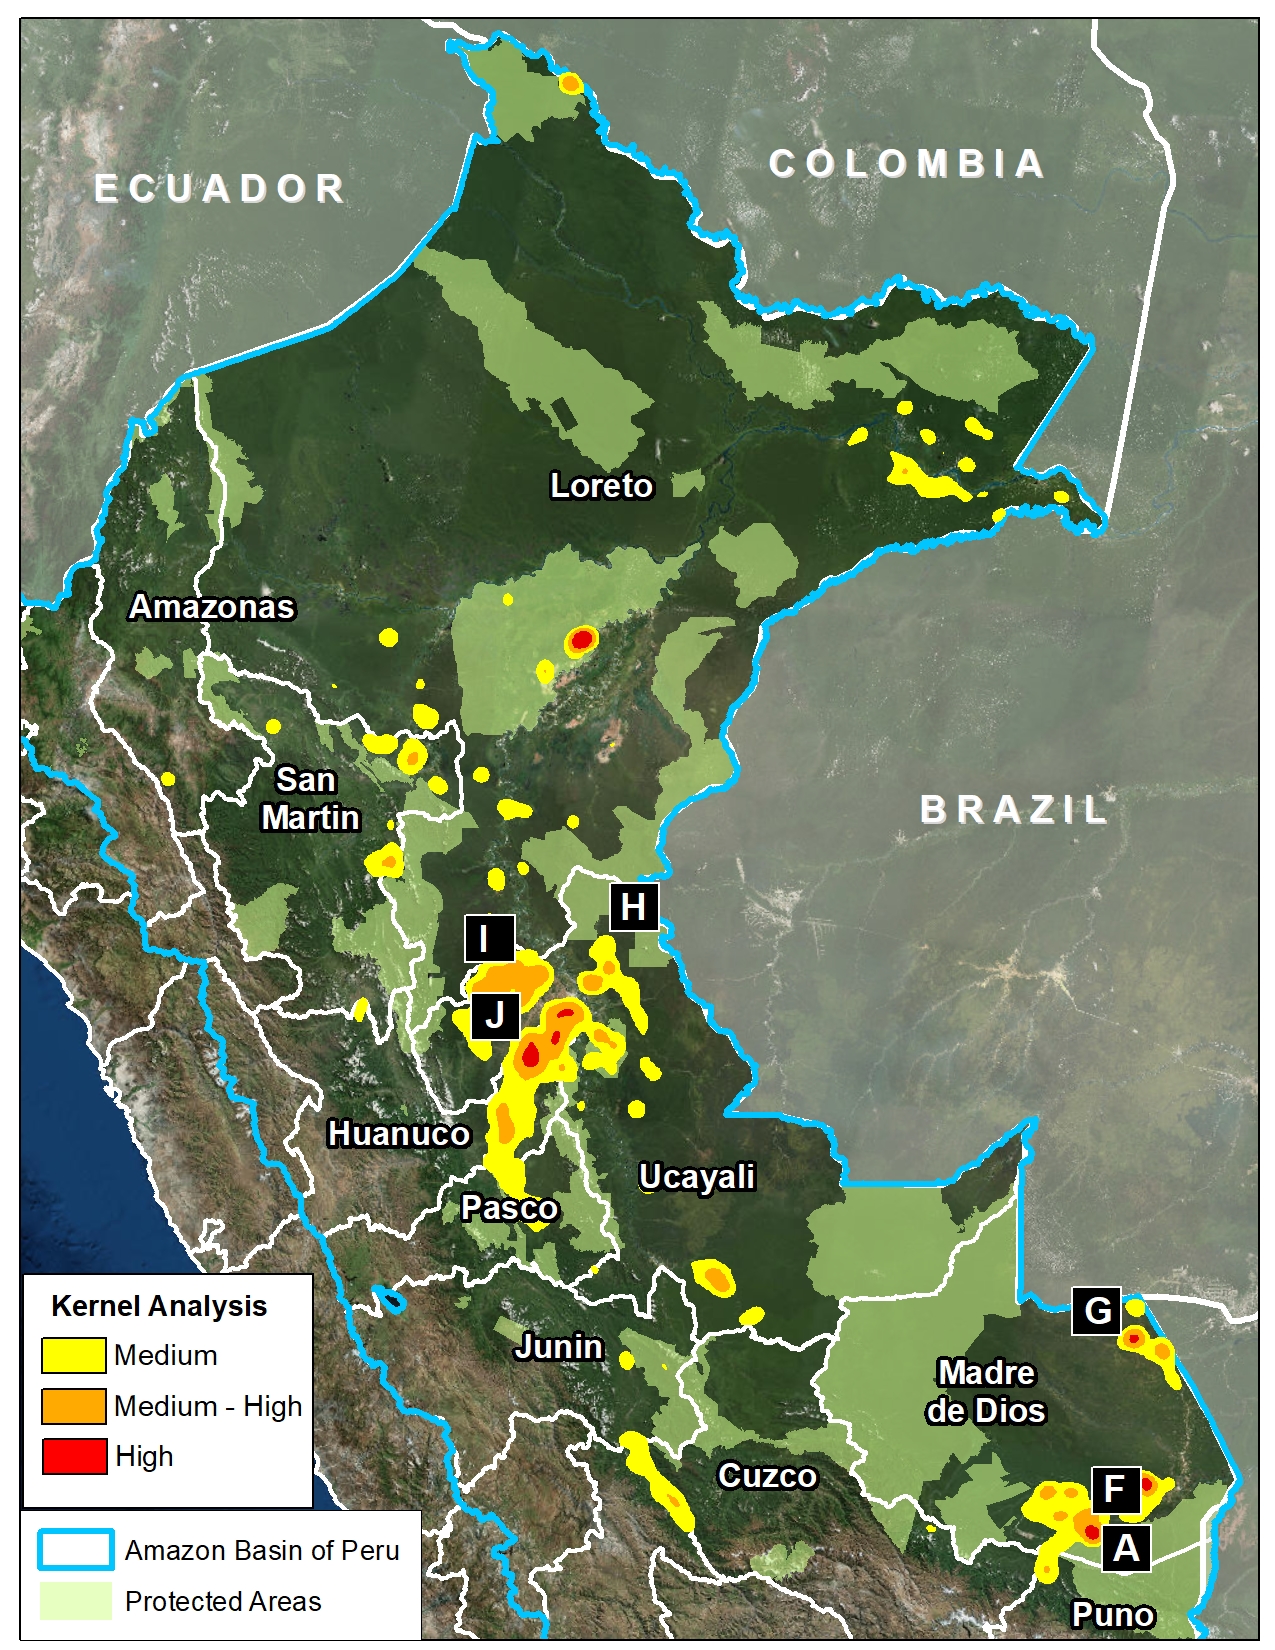
Image 76 shows a map of deforestation hotspots in Madre de Dios in 2017, based on early warning forest loss data. The colors yellow (low), orange (medium/high), and red (very high) correspond to the areas with the highest concentration of alerts, i.e. the main deforestation hotspots of 2017. Note how the majority of the forest loss is concentrated along the recently paved Interoceanic highway.

Next, we show satellite imagery for 7 hotspots (Insets A-G) that together account for the deforestation of 6,000 hectares (15,000 acres). We show that the main deforestation drivers are gold mining and small-scale agriculture.

Image 76. Base Map of Hotspots in Madre de Dios in 2017. Data: PNBC/MINAM, UMD/GLAD

La Pampa (Inset A)

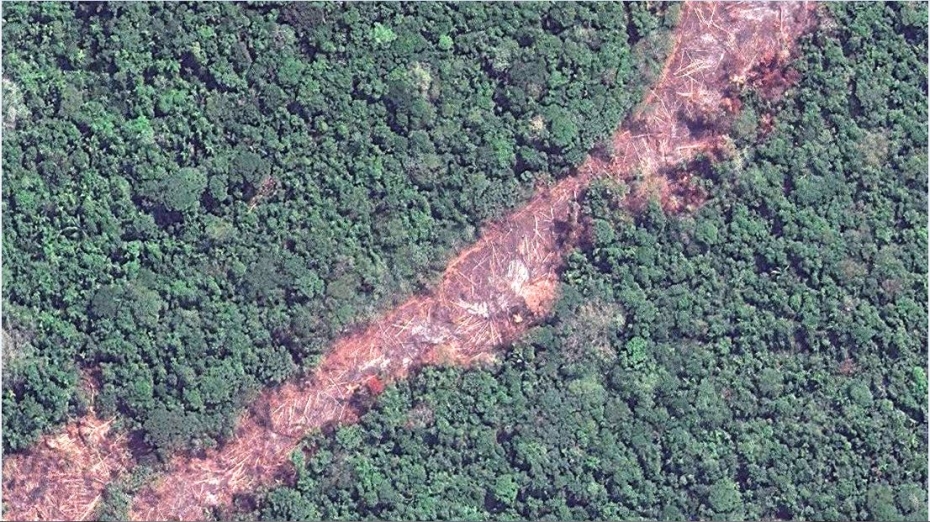
The area known as La Pampa continues to experience significant deforestation due to the advance of gold mining. Despite a series of field interventions by the Peruvian Government, we documented the deforestation of 1,385 acres (560 hectares) in 2017 (Image 76a). Since 2013, the total deforestation in La Pampa is 11,270 acres (4,560 hectares).

Image 76a. Data: Planet

Upper Malinowski (Inset B)

Upstream of La Pampa, the headwaters of the Malinowski River represent a second area devastated by the recent advance of gold mining. We documented the deforestation of 1,795 acres (726 hectares) in 2017 along the upper Malinowski (Image 76b). Since 2015, the total deforestation along the upper Malinowski is 5,260 acres (2,130 hectares).

Image 76b. Data: Planet

Santa Rita and Guacamayo (Insets C y D)

To the north of the La Pampa and Upper Malinowski mining areas, and on the other side of the Interoceanic highway, are two areas with significant recent deforestation due to small-scale agriculture. In these two areas, we documented the deforestation of 2,890 acres (1,170 hectares) in 2017 (Images 76c, 76d). Additional research focused on the exact type of crops is required, but local sources indicate an increase in papaya and cacao in the area.

Image 76c. Data: Planet, ESA
Image 76d. Data: Planet

Iberia (Inset E)

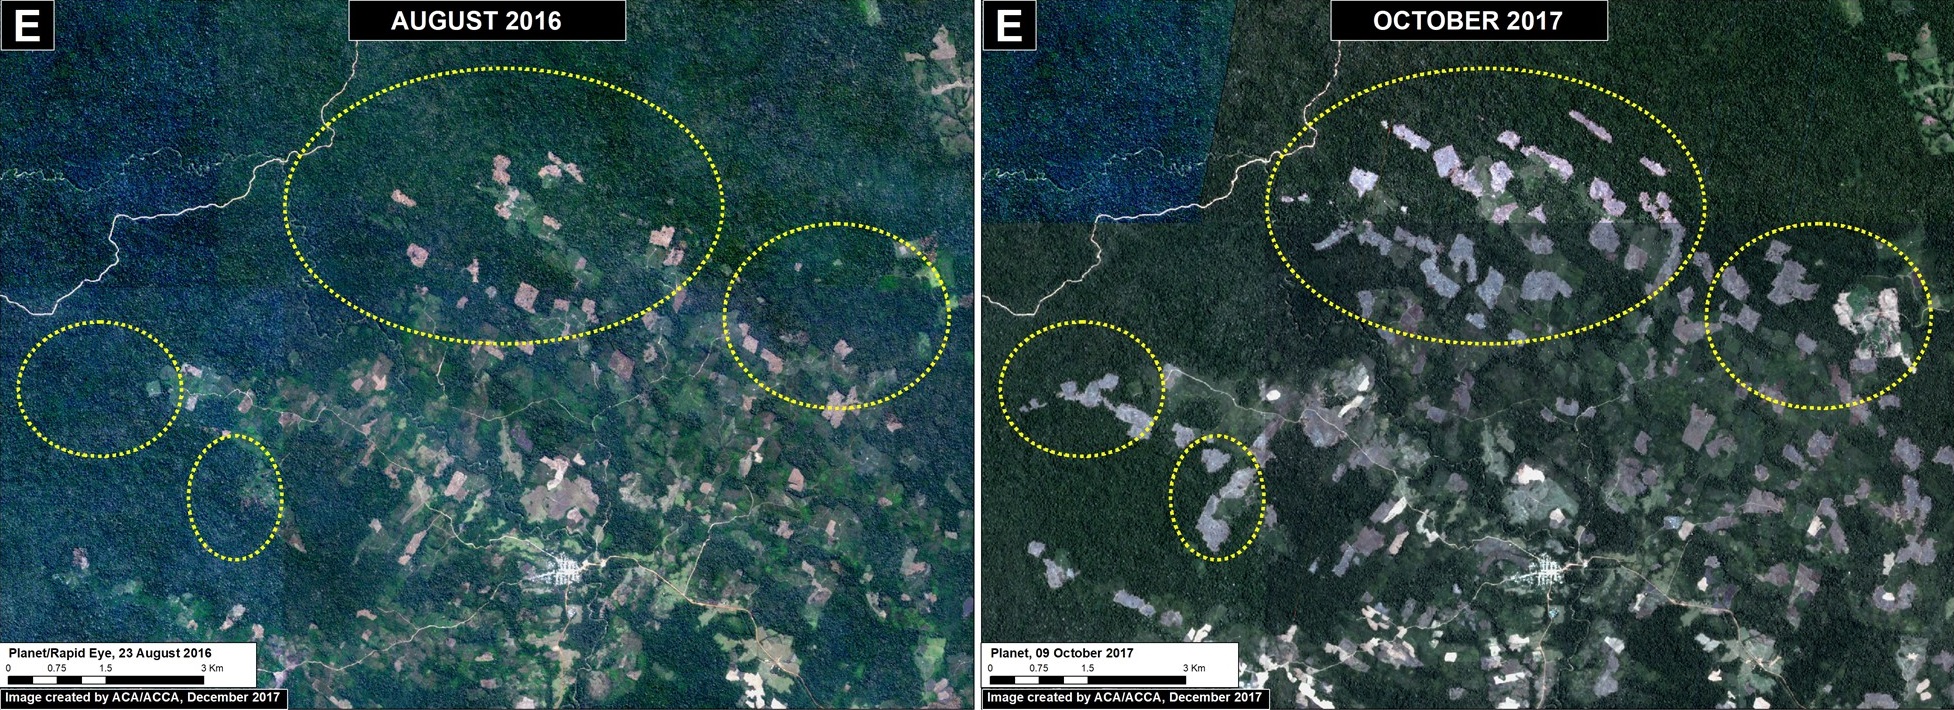
On the other side of Madre de Dios, along the Interoceanic Highway near the border with Brazil and Bolivia, is the town of Iberia. This area has become a major deforestation hotspot in recent years. We documented the deforestation of 2,250 acres (910 hectares) in 2017 (Image 76e). Since 2014, the total deforestation around Iberia is 6,795 acres (2,750) hectares. A large part of the deforestation is within forestry concessions, indicating that these concessions have been invaded. The cause of the deforestation is small-scale agriculture (specifically, according to local sources, corn, papaya, and cacao).

Image 76e. Data: Planet

Tahuamanu (Inset F)

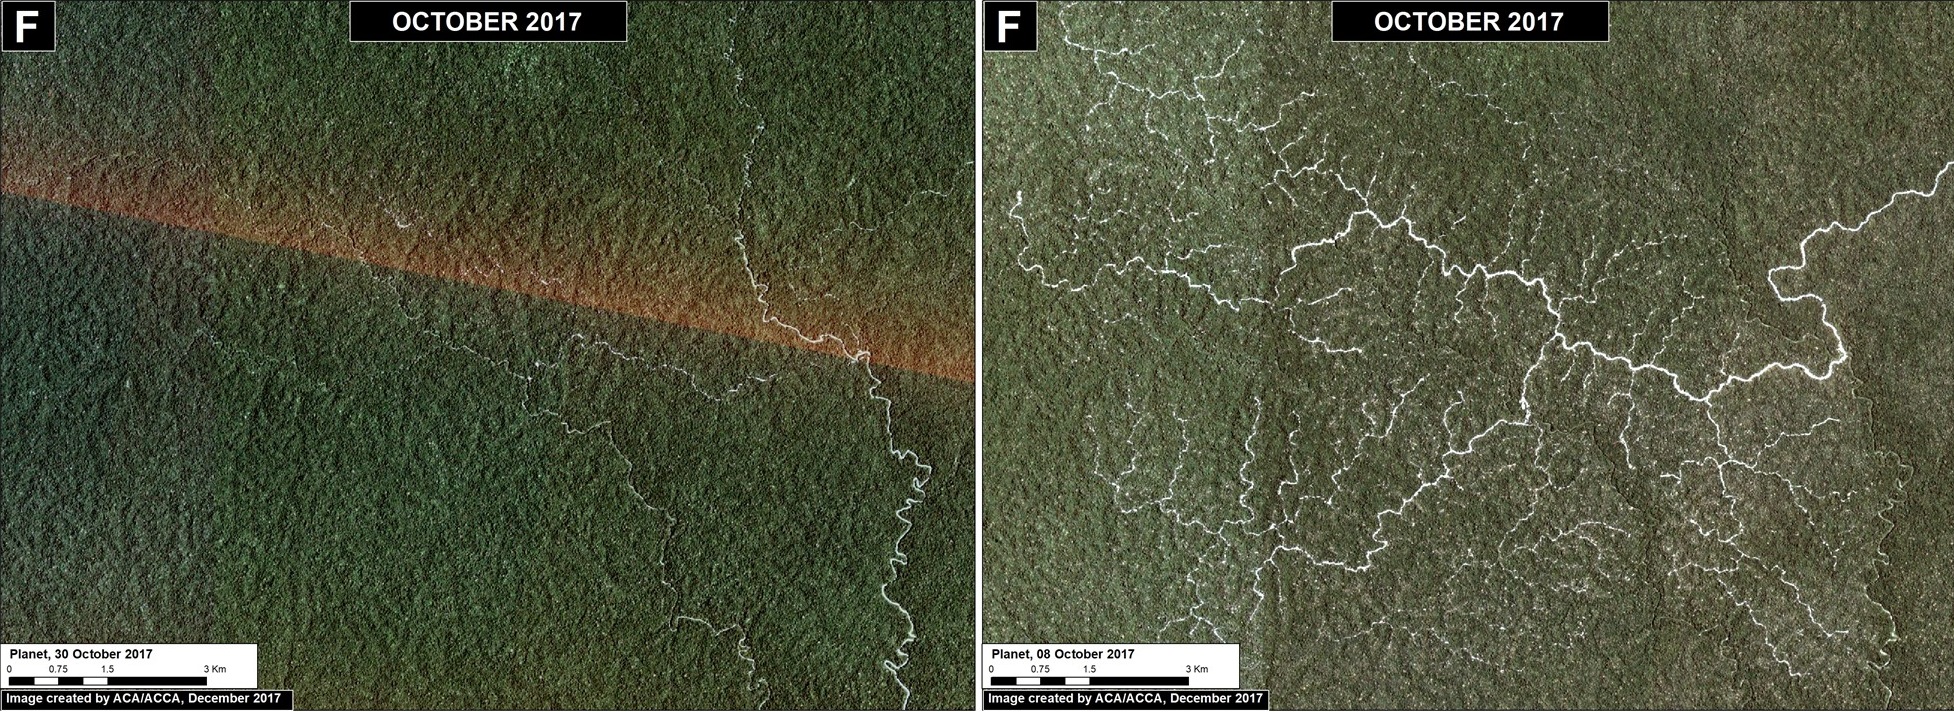
To the west of Iberia, an isolated hotspot emerged caused by the rapid proliferation of logging roads. This hotspot is located within a forestry concession, but its impact is troubling due to the extension and density of the new road network. We estimate the construction of 130 km of new logging forest roads in this area in 2017 (Image 76f).

Image 76f. Data: Planet

Las Piedras (Inset G)

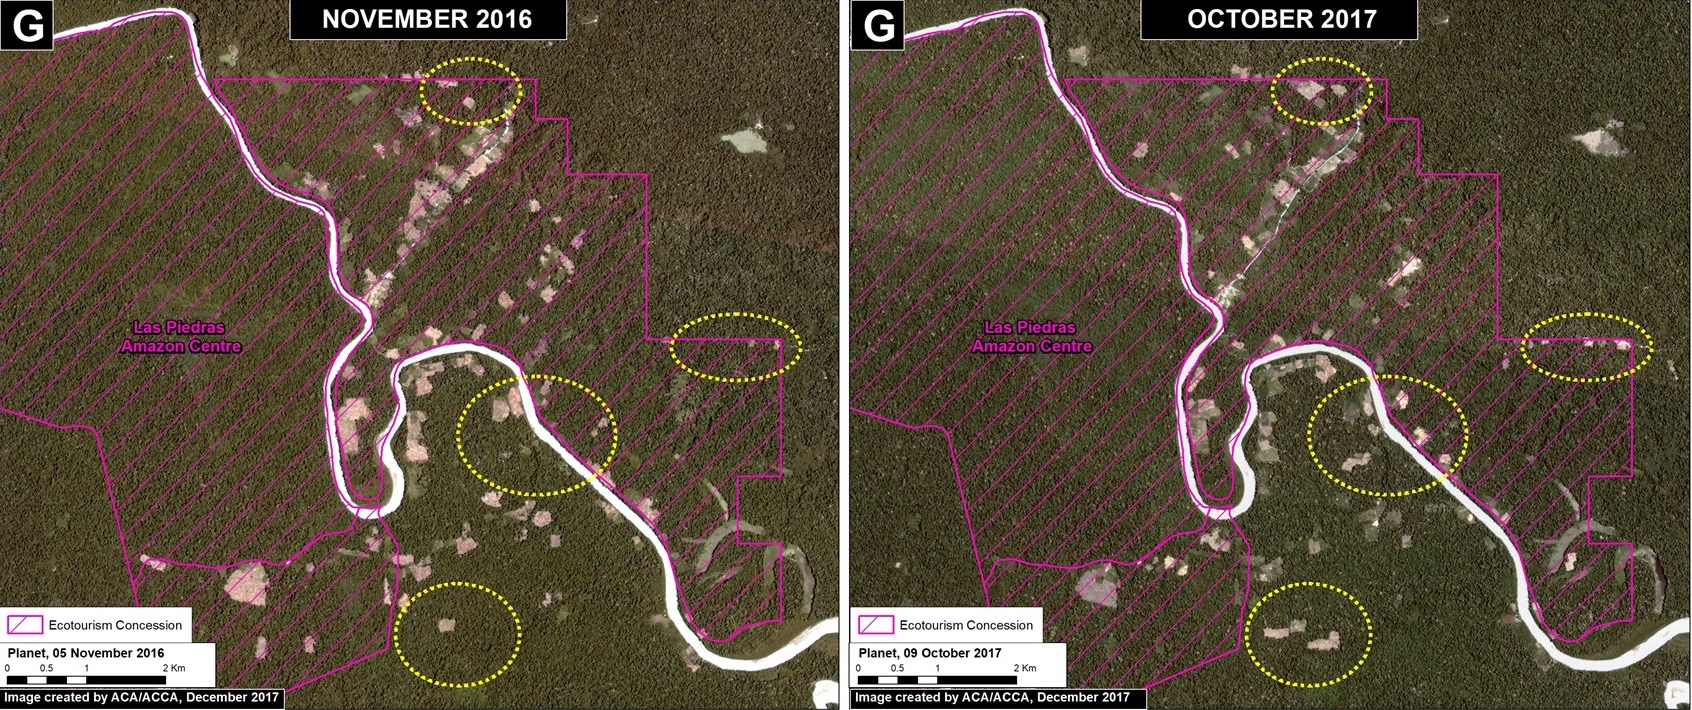
Finally, deforestation continues within two ecotourism concessions along the Las Piedras River, a remote area famous for its exceptional wildlife (see this video). We documented the deforestation of 300 acres (134 hectares) in 2017 (Image 76g). Since 2013, the total deforestation along the Las Piedras River is 1,495 acres (605 hectares). Note that the Las Piedras Amazon Center Ecotourism Concession represents an effective barrier against deforestation impacting the surrounding concessions. According to local sources, the main causes of deforestation are cacao plantations and cattle pasture.

Image 76g. Data: Planet

Coordinates

Zona A: -12.99, -69.90
Zona B: -13.05, -70.17
Zona C: -12.85, -70.26
Zona D: -12.84, -69.99
Zona E: -11.31, -69.61
Zona F: -11.23, -70.05
Zona G: -11.601711, -70.477295

References

Planet Team (2017). Planet Application Program Interface: In Space for Life on Earth. San Francisco, CA. https://api.planet.com

Citation

Finer M, Novoa S, Garcia R (2017) Pope to visit Madre de Dios (Peru), region with Deforestation Crisis. MAAP: 75.

MAAP #68: 2017 DEFORESTATION HOTSPOTS IN THE PERUVIAN AMAZON (Part 2)

Image 68. Base map. Data: PNCB/MINAM, UMD/GLAD, SERNANP.

In a previous report, MAAP #65, we presented information about deforestation hotspots in 2017 in the Peruvian Amazon, based on early warning alert data from January until mid-July.

Between July and August, the amount of alerts greatly increased, likely due to arrival of the dry season. Thus, this report includes new updated data until mid-August.*

We find new deforestation hotspots in the regions of Madre de Dios and Ucayali (see base map).** At the national level, we now estimate the forest loss of 111,200 acres (45,000 hectares) thus far in 2017 (thru August 17).***

Below, we present satellite imagery of the following hotspots:

– La Pampa, Madre de Dios (Inset A)
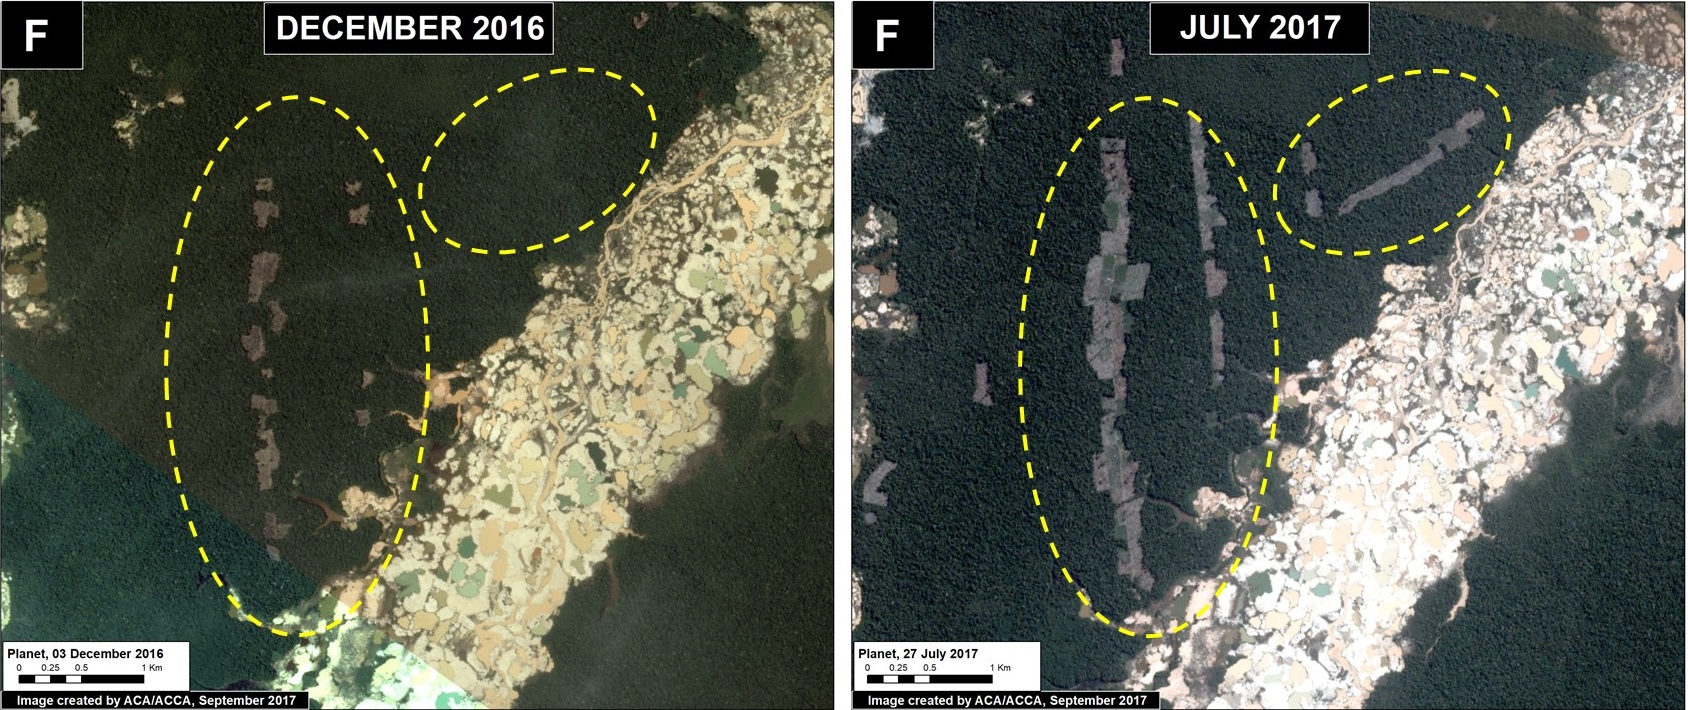
– Guacamayo, Madre de Dios (Inset F)
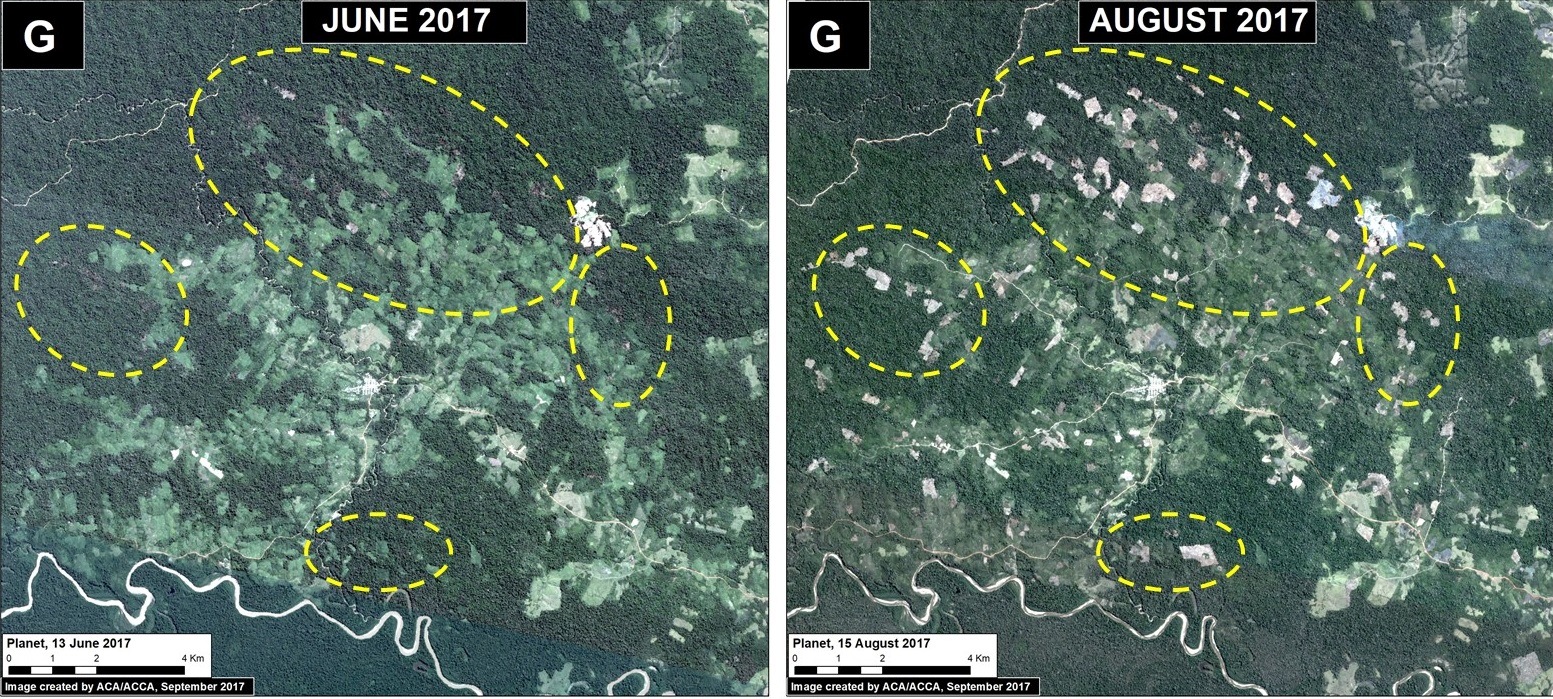
– Iberia, Madre de Dios (Inset G)
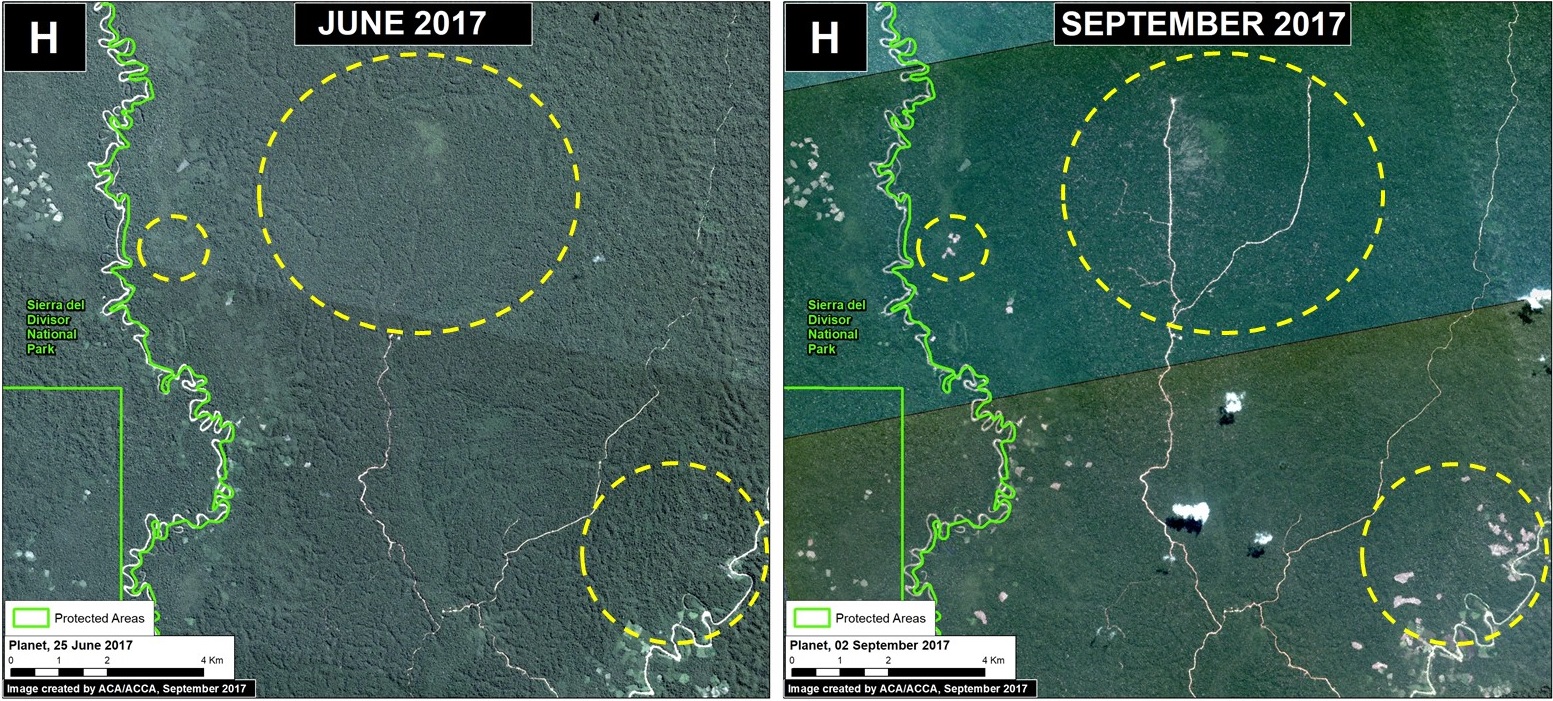
– South of Sierra del Divisor, Ucayali (Inset H)
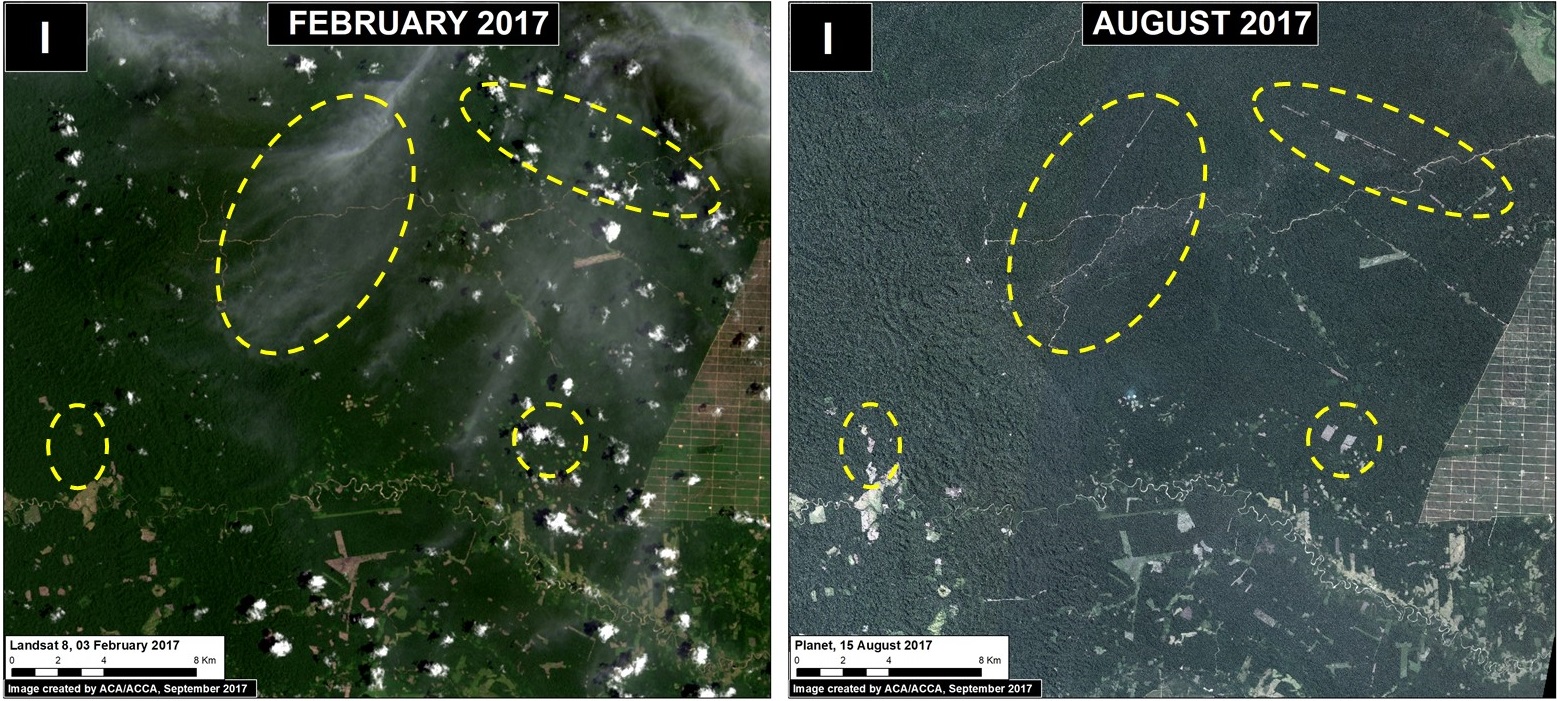
– Nueva Requena, Ucayali (Inset I)

**The data were generated by the National Program of Forest Conservation for Climate Change Mitigation, Peruvian Ministry of Environment (PNCB/MINAM).

**See Hotspots A-E in MAAP #65

***We emphasize that our calculations are just estimates. Official forest loss data are produced annually by the Peruvian Ministry of Environment.


La Pampa, Madre de Dios (Inset A)

Illegal gold mining deforestation continues to expand in the buffer zone of Tambopata National Reserve in the southern Peruvian Amazon. The Peruvian Government has conducted several interventions this year, most notably in July. However, between July and August we documented the additional loss of 67 acres (27 hectares), increasing the 2017 total deforestation in this zone to 1,280 acres (517 hectares). Image 68a is a GIF illustrating the gold mining deforestation from January to September 2017.

Image 68a. Data: Planet

Guacamayo, Madre de Dios (Inset F)

North of La Pampa, in another gold mining zone, known as Guacamayo, we have documented the rapid deforestation of 182 acres (74 hectares). This newly deforested area is located next to the mining zone (within a forestry concession), and appears to be caused by agricultural activity.

Image 68f. Data: Planet

Iberia, Madre de Dios (Inset G)

Around the  town of Iberia, located along the Interoceanica highway near the border with Brazil, has recently become a major deforestation hotspot (see MAAP #28 and MAAP #47). Between June and August 2017, we detected the deforestation of 1,075 acres (435 hectares). Much of this deforestation is within forestry concessions, indicating that the concessions have been invaded. The deforestation appears  to be caused by agriculture (according to local sources, the clearing is for corn plantations).

Image 68g. Data: Planet.

South of Sierra del Divisor, Ucayali (Inset H)

In the central Peruvian Amazon, just south of Sierra del Divisor National Park, we detected the new construction of 25 km of logging roads in the forestry concessions surrounding the park. We also detected the deforestation of 138 acres (56 hectares), close to the National Park’s limit for what appears to be agricultural activity.

Image 68h. Data: Planet, SERNANP

Nueva Requena, Ucayali (Inset I)

Also in the central Peruvian Amazon, in the Nueva Requena district near two controversial oil palm plantations (MAAP #41), we detected the deforestation of 1,130 acres (457 hectares) in state forestry lands (known as Permanent Production Forest). This includes 26 km of new logging and agricultural roads. It is important to note that this area was recently in the news regarding the killing of six farmers over land rights dispute.

Image 68i. Data: Planet

References

Planet Team (2017). Planet Application Program Interface: In Space for Life on Earth. San Francisco, CA. https://api.planet.com.

Citation

Finer M, Novoa S, Olexy T (2017) 2017 Deforestation Hotspots in the Peruvian Amazon (Part 2). MAAP: 68.

MAAP #65: Deforestation Hotspots of 2017 in the Peruvian Amazon

Image 65. Data: MINAM/PNCB, UMD/GLAD, SERNANP, MAAP

In an earlier report, MAAP #40, we highlighted the power of combining early warning GLAD* alerts with analysis of high-resolution satellite images (for example, from the company Planet), as part of a comprehensive near real-time deforestation monitoring system.

In the current report, we analyze the GLAD alerts for the first half of 2017 (through July 17) to identify current deforestation hotspots in the Peruvian Amazon.** These alerts indicate an estimated total forest loss of 37,000 acres (15,000 hectares) thus far during the year.

Image 65 (see right) highlights the 2017 deforestation hotspots, defined here as areas with medium to high density of forest loss.

Below, we describe and show images of the most intense hotspots, indicated in red and orange.

These areas include:

  • Buffer zones of Tambopata National Reserve and Cordillera Azul National Park
  • Natural loss due to blowdowns from “hurricane winds,” in the Madre de Dios region
  • Northwest border with Colombia


Buffer Zone of Tambopata National Reserve 

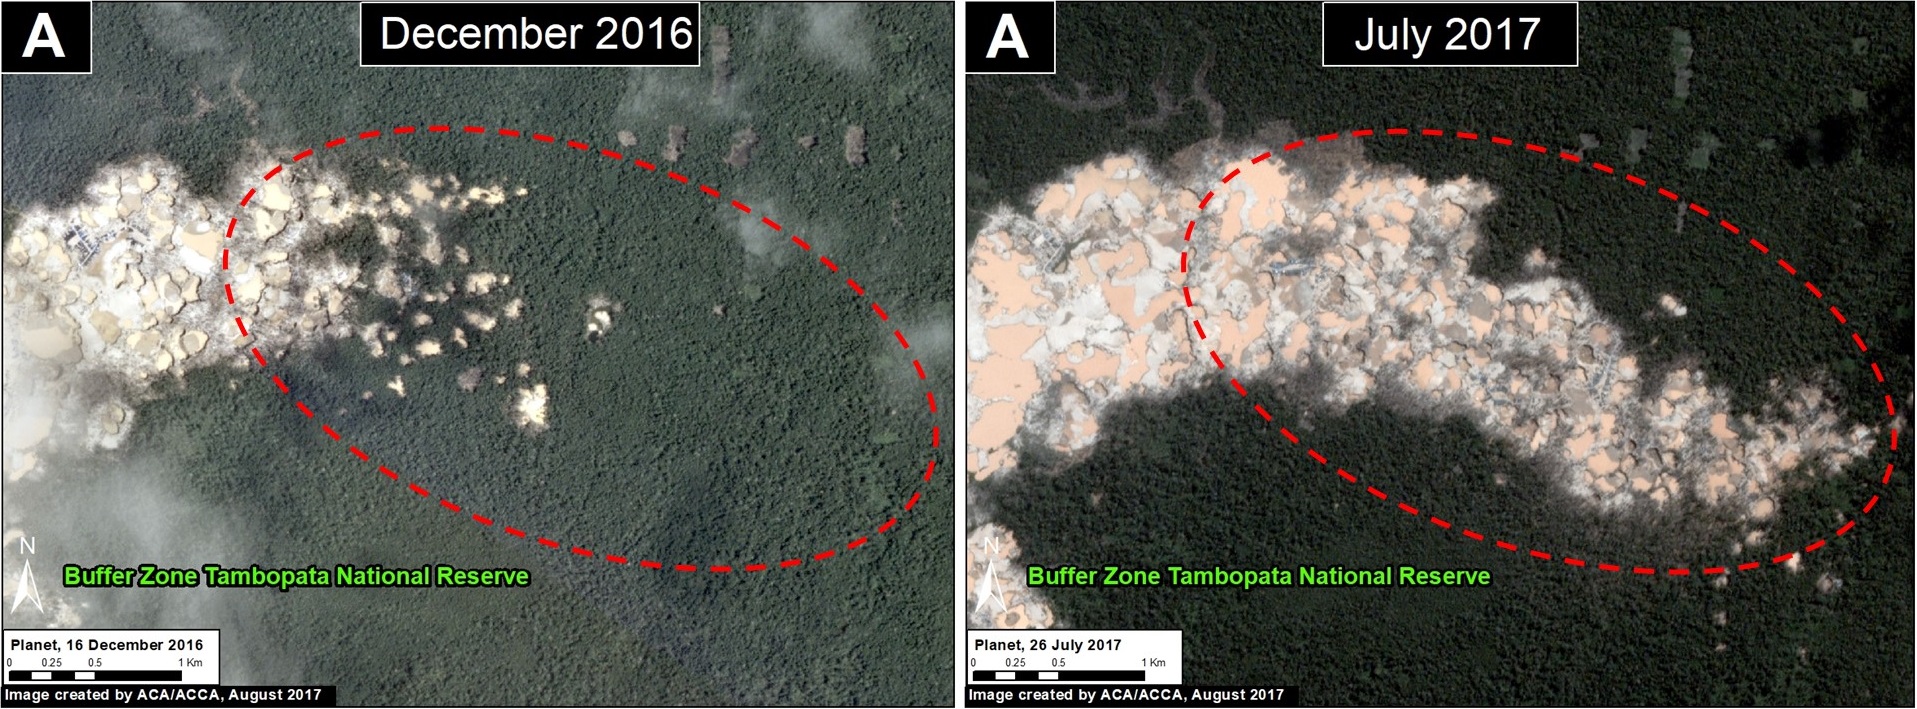
Inset A indicates an area of high intensity deforestation due to gold mining activity in the buffer zone of Tambopata National Reserve in the southern Peruvian Amazon (Madre de Dios region). Image 65a shows the deforestation of 1,210 acres (490 hectares) in this area in 2017. The Peruvian government recently (early July) led a major raid in this area. However, the most recent satellite images (late July – early August) indicate that mining camps are still present in the area.

Image 65a. Data: Planet

Hurricane Winds

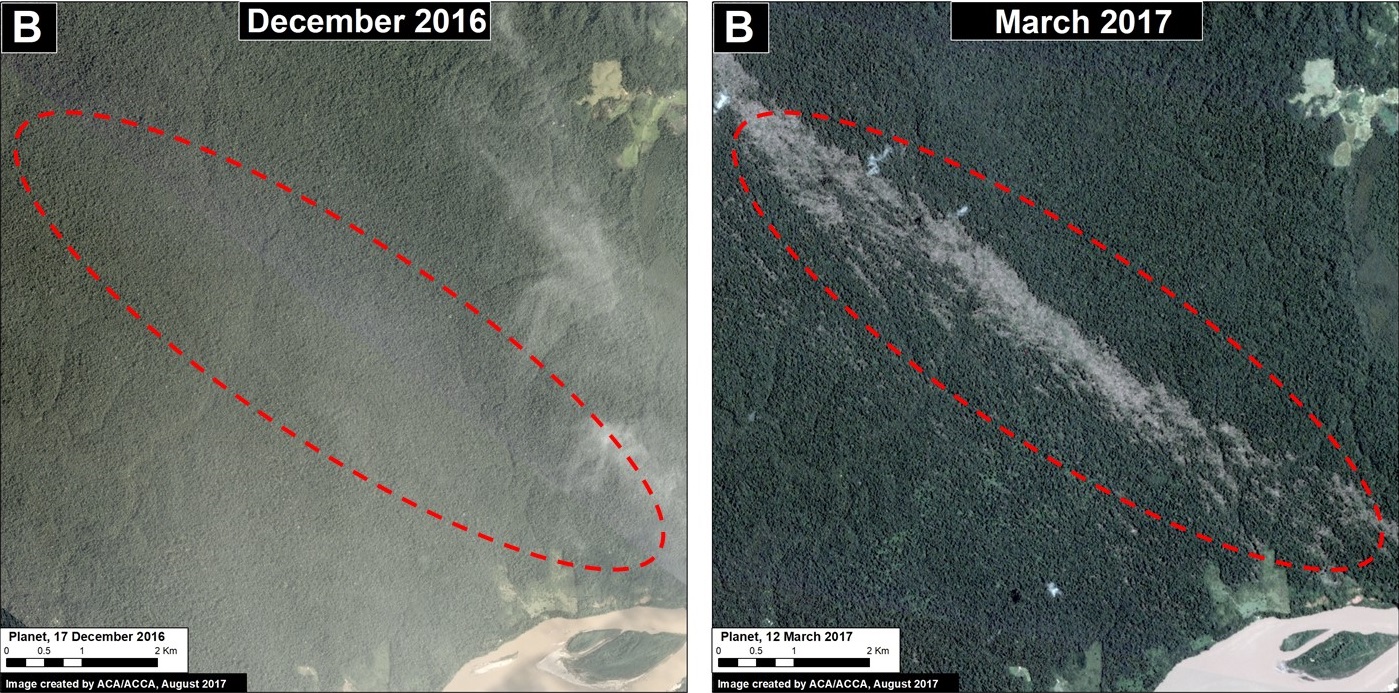
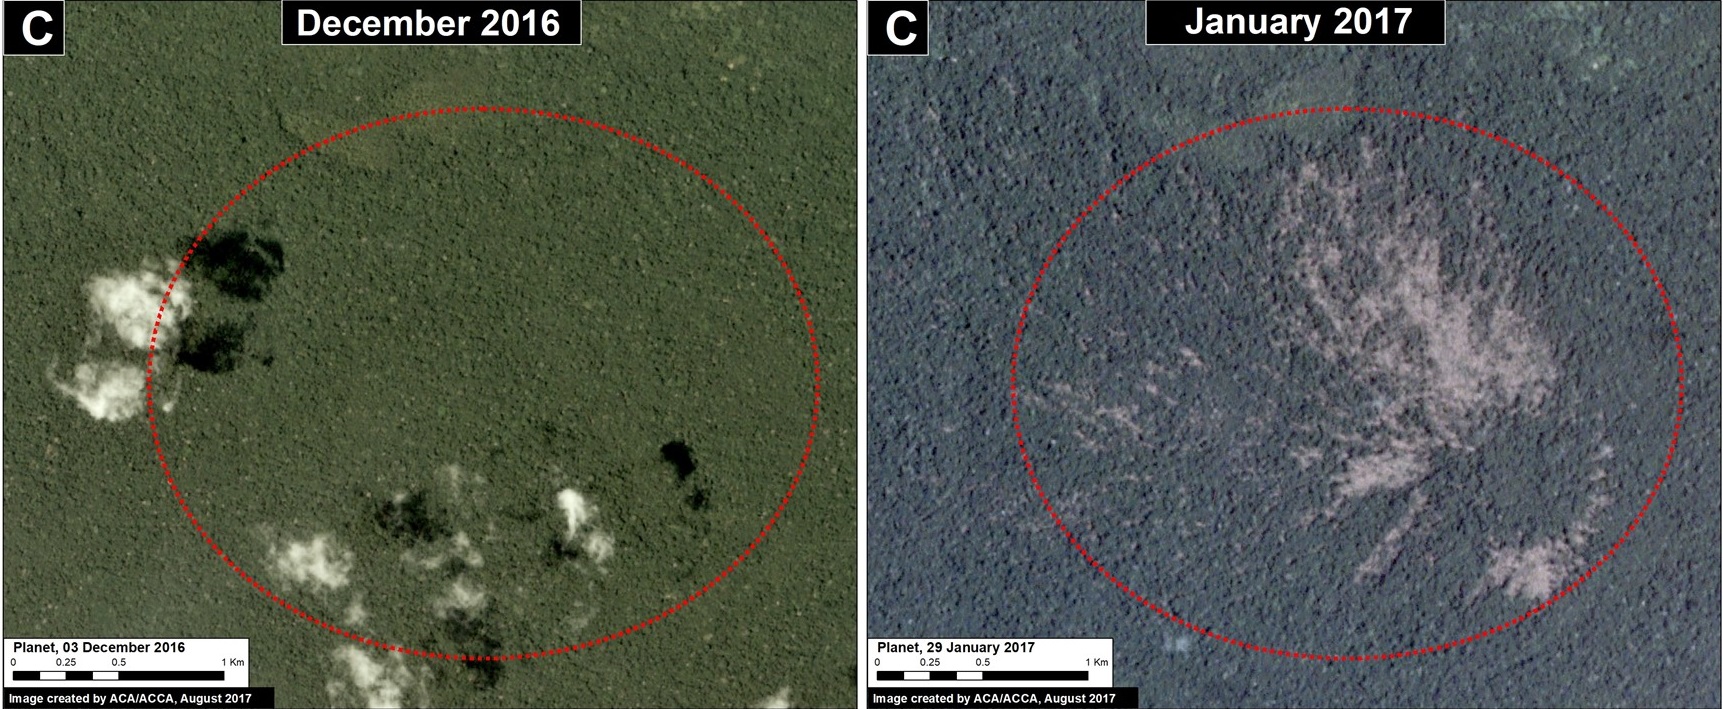
Insets B and C indicate two areas in the southern Peruvian Amazon (Madre de Dios region) that experienced the natural forest loss of 980 acres (400 hectares) caused by hurricane winds, localized thunderstorms with strong winds. Images 65b and 65c show the recent 2017 forest loss. See MAAP #54 and MAAP #55 for more details about hurricane winds.

Image 65b. Data: Planet
Image 65c. Data: Planet

Buffer Zone of Cordillera Azul National Park

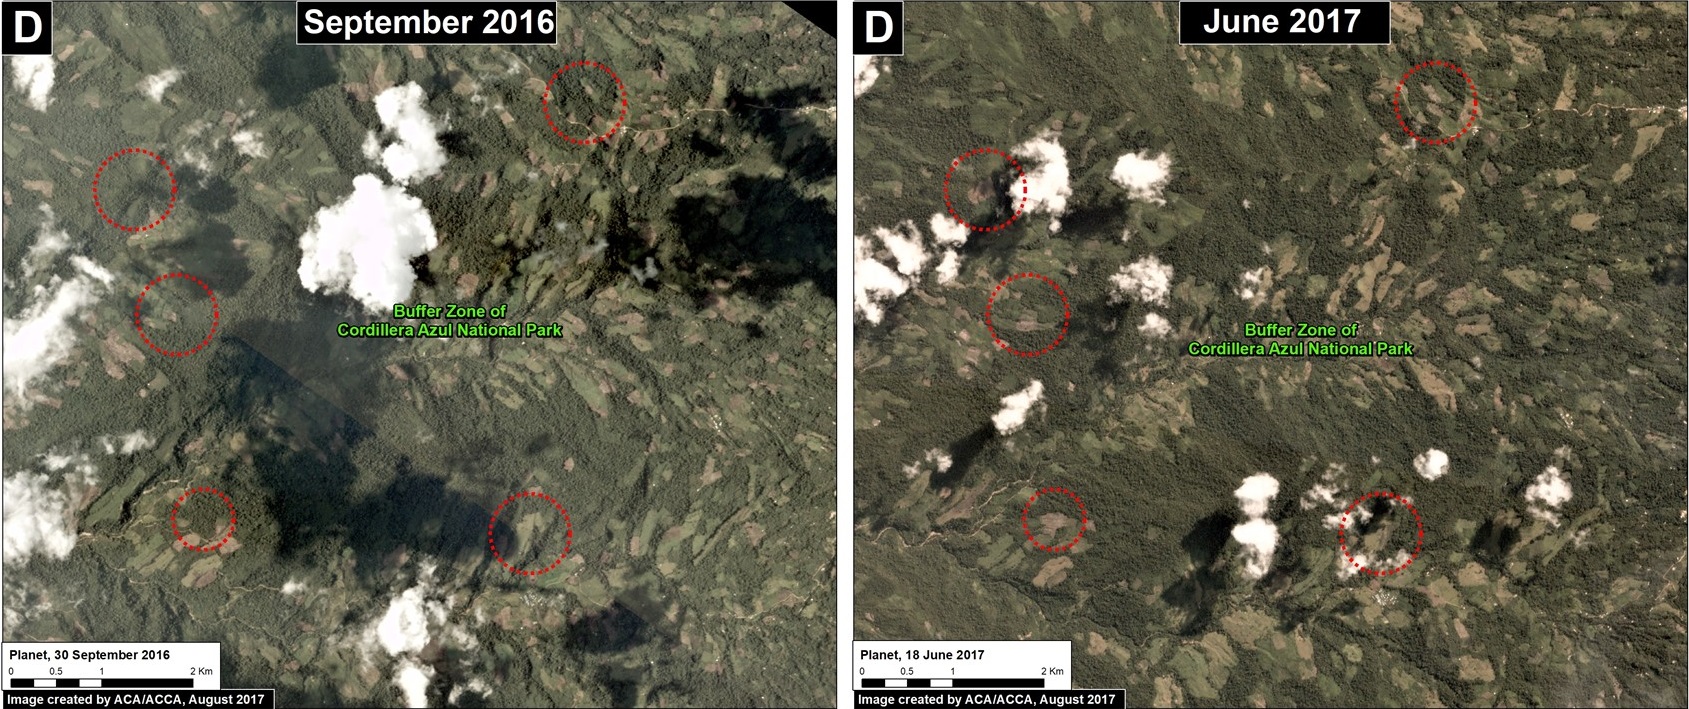
Inset D shows an area of medium intensity deforestation in the buffer zone of Cordillera Azul National Park, in the central Peruvian Amazon (San Martin region). Image 65d shows an example of the deforestation (138 acres) in this area in 2017. The main cause of the deforestation appears to be agricultural activity.

Image 65d. Data: Planet

Northwest Border with Colombia

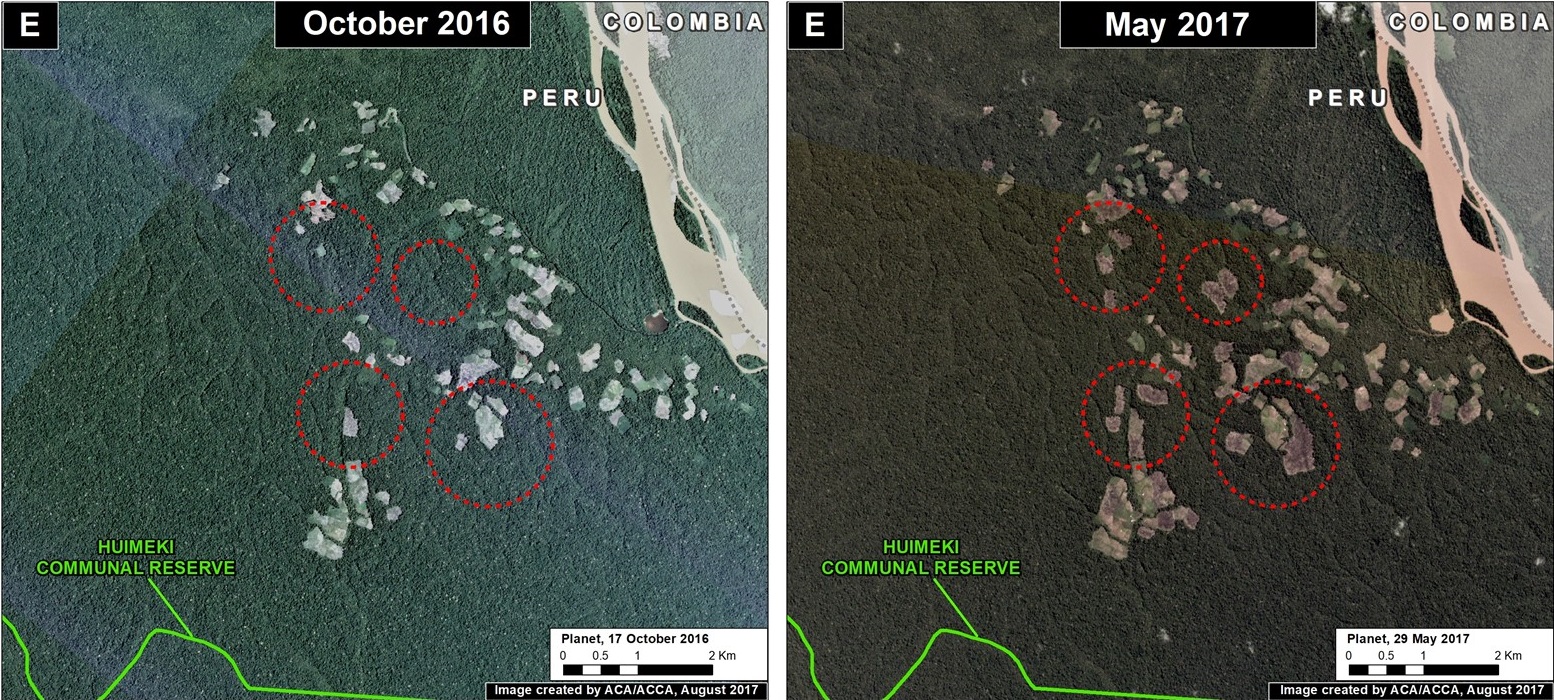
Inset E indicates a medium intensity hotspot in the extreme northern Peruvian Amazon (Loreto region), along the border with Colombia. The deforestation is approaching the limit of the Huimeki Communal Reserve. Image 65e shows the deforestation of 390 acres (158 hectares) in this area in 2017. The driver appears to be linked to agricultural activities and illicit crops (The United Nations has confirmed coca in this area).

Image 65e. Data: Planet

Notes

*GLAD alerts are a powerful new tool to monitor tropical forest loss in near real-time. This early warning system, created by the GLAD (Global Land Analysis and Discovery) laboratory at the University of Maryland and supported by Global Forest Watch, was launched in March 2016 as the first Landsat-based (30-meter resolution) forest loss alert system (previous systems were based on lower-resolution imagery). The alerts are updated weekly and can be accessed through Global Forest Watch.

**We performed a kernel density estimation, an analysis that calculates the magnitude per unit area of a particular phenomenon, in this case, forest loss.

Reference

Planet Team (2017). Planet Application Program Interface: In Space for Life on Earth. San Francisco, CA. https://api.planet.com.

Citation

Novoa S, Finer M (2017) Deforestation Hotspots in the Peruvian Amazon in 2017. MAAP: 65.


MAAP #63: Patterns of Deforestation in the Colombian Amazon

We are excited to present our initial analysis of the Colombian Amazon, a work that reflects an important collaboration with our colleagues at Amazon Conservation Team. It is also our first report in the more interactive “Story Map” format.

This report has two objectives: 1) Illustrate the major deforestation hotspots in the Colombian Amazon between 2001 and 2015 and 2) Focus in on one of the most important hotspots, located in the Caquetá department. In short, we show satellite imagery of the expanding forest loss in one of the most important deforestation hotspots in the Colombian Amazon.

Please follow this link to view the Story Map: https://www.maapprogram.org-deforestation-patterns-colombian-amazon/

MAAP SYNTHESIS #2: PATTERNS AND DRIVERS OF DEFORESTATION IN THE PERUVIAN AMAZON

We present our second synthesis report, building off our first report published in September 2015. This synthesis is largely based on the 50 MAAP reports published between April 2015 and November 2016. The objective is to synthesize all the information to date regarding deforestation trends, patterns and drivers in the Peruvian Amazon.

MAAP methodology includes 4 major components: Forest loss detection, Prioritize big data, Identify deforestation drivers, and Publish user-friendly reports. See Methodology section below for more details.

Our major findings include:

  • Trends. During the 15 years between 2001 and 2015, around 4,448,000 acres (1,800,000 hectares) of Peruvian Amazon forest has been cleared, with a steadily increasing trend. 2014 had the highest annual forest loss on record (438,775 acres), followed by a slight decrease  in 2015. The preliminary estimate for 2016 indicates that forest loss remains relatively high. The vast majority (80%) of forest loss events in the Peruvian Amazon are small-scale (<5 hectares), while large-scale events (> 50 hectares) pose a latent threat due to new agro-industrial projects.
  • Hotspots. We have identified at least 8 major deforestation hotspots. The most intense hotspots are located in the central Amazon (Huánuco and Ucayali). Other important hotspots are located in Madre de Dios and San Martin. Two protected areas (Tambopata National Reserve and El Sira Communal Reserve) are threatened by these hotspots.
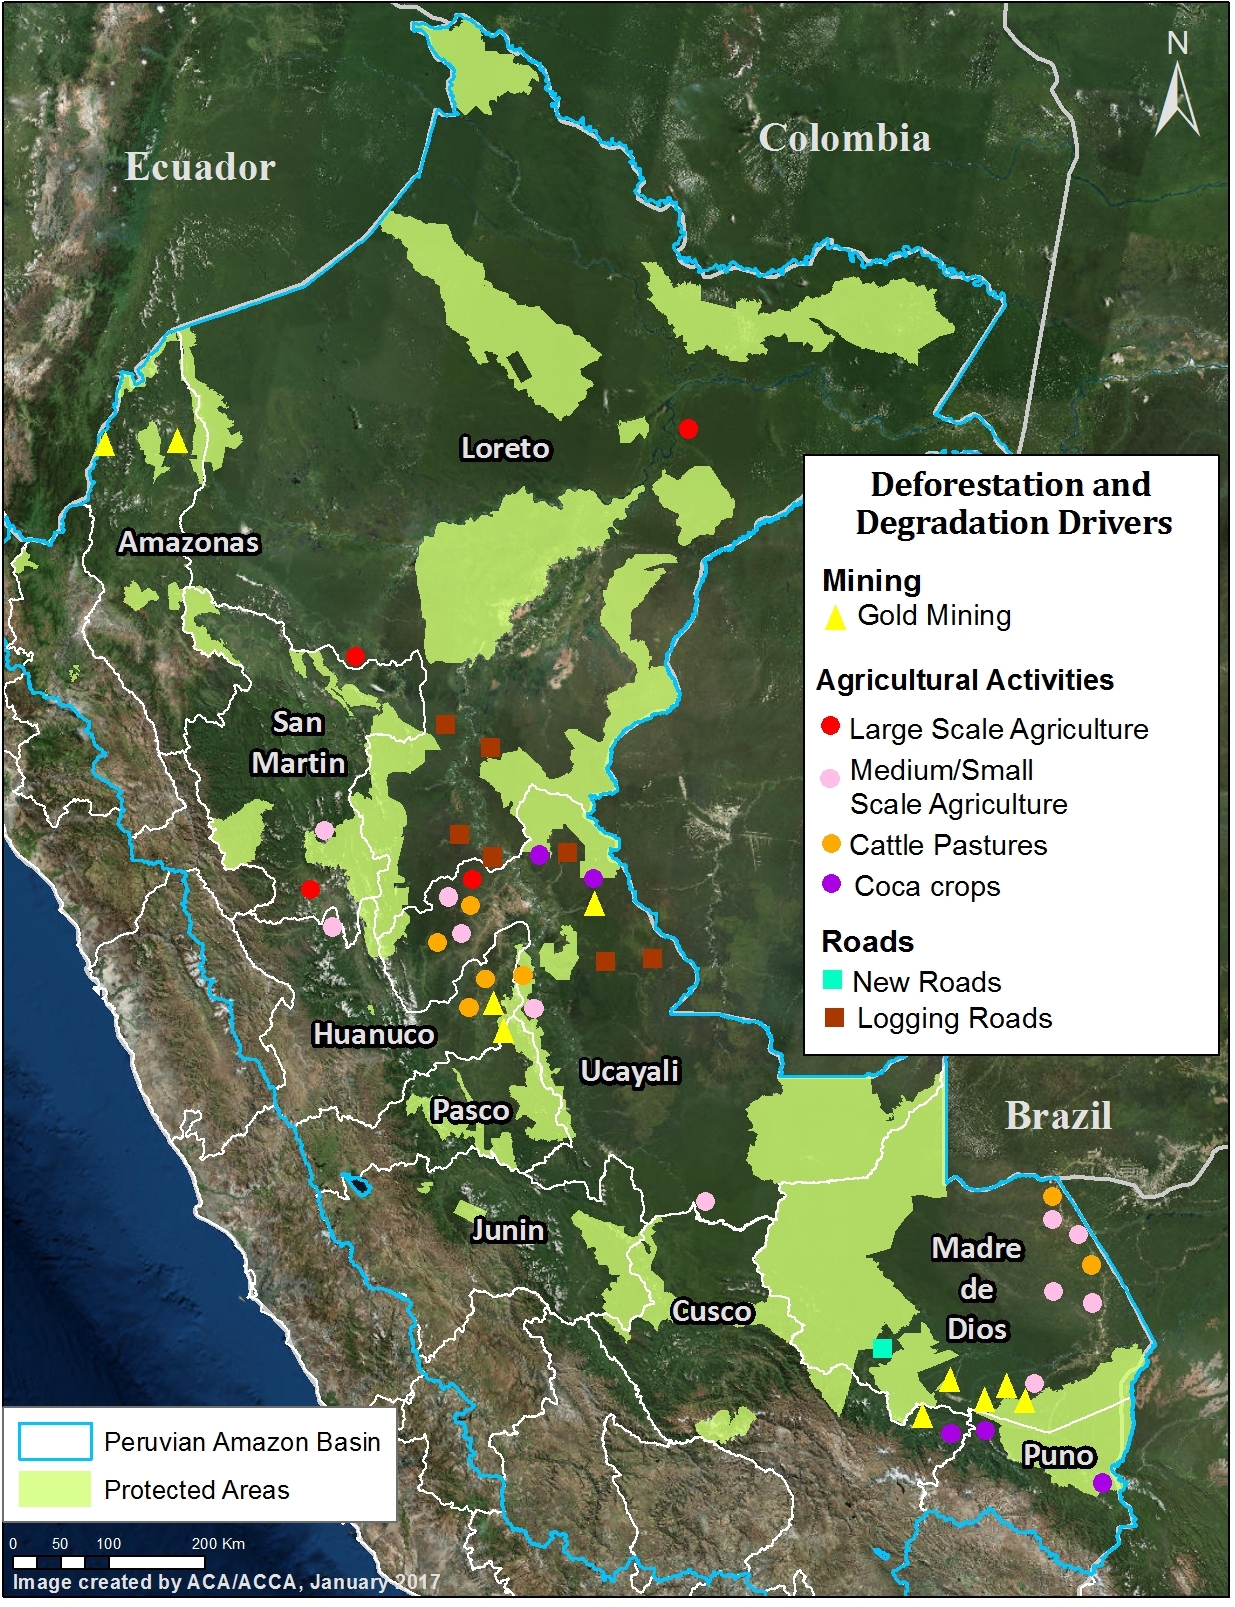
  • Drivers. We present an initial deforestation drivers map for the Peruvian Amazon. Analyzing high-resolution satellite imagery, we have documented six major drivers of deforestation and degradation: small/medium-scale agriculture, large-scale agriculture, cattle pasture, gold mining, illegal coca cultivation, and roads. Small-scale agriculture and cattle pasture are likely the most dominant drivers overall. Gold mining is a major driver in southern Peru. Large-scale agriculture and major new roads are latent threats. Logging roads are likely a major source of forest degradation in central Peru.

Deforestation Trends

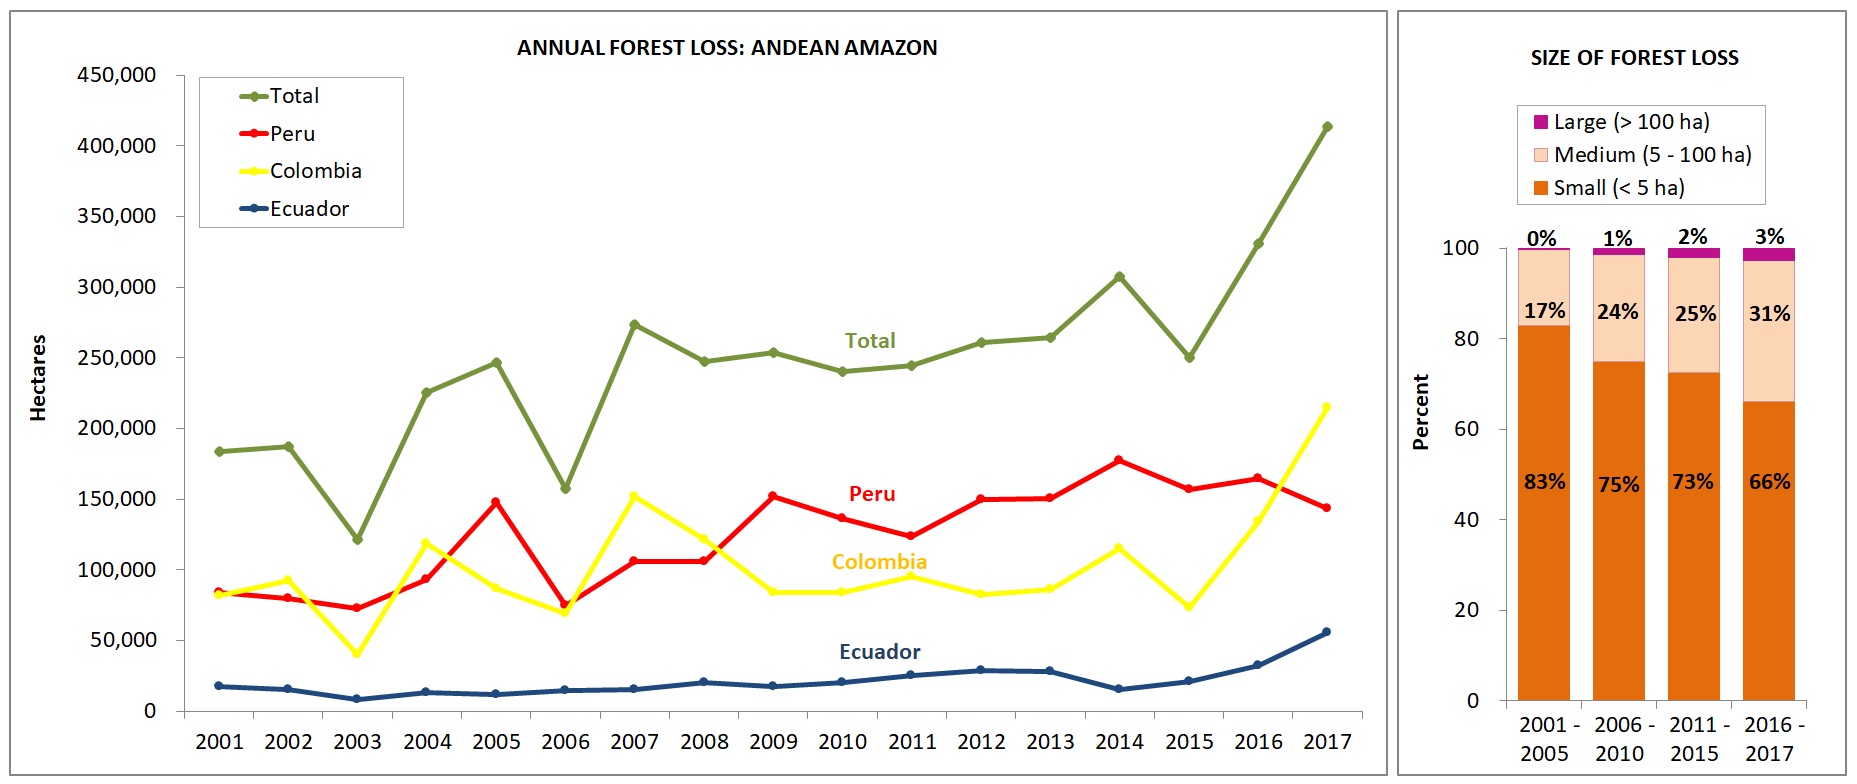
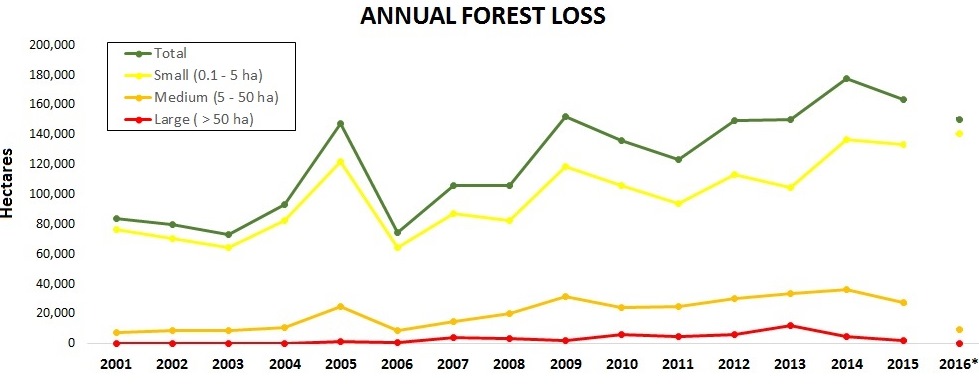
Image 1 shows forest loss trends in the Peruvian Amazon from 2001 to 2015, including a breakdown of the size of the forest loss events. This includes the official data from the Peruvian Environment Ministry, except for 2016, which is a preliminary estimate based on GLAD forest loss alerts.

Image 1. Data: PNCB/MINAM, UMD/GLAD. *Estimate based on GLAD alerts.

During the 15 years between 2001 and 2015, around 4,448,000 acres (1,800,000 hectares) of Peruvian Amazon forest has been cleared (see green line). This represents a loss of approximately 2.5% of the existing forest as of 2001.There have been peaks in 2005, 2009, and 2014, with an overall increasing trend. In fact, 2014 had the highest annual forest loss on record (386,626 acres). Forest loss decreased in 2015 (386,732 acres), but is still the second highest recorded. The preliminary estimate for 2016 indicates that forest loss continues to be relatively high.

It is important to note that the data include natural forest loss events (such as storms, landslides, and river meanders), but overall serves as our best proxy for anthropogenic deforestation. The non-anthropogenic forest loss is estimated to be approximately 3.5% of the total.1

The vast majority (81%) of forest loss events in the Peruvian Amazon are small-scale (<5 hectares, equivalent of 12 acres), see the yellow line. Around 16% of the forest loss events are medium-scale (5-50 hectares, equivalent of 12-124 acres), see the orange line. Large-scale (>50 hectares, equivalent of 124 acres) forest loss events, often associated with industrial agriculture, pose a latent threat. Although the average is only 2%, large-scale forest loss rapidly spiked to 8% in 2013 due to activities linked with a pair of new oil palm and cacao plantations. See MAAP #32 for more details on the patterns of sizes of deforestation events.

Deforestation Patterns

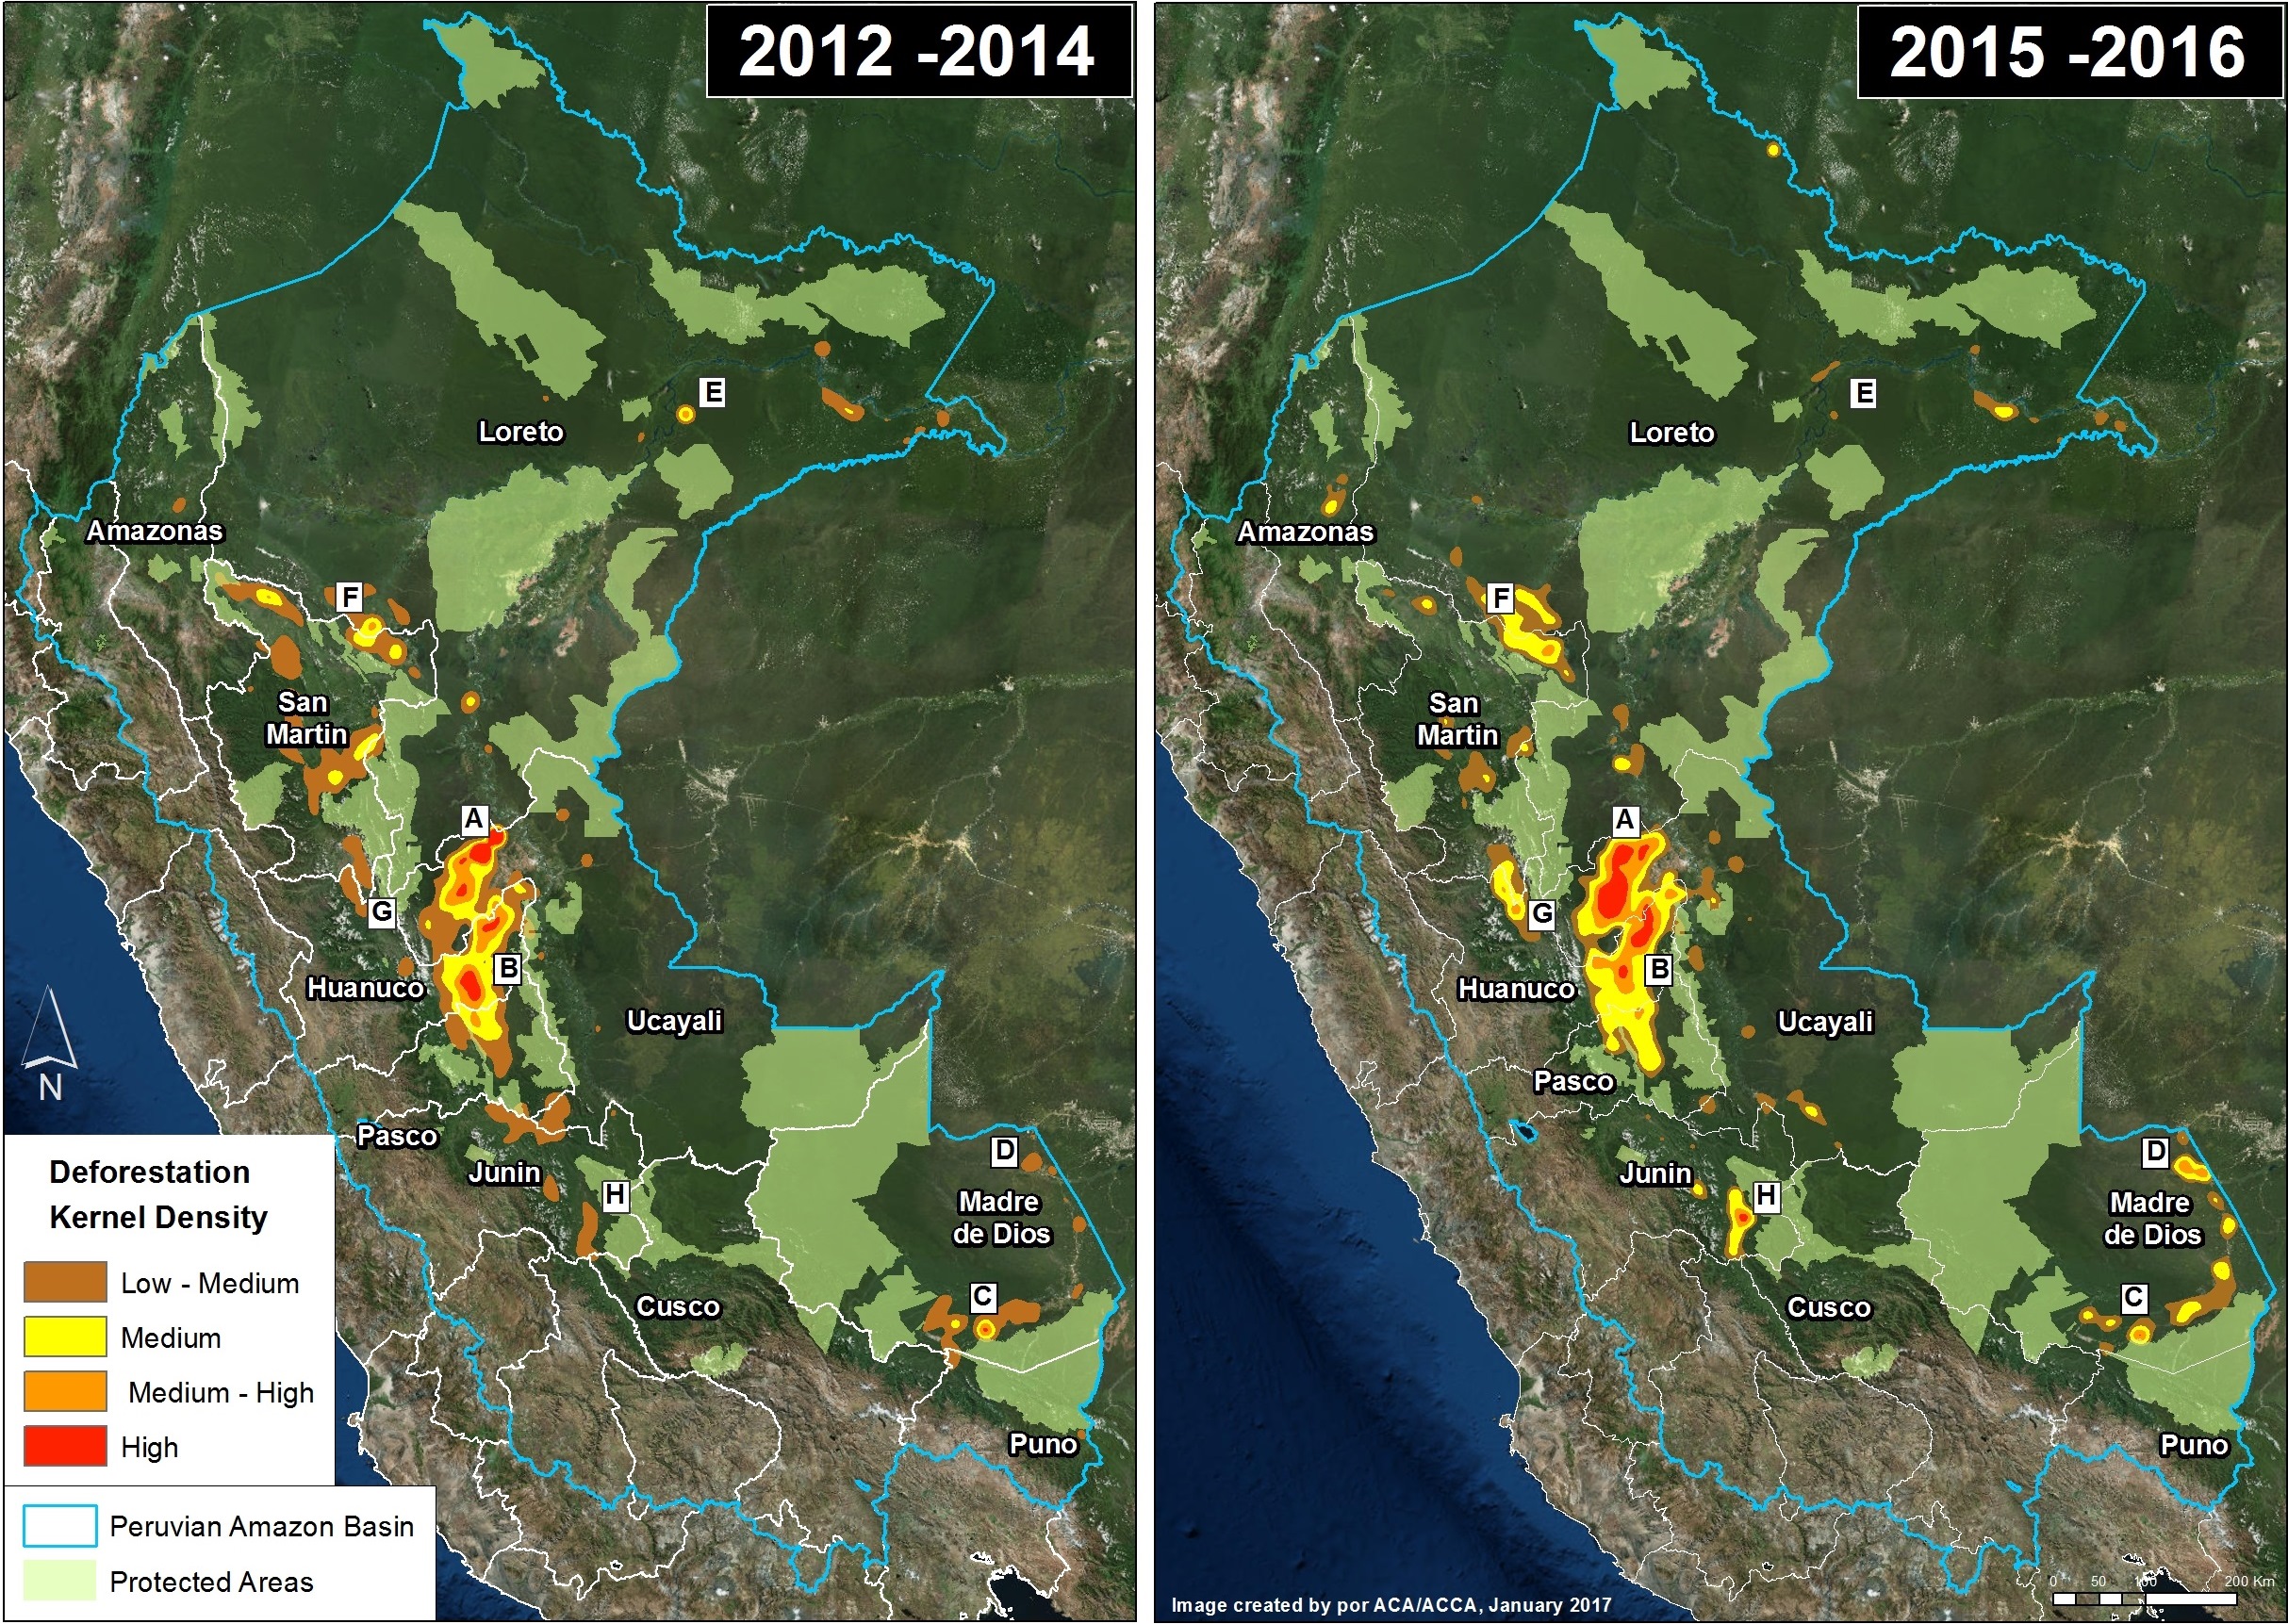
Image 2 shows the major deforestation hotspots in 2012-14 (left panel) relative to 2015-16 (right panel), based on a kernel density analysis.We have identified at least 8 major deforestation hotspots, labeled as Hotspots A-H.

Image 2. Data: PNCB/MINAM, GLAD/UMD. Click to enlarge.

The most intense hotspots, A and B, are located in the central Amazon. Hotspot A, in northwest Ucayali, was dominated by two large-scale oil palm projects in 2012-14, but then shifted a bit to the west in 2015-16, where it was dominated by cattle pasture and small-scale oil palm. Hotspot B, in eastern Huánuco, is dominated by cattle pasture (MAAP #26).

Hotspots C and D are in the Madre de Dios region in the southern Amazon. Hotspot C indicates the primary illegal gold mining front in recent years (MAAP #50). Hotspot D highlights the emerging deforestation zone along the Interoceanic Highway, particularly around the town of Iberia (MAAP #28).

Hotspots E-H are agriculture related. Hotspot E indicates the rapid deforestation for a large-scale cacao plantation in 2013-14, with a sharp decrease in forest loss 2015-16 (MAAP #35). Hotspot F indicates the expanding deforestation around two large-scale oil palm plantation (MAAP #41). Hotspot G indicates the intensifying deforestation for small-scale oil palm plantations (MAAP #48).

Hotspot H indicates an area impacted by intense wildfires in 2016.

Protected Areas, in general, are effective barriers against deforestation (MAAP #11). However, several protected areas are currently threatened, most notably Tambopata National Reserve (Hotspot C; MAAP #46). and El Sira Communal Reserve (Hotspot B; MAAP #45).

Deforestation Drivers

Image 3. Data: MAAP, SERNANP. Click to enlarge.

Surprisingly, there is a striking lack of precise information about the actual drivers of deforestation in the Peruvian Amazon. According to an important paper published in 2016, much of the existing information is vague and outdated, and is based solely on a general analysis of the size of deforestation events.3  

As noted above, one of the major advances of MAAP has been using high-resolution imagery to better identify deforestation drivers.

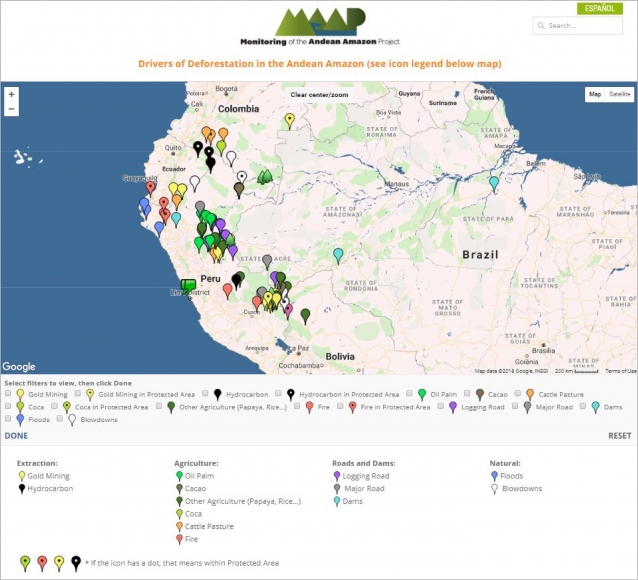
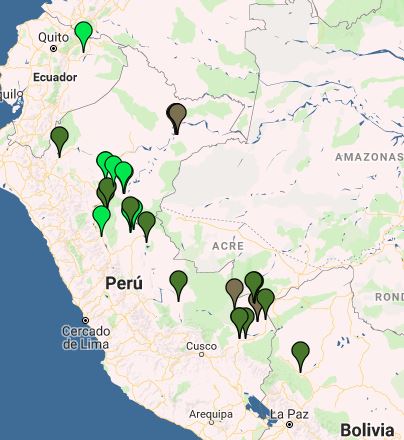
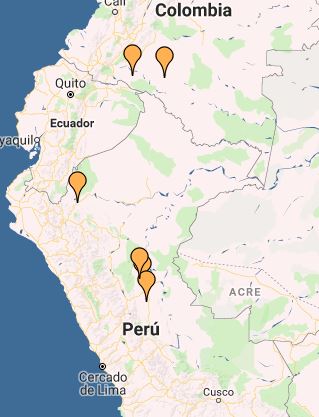
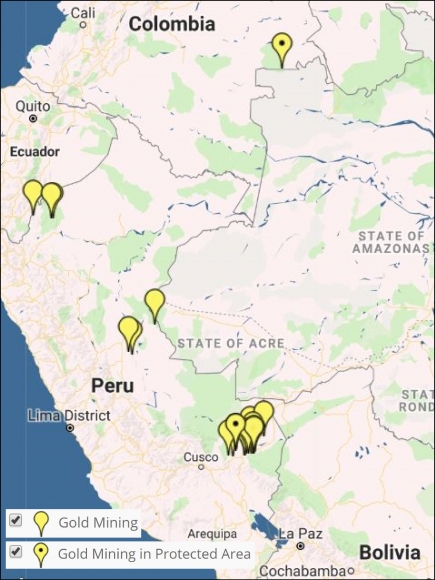
Image 3 shows the major deforestation drivers identified thus far by our analysis. As far as we know, it represents the first spatially explicit deforestation drivers map for the Peruvian Amazon.

To date, we have documented six major direct drivers of deforestation and degradation in the Peruvian Amazon: small/medium-scale agriculture, large-scale agriculture, cattle pasture, gold mining, illegal coca cultivation, and roads.

At the moment, we do not consider the hydrocarbon (oil and gas) and hydroelectric dam sectors as major drivers in Peru, but this could change in the future if proposed projects move forward.

We describe these major drivers of deforestation and degradation in greater detail below.

Small/Medium-scale Agriculture

The literature emphasizes that small-scale agriculture is the leading cause of deforestation in the Peruvian Amazon.However, there is little actual empirical evidence demonstrating that this is true.3 The raw deforestation data is dominated by small-scale clearings that are most likely for agriculture or cattle pasture. Thus, it is likely that small-scale agriculture is a major driver, but a definitive study utilizing high-resolution imagery and/or extensive field work is still needed to verify the assumption.

In several key case studies, we have shown specific examples of small-scale agriculture being a deforestation driver. For example, using a combination of high-resolution imagery, photos from the field, and local sources, we have determined that:

  • Oil Palm, in the form of small and medium-scale plantations, is one of the main drivers within deforestation Hotspot B (Ucayali; MAAP #26), Hotspot G (northern Huánuco; MAAP #48), and Hotspot F (Loreto-San Martin;MAAP #16). This was also shown for Ucayali in a recent peer-reviewed study.4 See below for information about large-scale oil palm.
  • Cacao is causing rapid deforestation along the Las Piedras River in eastern Madre de Dios (MAAP #23, MAAP #40). See below for information about large-scale cacao.
  • Papaya is an important new driver in Hotspot D, along the Interoceanic Higway in eastern Madre de Dios (MAAP #42).
  • Corn and rice plantations may also be an important driver in Hotspot D in eastern Madre de Dios (MAAP #28).

Large-scale Agriculture

Large-scale, agro-industrial deforestation remains a latent threat in Peru, particularly in the central and northern Amazon regions. This issue was put on high alert in 2013, with two cases of large-scale deforestation for oil palm and cacao plantations, respectively.

In the oil palm case, two companies that are part of the Melka group,5 cleared nearly 29,650 acres in Hotspot A in Ucayali between 2012 and 2015 (MAAP #4, MAAP #41). In the cacao case, another company in the Melka group (United Cacao) cleared 5,880 acres in Hotspot E in Loreto between 2013 and 2015 (MAAP #9, MAAP #13, MAAP #27, MAAP #35). Dennis Melka has explicitly stated that his goal is to bring the agro-industrial production model common in Southeast Asia to the Peruvian Amazon.6

Prior to these cases, large-scale agricultural deforestation occurred between 2007 and 2011, when oil palm companies owned by Grupo Palmas7 cleared nearly 17,300 acres for plantations in Hotspot H along the Loreto-San Martin border (MAAP #16). Importantly, we documented the additional deforestation of 24,215 acres for oil palm plantations surrounding the Grupo Palmas projects (MAAP #16).

In contrast, large-scale agricultural deforestation was minimal in 2015 and 2016. However, as noted above, it remains a latent threat. Both United Cacao and Grupo Palmas have expansion plans that would clear over 49,420 acres of primary forest in Loreto.8

Cattle Pasture

Using an archive of satellite imagery, we documented that deforestation for cattle pasture is a major issue in the central Peruvian Amazon. Immediately following a deforestation event, the scene of hundreds or thousands of recently cut trees often looks the same whether the cause is agriculture or cattle pasture. However, by using an archive of imagery and studying deforestation events from previous years, one can more easily determine the drivers of the forest loss. For example, after a year or two, agriculture and cattle pasture appear very differently in the imagery and thus it is possible to distinguish these two drivers.

Using this technique, we determined that cattle pasture is a major driver in Hotspots A and B, in the central Peruvian Amazon (MAAP #26, MAAP #37).

We also used this technique to determine that much of the deforestation in the northern section of El Sira Communal Reserve is due to cattle pasture (MAAP #45).

Maintenance of cattle pasture, and small-scale agriculture, are likely important factors behind the escaped fires that degrade the Amazon during intense dry seasons (MAAP #45, MAAP #47).

Gold Mining

Gold mining is one of the major drivers of deforestation in the southern Peruvian Amazon (Hotspot C). An important study found that gold mining cleared around 123,550 acres up through 2012.9 We built off this work, and by analyzing hundreds of high resolution imageres, found that gold mining caused the loss of an additional 30,890 acres between 2013 and 2016 (MAAP #50). Thus, gold mining is thus far responsible for the total loss of around 154,440 acres in southern Peru. Much of the most recent deforestation is illegal due to its occurrence in protected areas and buffer zones strictly off-limits to mining activities.

Most notably, we have closely tracked the illegal gold mining invasion of Tambopata National Reserve, an important protected area in the Madre de Dios region with renowned biodiversity and ecotourism. The initial invasion occurred in November 2015 (MAAP #21), and has steadily expanded to over 1,110 acres (MAAP #24, MAAP #30, MAAP #46). As part of this invasion, miners have modified the natural course of the Malinowski River, which forms the natural northern border of the reserve (MAAP #33). In addition, illegal gold mining deforestation continues to expand within the reserve’s buffer zone, particularly in an area known as La Pampa (MAAP #12, MAAP #31).

Further upstream, illegal gold mining is also expanding on the upper Malinowski River, within the buffer zone of Bahuaja Sonene National Park (MAAP #19, MAAP #43).

In contrast to the escalating situation in Tambopata, we also documented that gold mining deforestation has been contained in the nearby Amarakaeri Communal Reserve, an important protected area that is co-managed by indigenous communities and Peru’s national protected areas agency. Following an initial invasion of 27 acres in 2014 and early 2015, satellite imagery shows that management efforts have prevented any subsequent expansion within the protected area (MAAP #6, MAAP #44).

In addition to the above cases in Madre de Dios, gold mining deforestation is also increasingly an issue in the adjacent regions of Cusco and Puno (MAAP #14).

There are several small, but potentially emerging, gold mining frontiers in the central and northern Peruvian Amazon (MAAP #49). The Peruvian government has been working to contain the illegal gold mining in the El Sira Communal Reserve (MAAP #45). Further north in Amazonas region, there is gold mining deforestation along the Rio Santiago (MAAP #36, MAAP #49), and in the remote Condor mountain range along the border with Ecuador (MAAP #49).

Roads

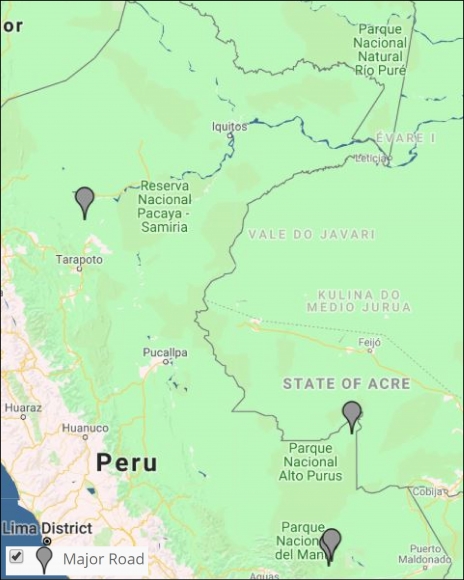
Roads are a well-documented driver of deforestation in the Amazon, particularly due to their ability to facilitate human access to previously remote areas.10 Roads often serve as an indirect driver, as most of the deforestation directly associated with agriculture, cattle pasture, and gold mining is likely greatly facilitated by proximity to roads. We documented the start of a controversial road construction project that would cut through the buffer zones of two important protected areas, Amarakaeri Communal Reserve and Manu National Park (MAAP #29).

Logging Roads

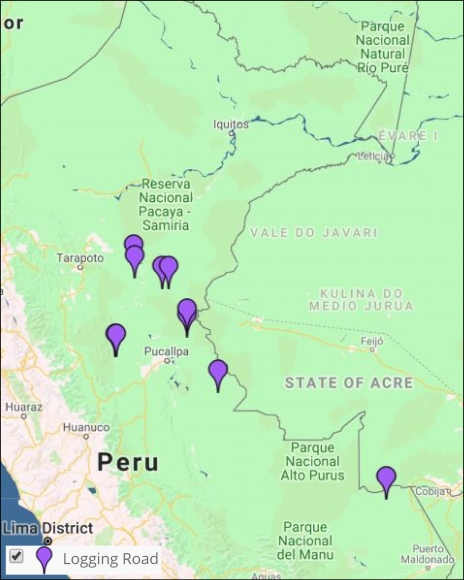
In relation to general roads described above, we distinguish access roads that are constructed to gain entry to a particular project. The most notable type of access roads in Peru are logging roads, which are likely a leading cause of forest degradation as they facilitate selective logging of valuable timber species in remote areas.

One of the major recent advances in forest monitoring is the ability to quickly identify the construction of new logging roads. The unique linear pattern of these roads appears quite clearly in Landsat-based tree cover loss alerts such as GLAD and CLASlite. This advance is important because it is difficult to detect illegal logging in satellite imagery because loggers in the Amazon often selectively cut high value species and do not produce large clearings. But now, although it remains difficult to detect the actual selective logging, we can detect the roads that indicate that selective logging is taking place in that area.

In a series of articles, we highlighted the recent expansion of logging roads, including the construction of 1,134 km between 2013 and 2015 in the central Peruvian Amazon (MAAP #3, MAAP #18). Approximately one-third of these roads were within the buffer zones of Cordillera Azul and Sierra del Divisor National Parks (MAAP #15).

We documented the construction of an additional 83 km of logging roads during 2016,  (MAAP #40, MAAP #43) including deeper into the buffer zone of Cordillera Azul National Park.

Another major finding is the rapid construction of the logging roads. In several cases, we documented the construction rate of nearly five kilometers per week (MAAP #18, MAAP #40, MAAP #43).

Determining the legality of these logging roads is complex, partly because of the numerous national and local government agencies involved in the authorization process. Many of these roads are near logging concessions and native communities, whom may have obtained the rights for logging from the relevant forestry authority (in many cases, the regional government).

Coca

According to a recent United Nations report, the Peruvian land area under coca cultivation in 2015 (99,580 acres) was the lowest on record (since 2001) and part of a declining trend since 2011 (154,440 acres).11 There are 13 major coca growing zones in Peru, but it appears that only a few of them are actively causing new deforestation. Most important are two coca zonas in the region of Puno that are causing deforestation within and around Bahuaja Sonene National Park (MAAP #10, MAAP #14). Several coca zones in the regions of Cusco and Loreto may also be causing some new deforestation.

Hydroelectric Dams

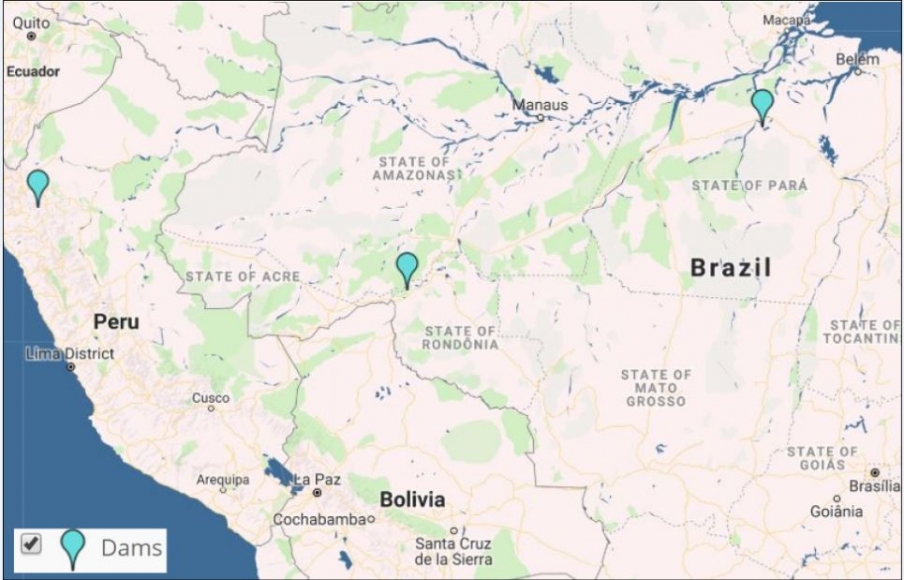
Although there is a large portfolio of potential new hydroelectric dam projects in the Peruvian Amazon,12 many of not advanced to implementation phase. Thus, forest loss due to hydroelectric dams is not currently a major issue, but this could quickly change in the future if these projects are revived. For example, in adjacent western Brazil, we documented the forest loss of 89,205 acres associated with the flooding caused by two dams on the upper Madeira River (MAAP #34).

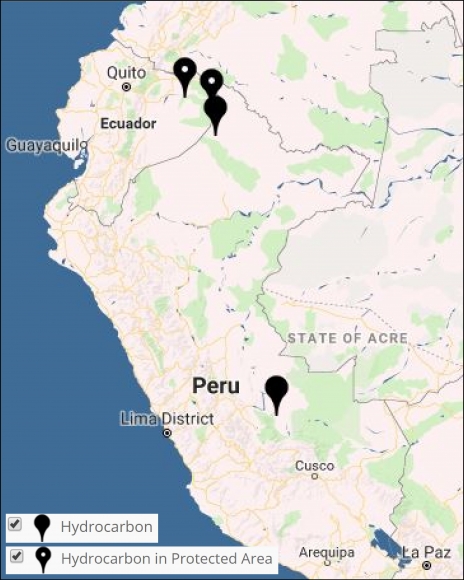
Hydrocarbon (Oil & Gas)

During the course of our monitoring, we have not yet detected major deforestation events linked to hydrocarbon-related activities. As with dams, this could change in the future if oil and gas prices rise and numerous projects in remote corners of the Amazon move forward.

Methodology

MAAP methodology has 4 major components:

  1. Forest Loss Detection. MAAP reports rely heavily on early-warning tree cover loss alerts to help us identify where new deforestation is happening. Currently, our primary tool is GLAD alerts, which are developed by the University of Maryland and Google,13 and presented by WRI’s Global Forest Watch and Peru’s GeoBosques. These alerts, launched in Peru in early 2016, are based on 30-meter resolution Landsat satellite images and updated weekly. We also occasionally incorporate CLASlite, forest loss detection software based on Landsat (and now Sentinel-2) developed by the Carnegie Institution for Science, and the moderate resolution (250 meters) Terra-i alerts. We are also experimenting with Sentinel-1 radar data (freely available from the European Space Agency), which has the advantage of piercing through cloud cover in order to continue monitoring despite persistent cloudy conditions
  2. Prioritize Big Data. The early warning systems noted above yield thousands of alerts, thus a procedure to prioritize the raw data is needed. We employ numerous prioritization methods, such as creation of hotspot maps (see below), focus on key areas (such as protected areas, indigenous territories, and forestry concessions), and identification of striking patterns (such as linear features or large-scale clearings).
  1. Identify Deforestation Drivers. Once priority areas are identified, the next challenge is to understand the cause of the forest loss. Indeed, one of the major advances of MAAP over the past year has been using high-resolution satellite imagery to identify key deforestation drivers. Our ability to identify these deforestation drivers has been greatly enhanced thanks to access to high-resolution satellite imagery provided by Planet 14
    (via their Ambassador Program) and Digital Globe (via the NextView Program, courtesy of an agreement with USAID). We also occasionally purchase imagery from Airbus(viaApollo Mapping).
  2. Publish User-Friendly Reports. The final step is to publish technical, but accessible, articles highlighting novel and important findings on the MAAP web portal. These articles feature concise text and easy-to-understand graphics aimed at a wide audience, including policy makers, civil society, researchers, students, journalists, and the public at large. During preparation of these articles, we consult with Peruvian civil society and relevant government agencies in order to improve the quality of the information.

Endnotes

MINAM-Peru (2016) Estrategia Nacional sobre Bosques y Cambio Climático.

Methodology: Kernel Density tool from Spatial Analyst Tool Box of ArcGis. The 2016 data is based on GLAD alerts, while the 2012-15 data is based on official annual forest loss data

Ravikumar et al (2016) Is small-scale agriculture really the main driver of deforestation in the Peruvian Amazon? Moving beyond the prevailing narrative. Conserv. Lett. doi:10.1111/conl.12264

4 Gutiérrez-Vélez VH et al (2011). High-yield oil palm expansion spares land at the expense of forests in the Peruvian Amazon. Environ. Res. Lett., 6, 044029.

Environmental Investigation Agency EIA (2015) Deforestation by Definition.

NG J (2015) United Cacao replicates Southeast Asia’splantation model in Peru, says CEO Melka. The Edge Singapore, July 13, 2015.

Palmas del Shanusi & Palmas del Oriente; http://www.palmas.com.pe/palmas/el-grupo/empresas

Hill D (2015) Palm oil firms in Peru plan to clear 23,000 hectares of primary forest. The Guardian, March 7, 2015.

Asner GP, Llactayo W, Tupayachi R,  Ráez Luna E (2013) Elevated rates of gold mining in the Amazon revealed through high-resolution monitoring. PNAS 46: 18454. They reported 46,417 hectares confirmed and 3,268 hectares suspected (49,865 ha total).

10 Laurance et al (2014) A global strategy for road building. Nature 513:229; Barber et al (2014) Roads, deforestation, and the mitigating effect of protected areas in the Amazon.  Biol Cons 177:203.

11 UNODC/DEVIDA (2016) Perú – Monitoreo de Cultivos de Coca 2015.

12 Finer M, Jenkins CN (2012) Proliferation of Hydroelectric Dams in the Andean Amazon and Implications for Andes-Amazon Connectivity. PLoS ONE 7(4): e35126.

13 Hansen MC et al (2016) Humid tropical forest disturbance alerts using Landsat data. Environ Res Lett 11: 034008.

14 Planet Team (2017). Planet Application Program Interface: In Space for Life on Earth. San Francisco, CA. https://api.planet.com

Citation

Finer M, Novoa S (2017) Patterns and Drivers of Deforestation in the Peruvian Amazon. MAAP: Synthesis #2.

MAAP #53: Wildfire Hotspots in the Peruvian Amazon in 2016

Imagen 53. VIIRS/NASA, SERNANP.

During 2016, Peru experienced an intense wildfire season, exacerbated by widespread drought conditions across the country.

The base map (Image 53, to the left) shows the 2016 fire alert hotspots.

These alerts are generated from a moderate-resolution (375 meters) satellite sensor (VIIRS) that detects significant new heat sources.

Although there has not yet been a comprehensive evaluation of the causes of these fires, evidence indicates that many are linked to agricultural practices that allow fires to escape to surrounding natural habitats.

In the image, we highlight 5 significant fire hotspots in the Amazon basin, labeled A-E (A. Northern Peru; B. Lower Huallaga; C. Huánuco/Ucayali, D. Ene River, E. Southern Manu, F. Interoceanic Highway).

These areas are described in more detail below.


A. Northern Peru

Image 53a. Data: VIIRS/NASA, SERNANP, MODIS

Hotspot A indicates the area in northern Peru that experienced a wave of intense fires in late 2016. Most of the fires occurred in the headwaters of the Amazon, in the Cajamarca and Lambayeque regions.

As previously reported, we estimate that 6,594 acres were burned within 11 Protected Areas (see MAAP #51 and MAAP #52).

Image 53a shows where the concentrations of heat sources were recorded.

B. Lower Huallaga

Hotspot B corresponds to the area along the lower Huallaga river basin, between the regions of Loreto and San Martín. Although most of the fires were in established agricultural areas, some impacted forest and secondary vegetation for the opening of new agricultural areas (Image 53b).

Image 53b. VIIRS/NASA, Planet

C. Huánuco/Ucayali

Hotspot C overlaps with one of the primary deforestation hotspots in the country. As previously reported, one of the primary drivers of deforestation in this area is cattle pasture (see MAAP #37). Therefore, there may be a relationship between the use of fire in agricultural activities and the high deforestation rates in this area.

D. Ene River

Hotspot D highlights an area that generated national and international attention in 2016, when fires along the Ene River threatened two national protected areas (Asháninka Communal Reserve and Otishi National Park) in the Junin region. Image 53d shows a comparison of before (left panel) and during (right panel) the fires. We did not document any fires entering the protected areas.

Image 53d. VIIRS/NASA, SERNANP, Planet

E. South of Manu

Hotspot E corresponds to an area of grassland, inter-Andean valley, and cloud forest in the buffer zone of Manu National Park and surrounding the Wayqecha Private Conservation Area. According to estimates of local officials, around 3,000 hectares burned.

Image 53e. VIIRS/NASA, SERNANP, Planet

F. Interoceanic Highway

Hotspot F indicates an area in southern Peru experiencing increasing deforestation along the Interoceanic Highway in the Madre de Dios region. We previously documented a correlation between the areas with high concentrations of fires and areas of elevated deforestation (see MAAP #47).

References

Planet Team (2017). Planet Application Program Interface: In Space for Life on Earth. San Francisco, CA. https://api.planet.com

Citation

Novoa S, Finer M, Samochuallpa E (2017) Wildfire Hotspots in Peruvian Amazon in 2016. MAAP: 53.