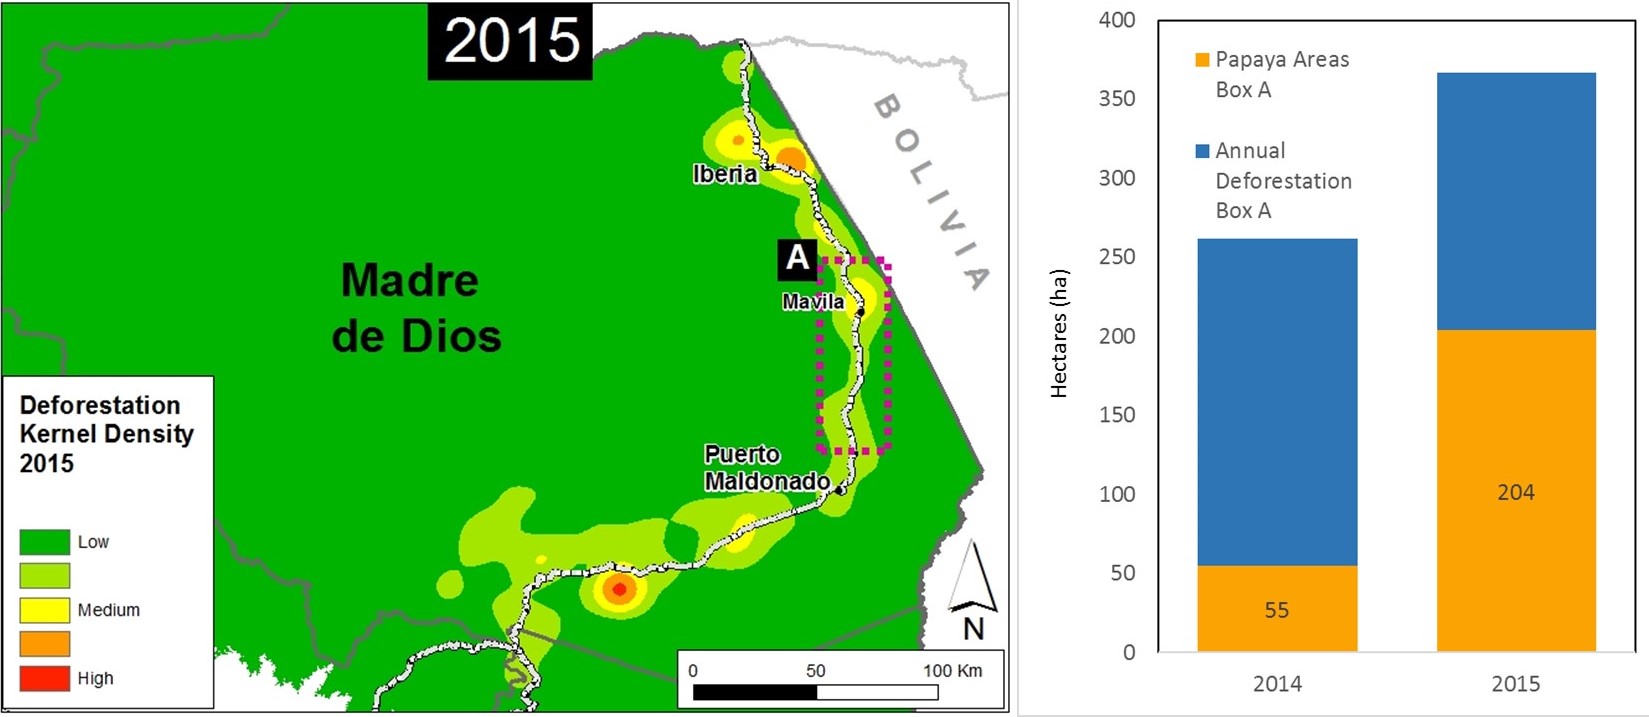
In the previous MAAP #26, we published a preliminary map of Deforestation Hotspots in the Peruvian Amazon for 2015. Subsequently in 2016, we have been compiling information to improve understanding on the potential causes (drivers) of deforestation in the identified hotspots. In this article, we focus on a medium-intensity hotspot located along the newly paved Interoceanic Highway in the eastern part of the Madre de Dios region (see Inset A in Image 42a).
The analysis in this article is based on field work carried out by the Peruvian Ministry of Environment, in collaboration with Terra-i. This team has verified the presence of papaya plantations in the area indicated by Inset A and shared their photos and coordinates with MAAP to allow us to search for and analyze relevant satellite imagery.
Synthesizing all of the available information, we found that the establishment of papaya plantations was an important deforestation driver in the area in 2015. Within the focal area (Inset A), we estimate the deforestation of 204 hectares (504 acres) for papaya plantations in 2015, a major increase relative to 2014 (see bar graph in Image 42a).
All of the papaya deforestation is small (< 5 hectares) or medium (5-50 hectares) scale. According to the analysis presented in MAAP #32, these two scales represented 99% of the deforestation events in Peru in 2015. Approximately 90% of the observed deforestation is within areas zoned for agricultural activity. Therefore, the legality of the deforestation in not known (i.e. if all the required permits were obtained).
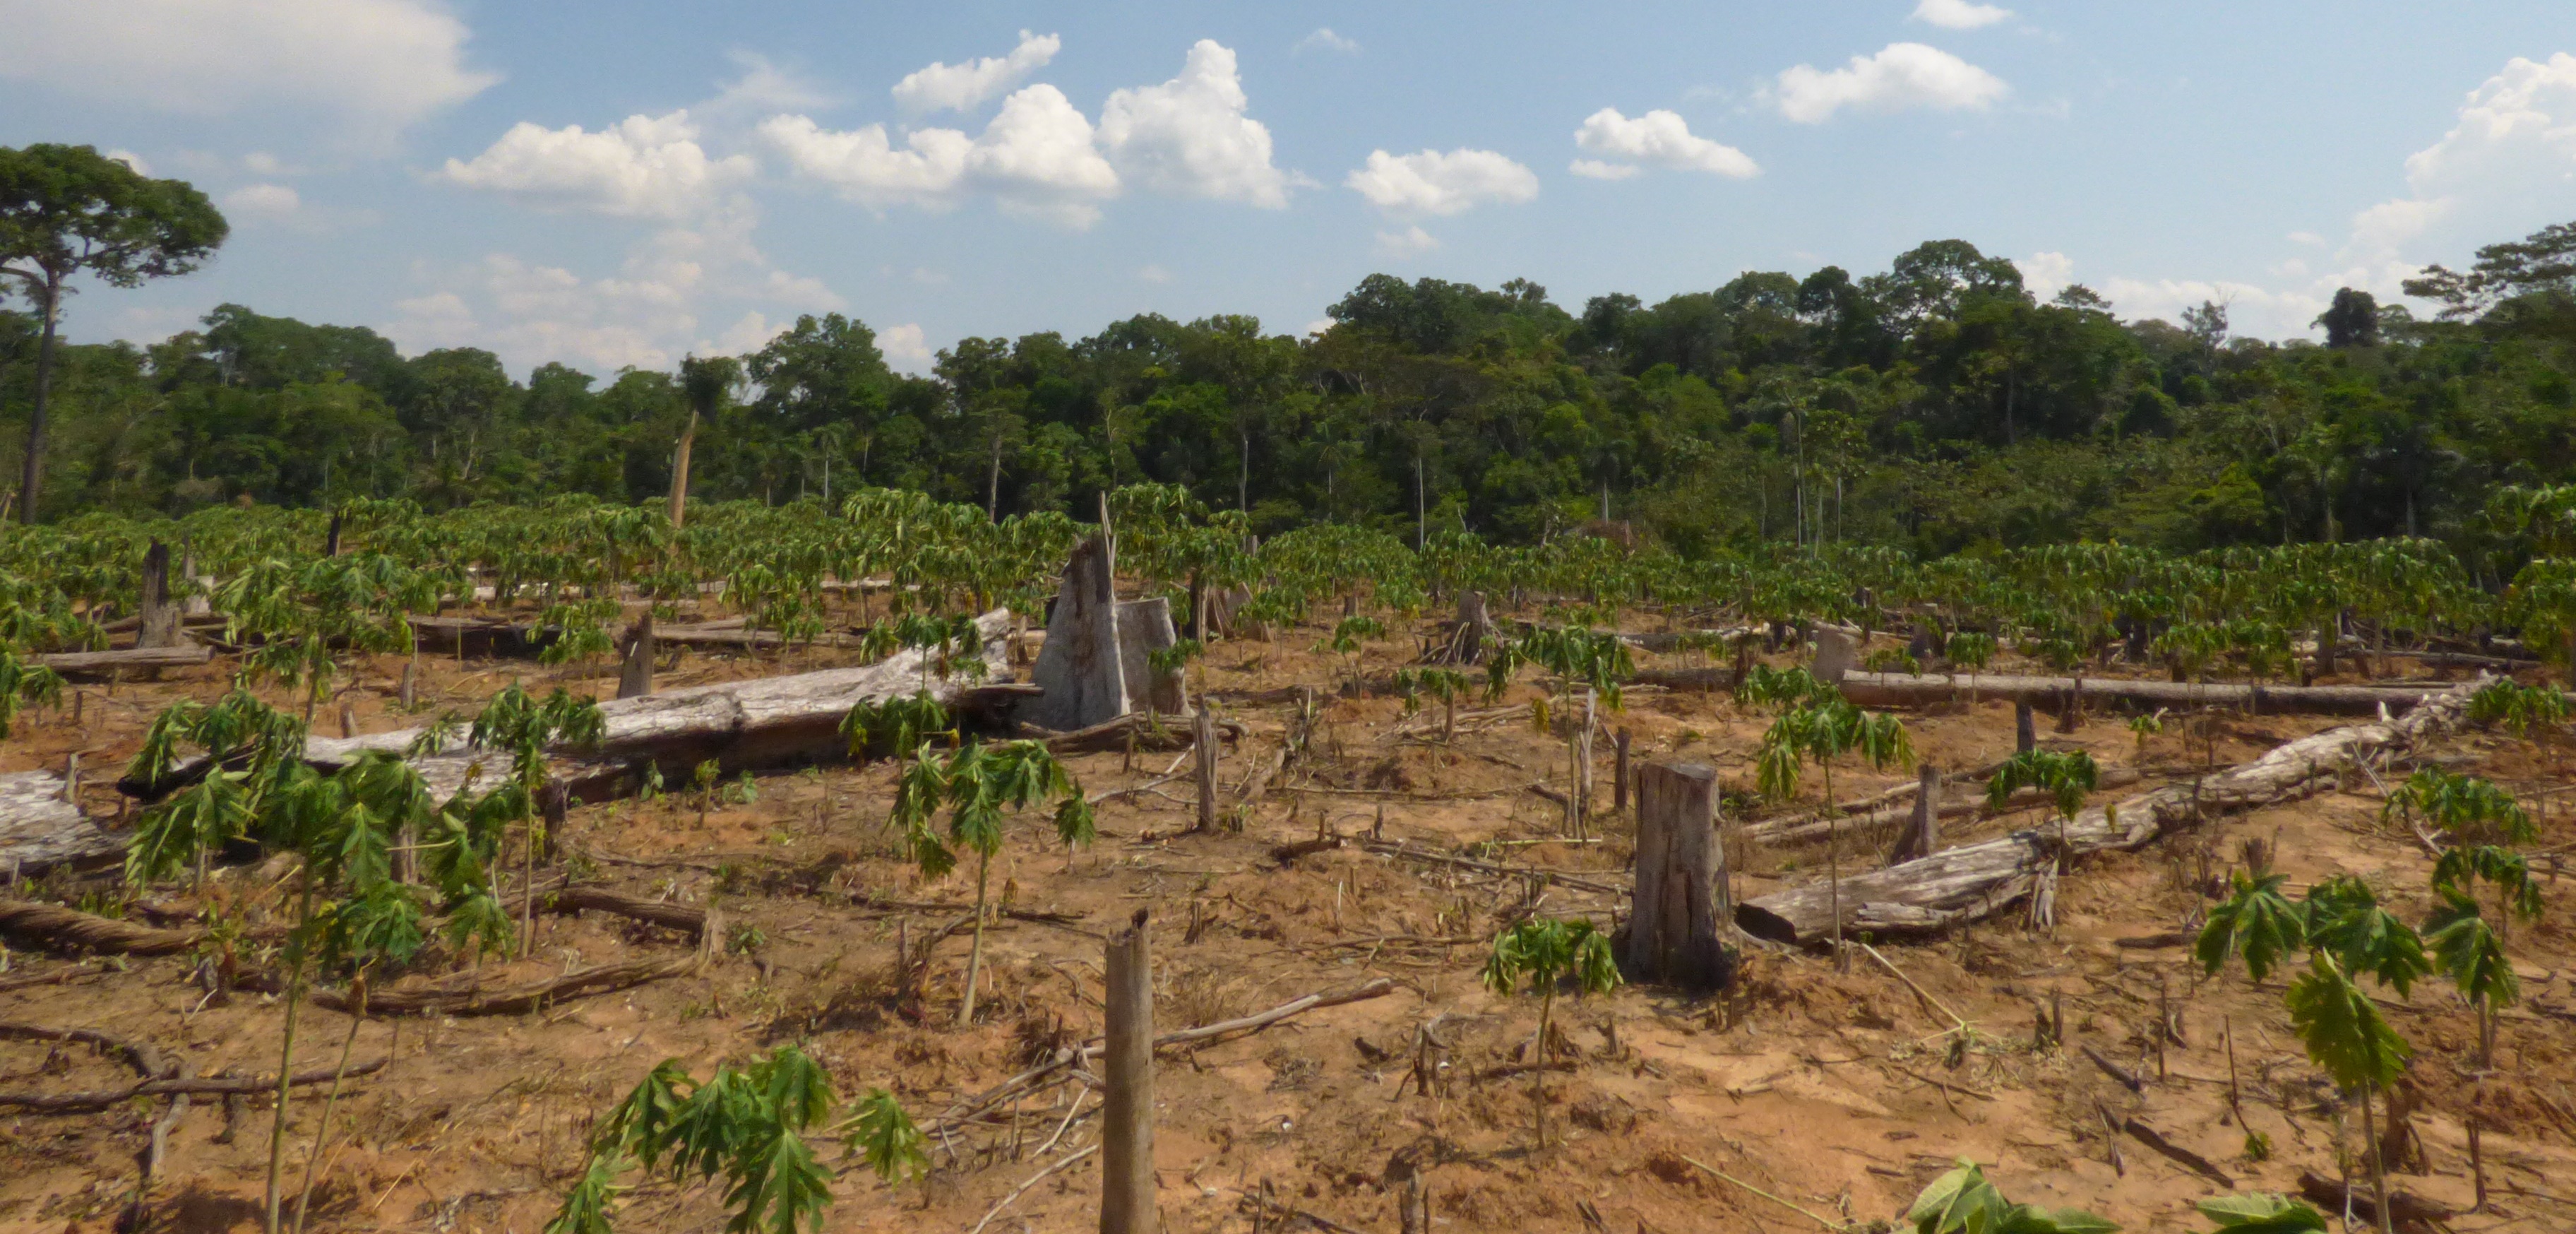
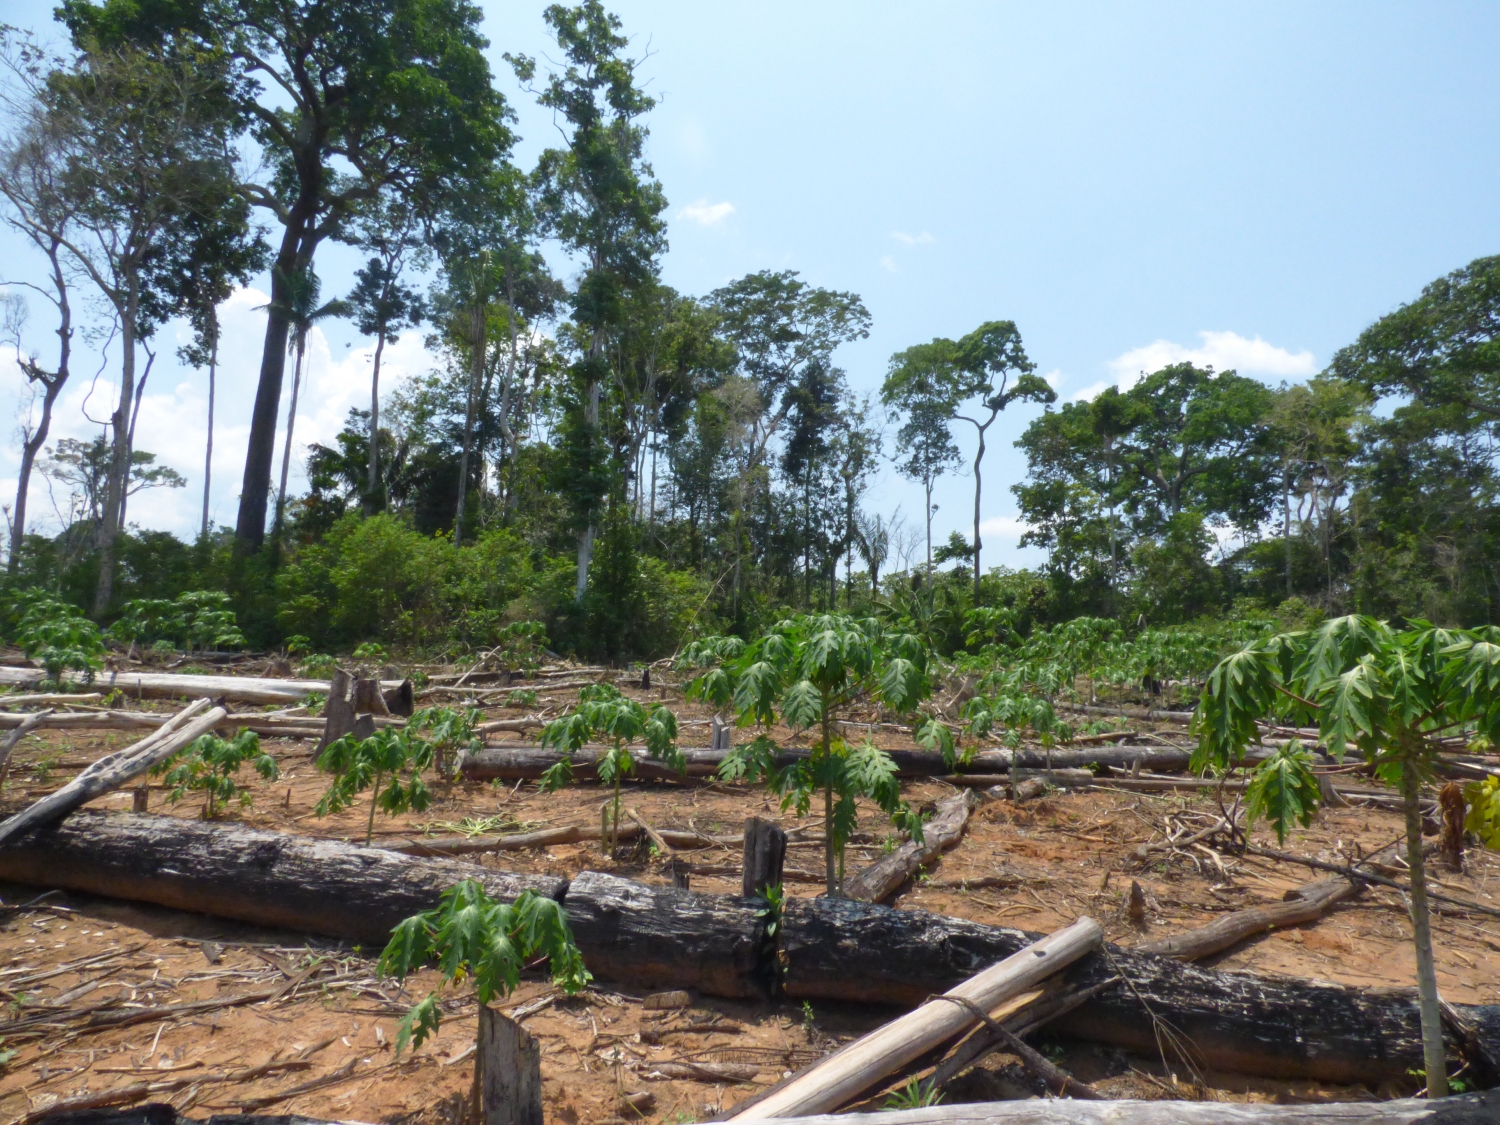
Below, we show satellite images and field photos of 5 examples of the recent deforestation caused by papaya cultivation.
Example #1
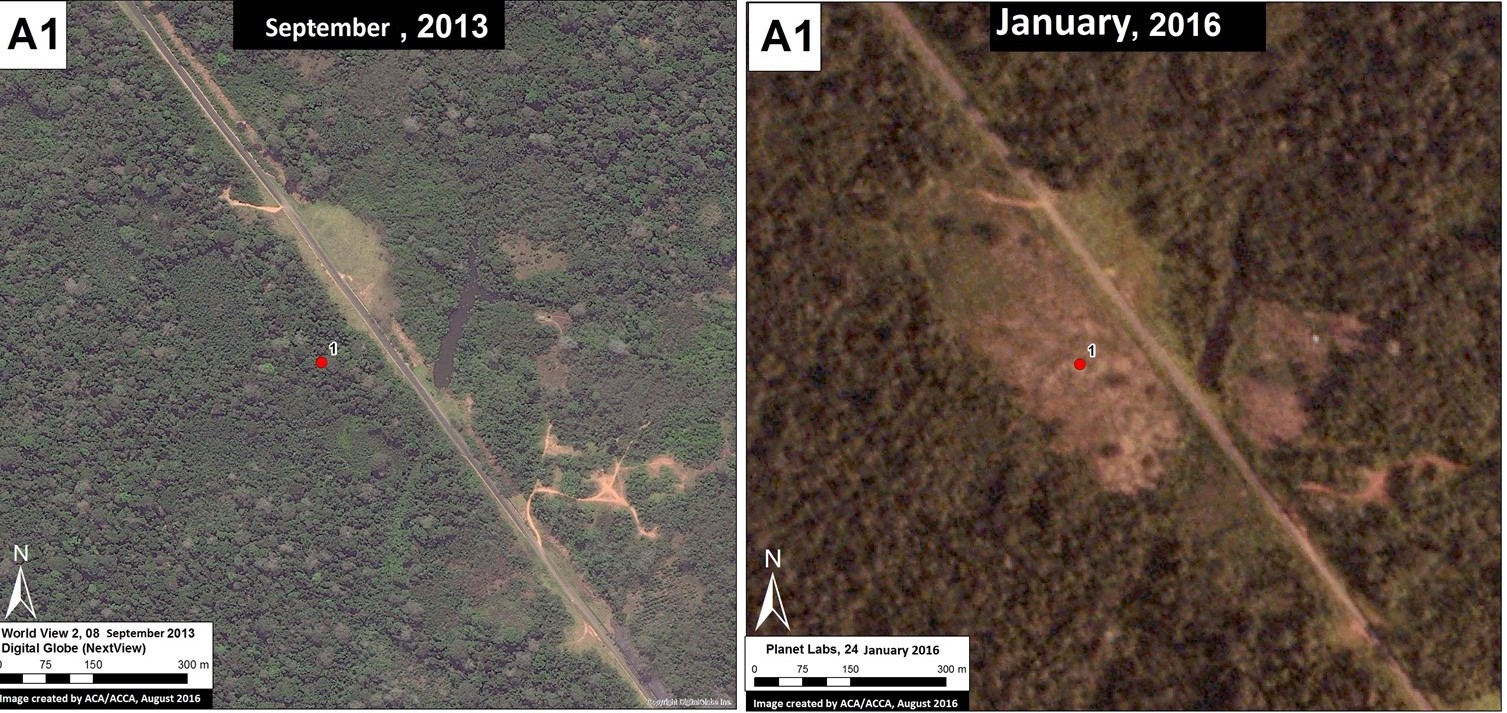
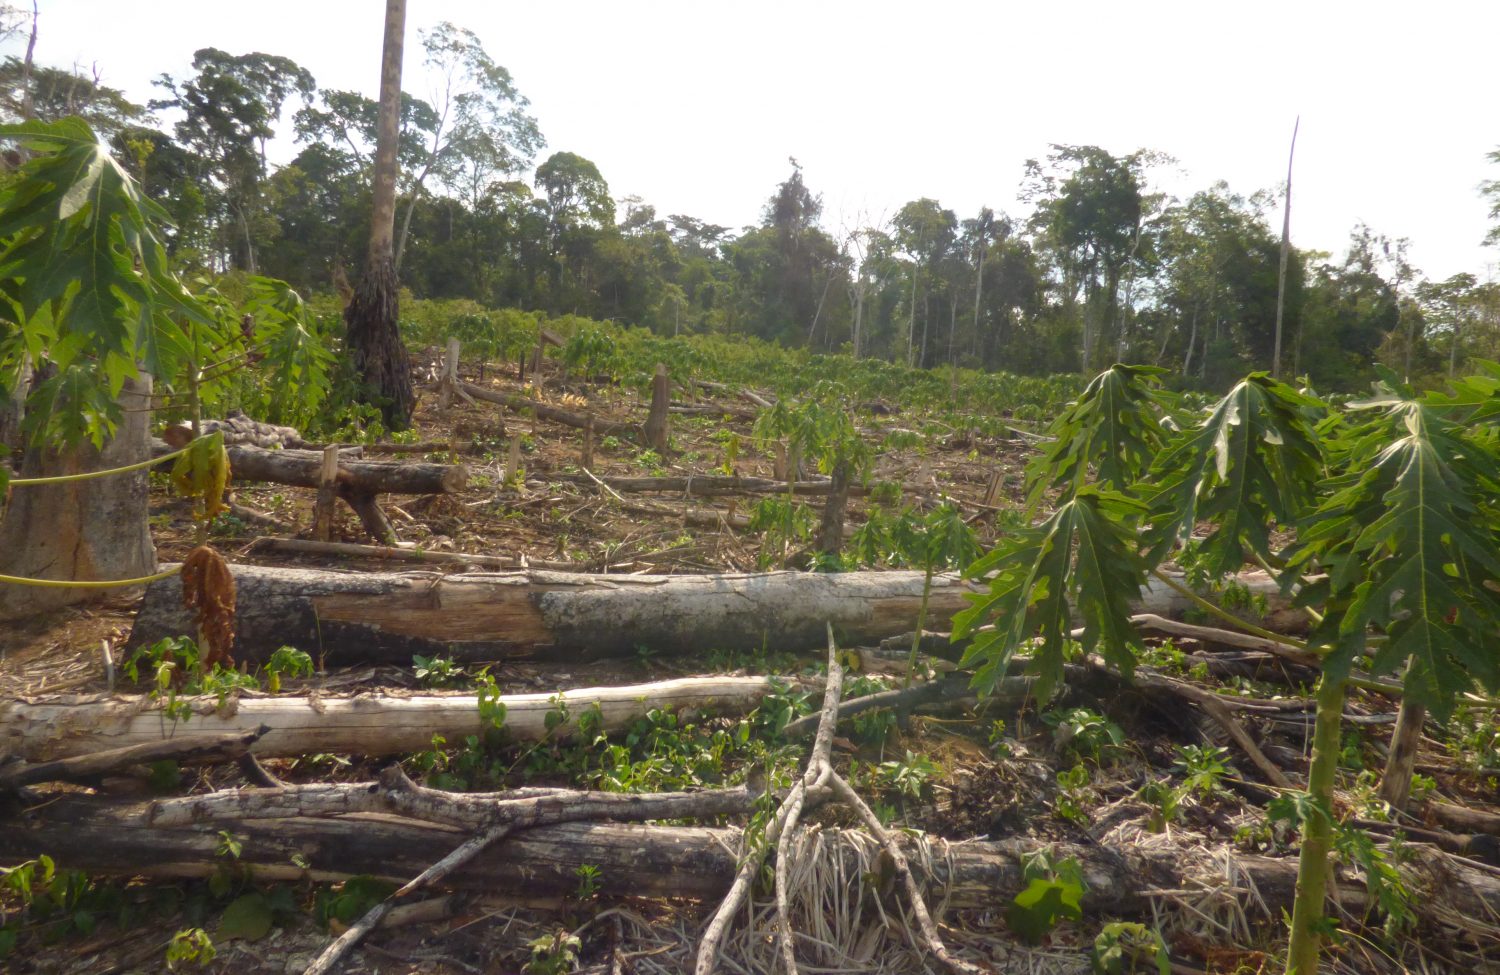
Image 42b shows the deforestation of 12 hectares between September 2013 (left panel) and January 2016 (right panel). The red point indicates the same place in both images. Image 42c is a photo of the new papaya plantation in this area.
Example #2
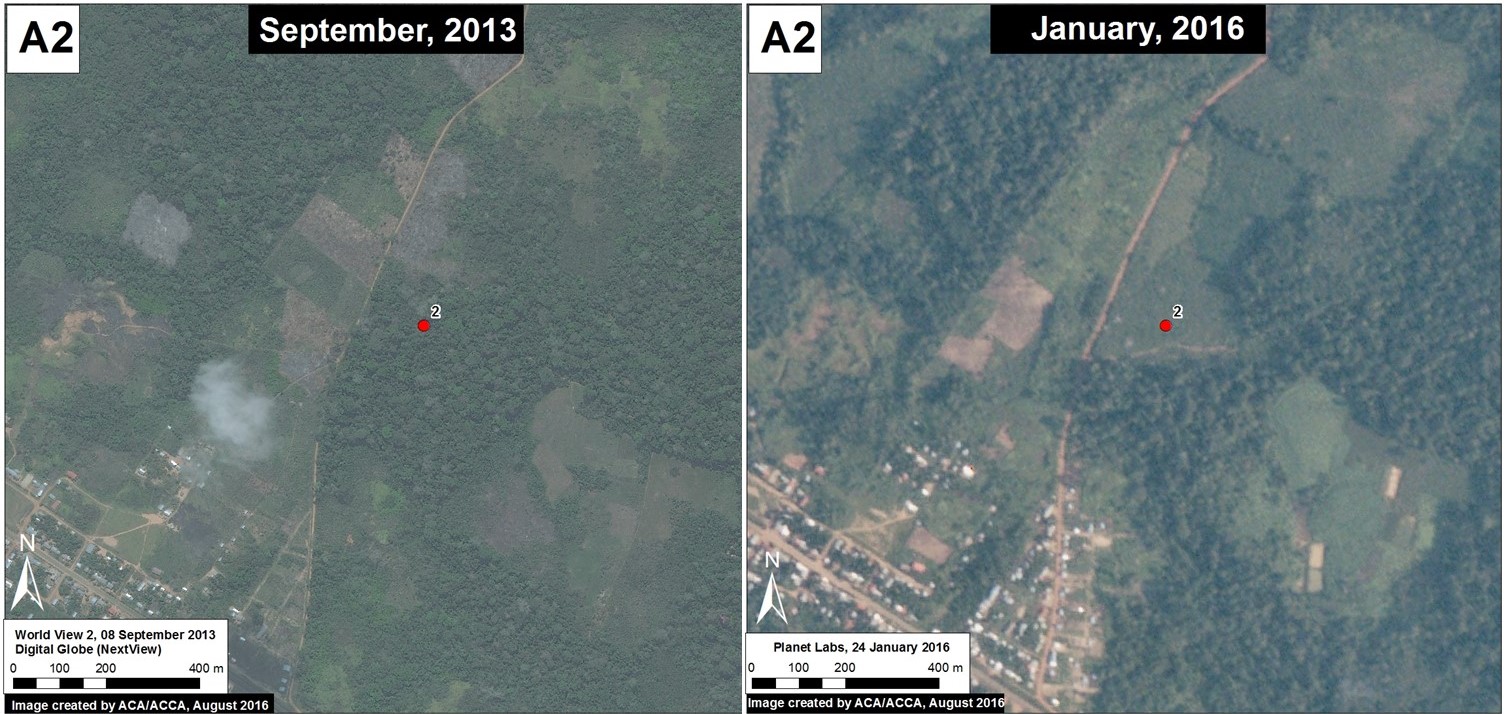
Image 42d shows the deforestation of 5 hectares between September 2013 (left panel) and January 2016 (right panel). The red point indicates the same place in both images. Image 42e is a photo of the new papaya plantation in this area.
Example #3
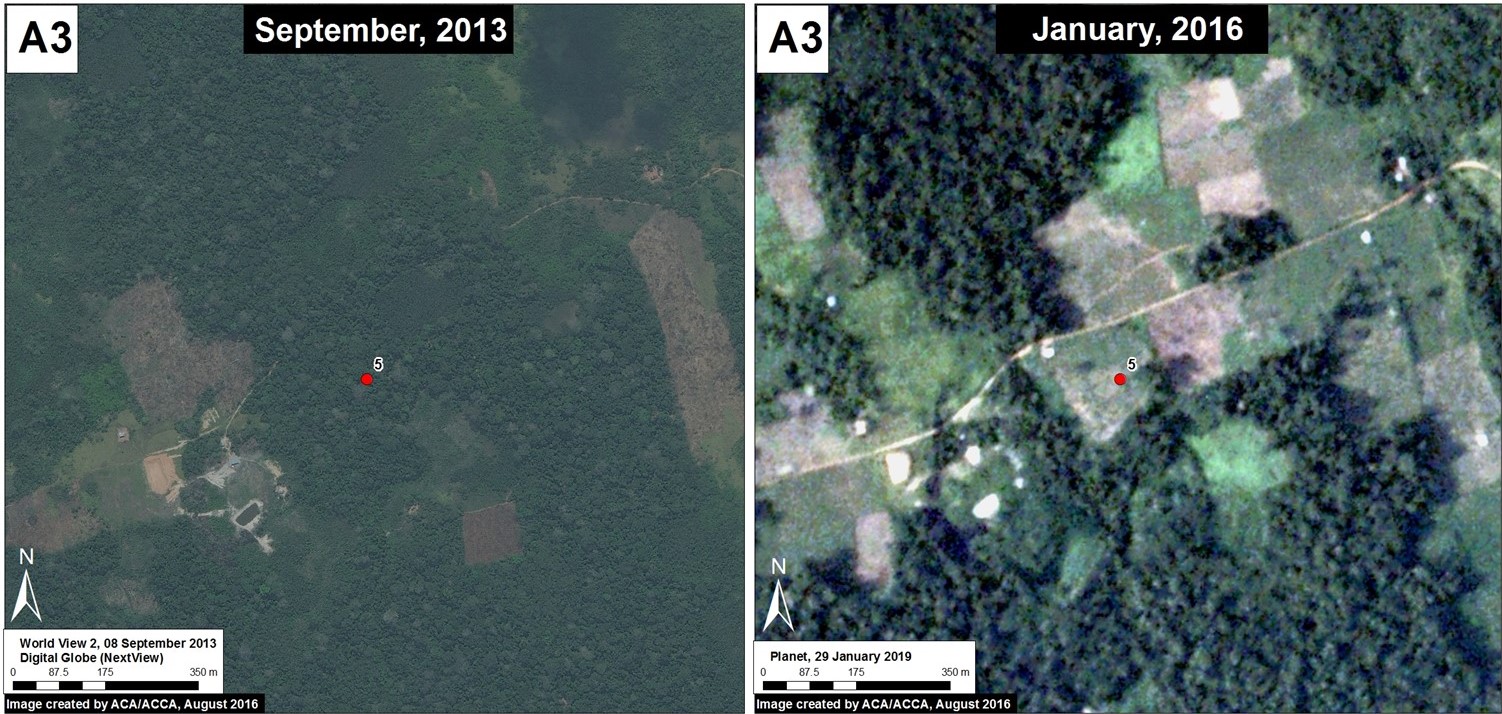
Image 42f shows the deforestation of 5 hectares between September 2013 (left panel) and January 2016 (right panel). The red point indicates the same place in both images. Image 42g is a photo of the new papaya plantation in this area.
Example #4
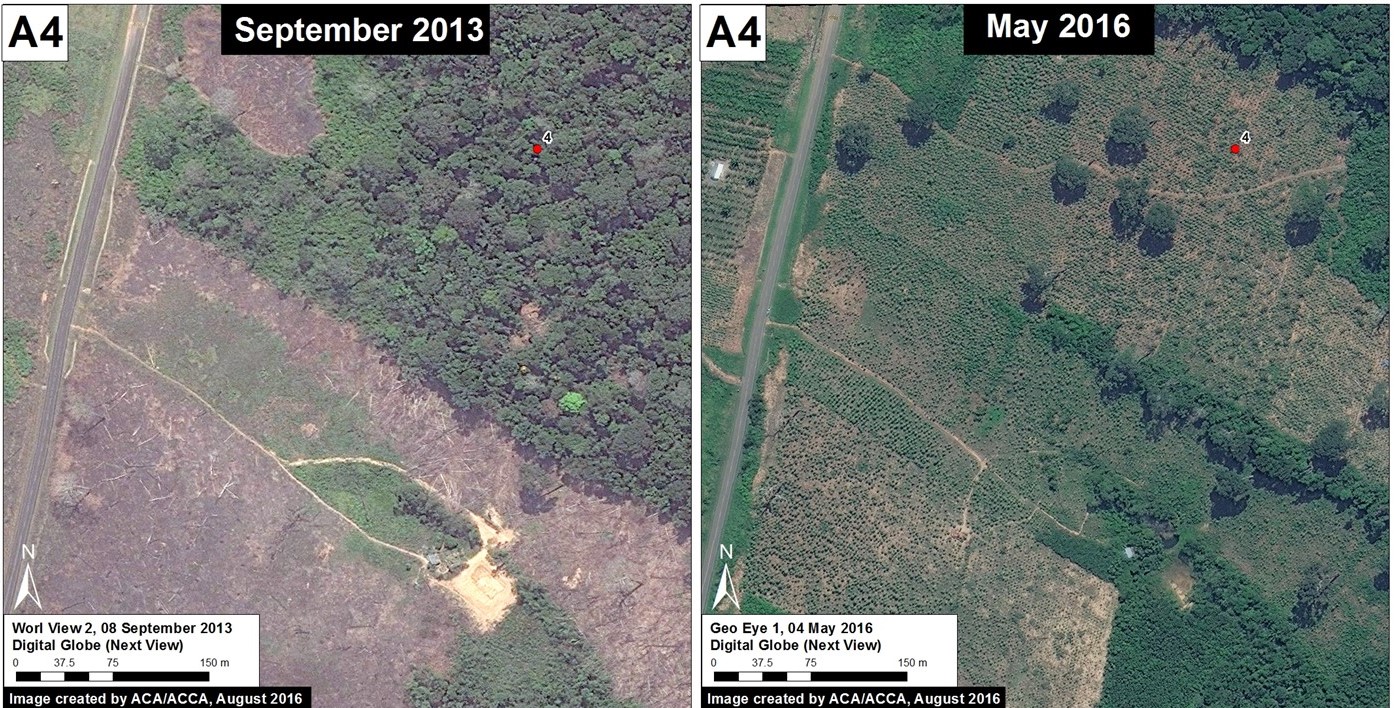
Image 42h shows the deforestation of 12 hectares between September 2013 (left panel) and May 2016 (right panel). The red point indicates the same place in both images. Image 42i is a photo of the new papaya plantation in this area.
Example #5
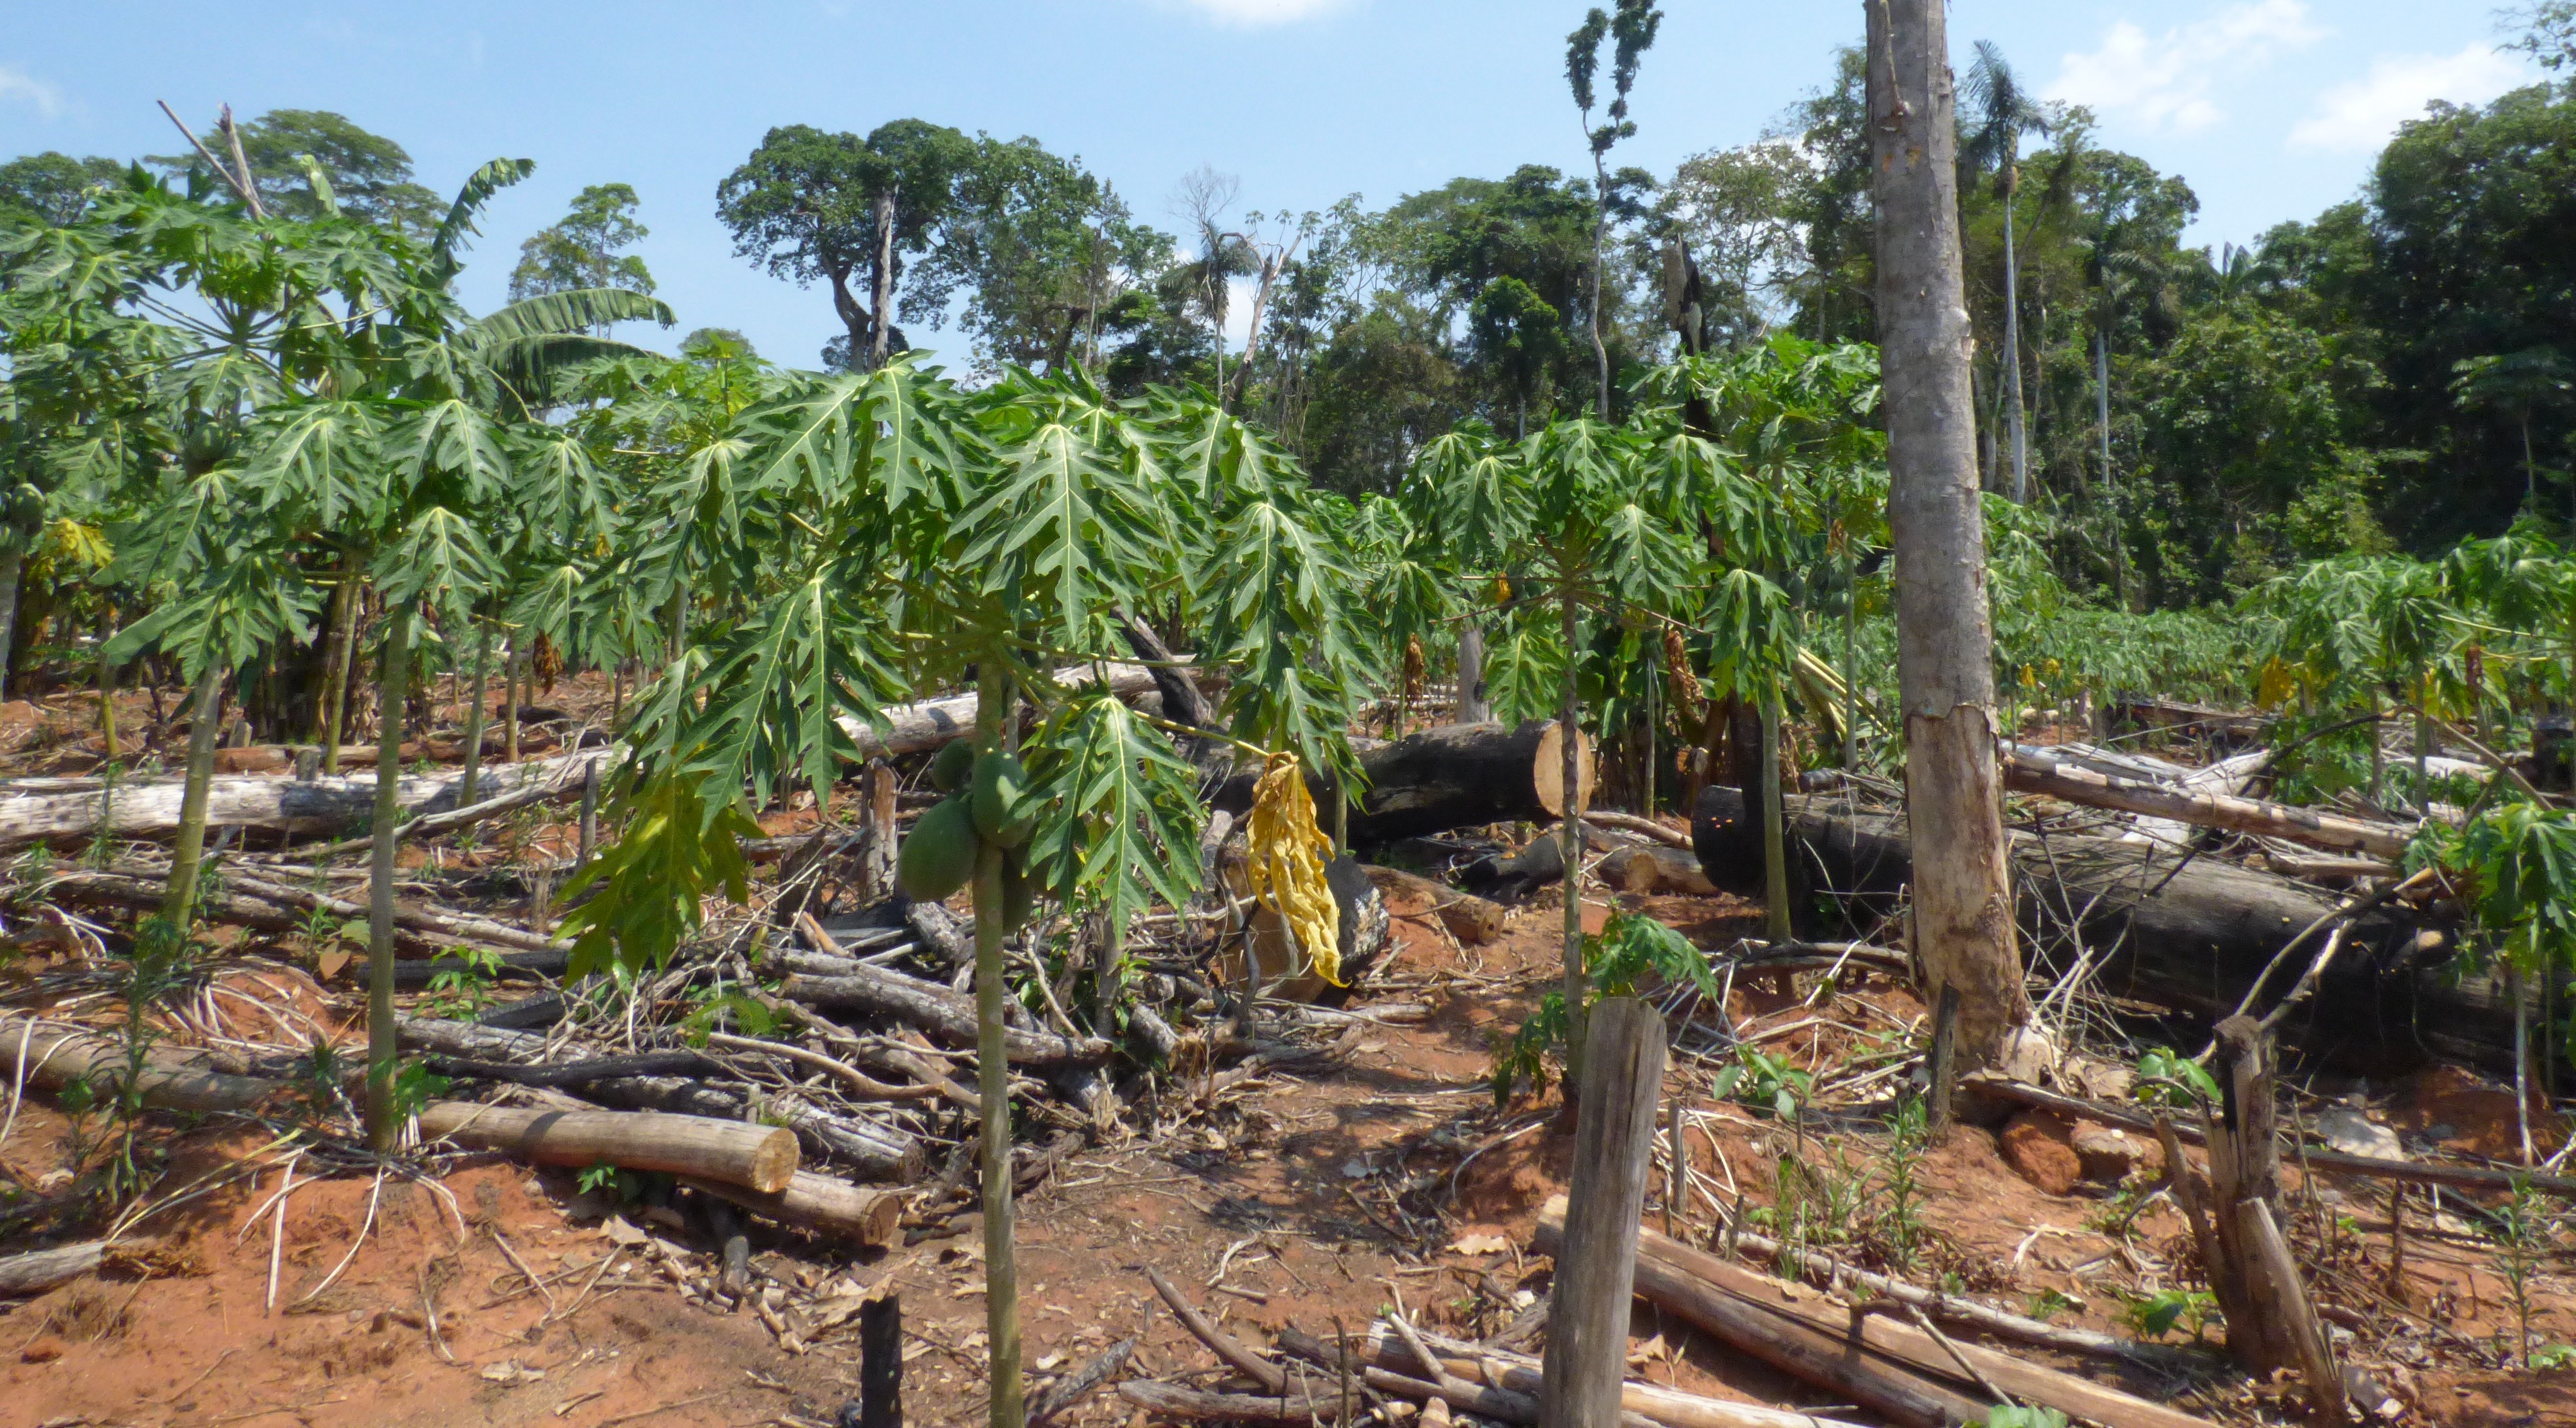
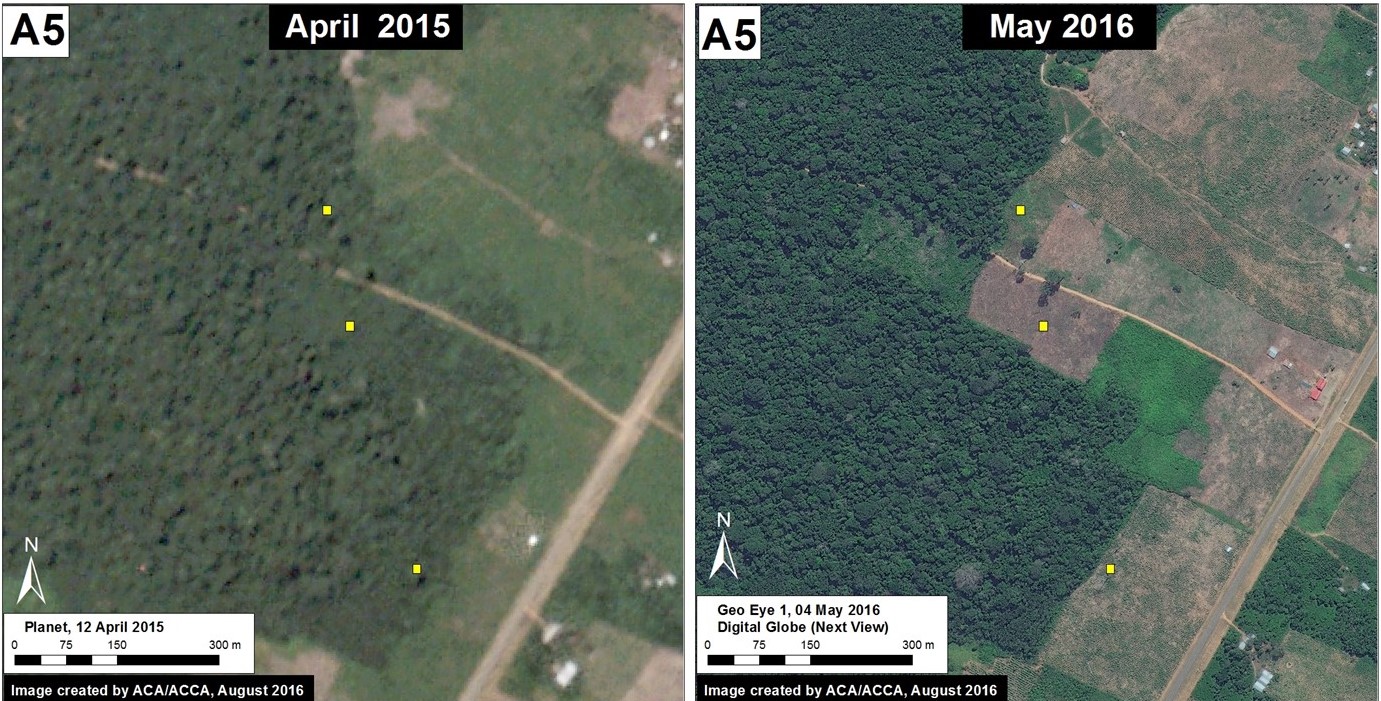
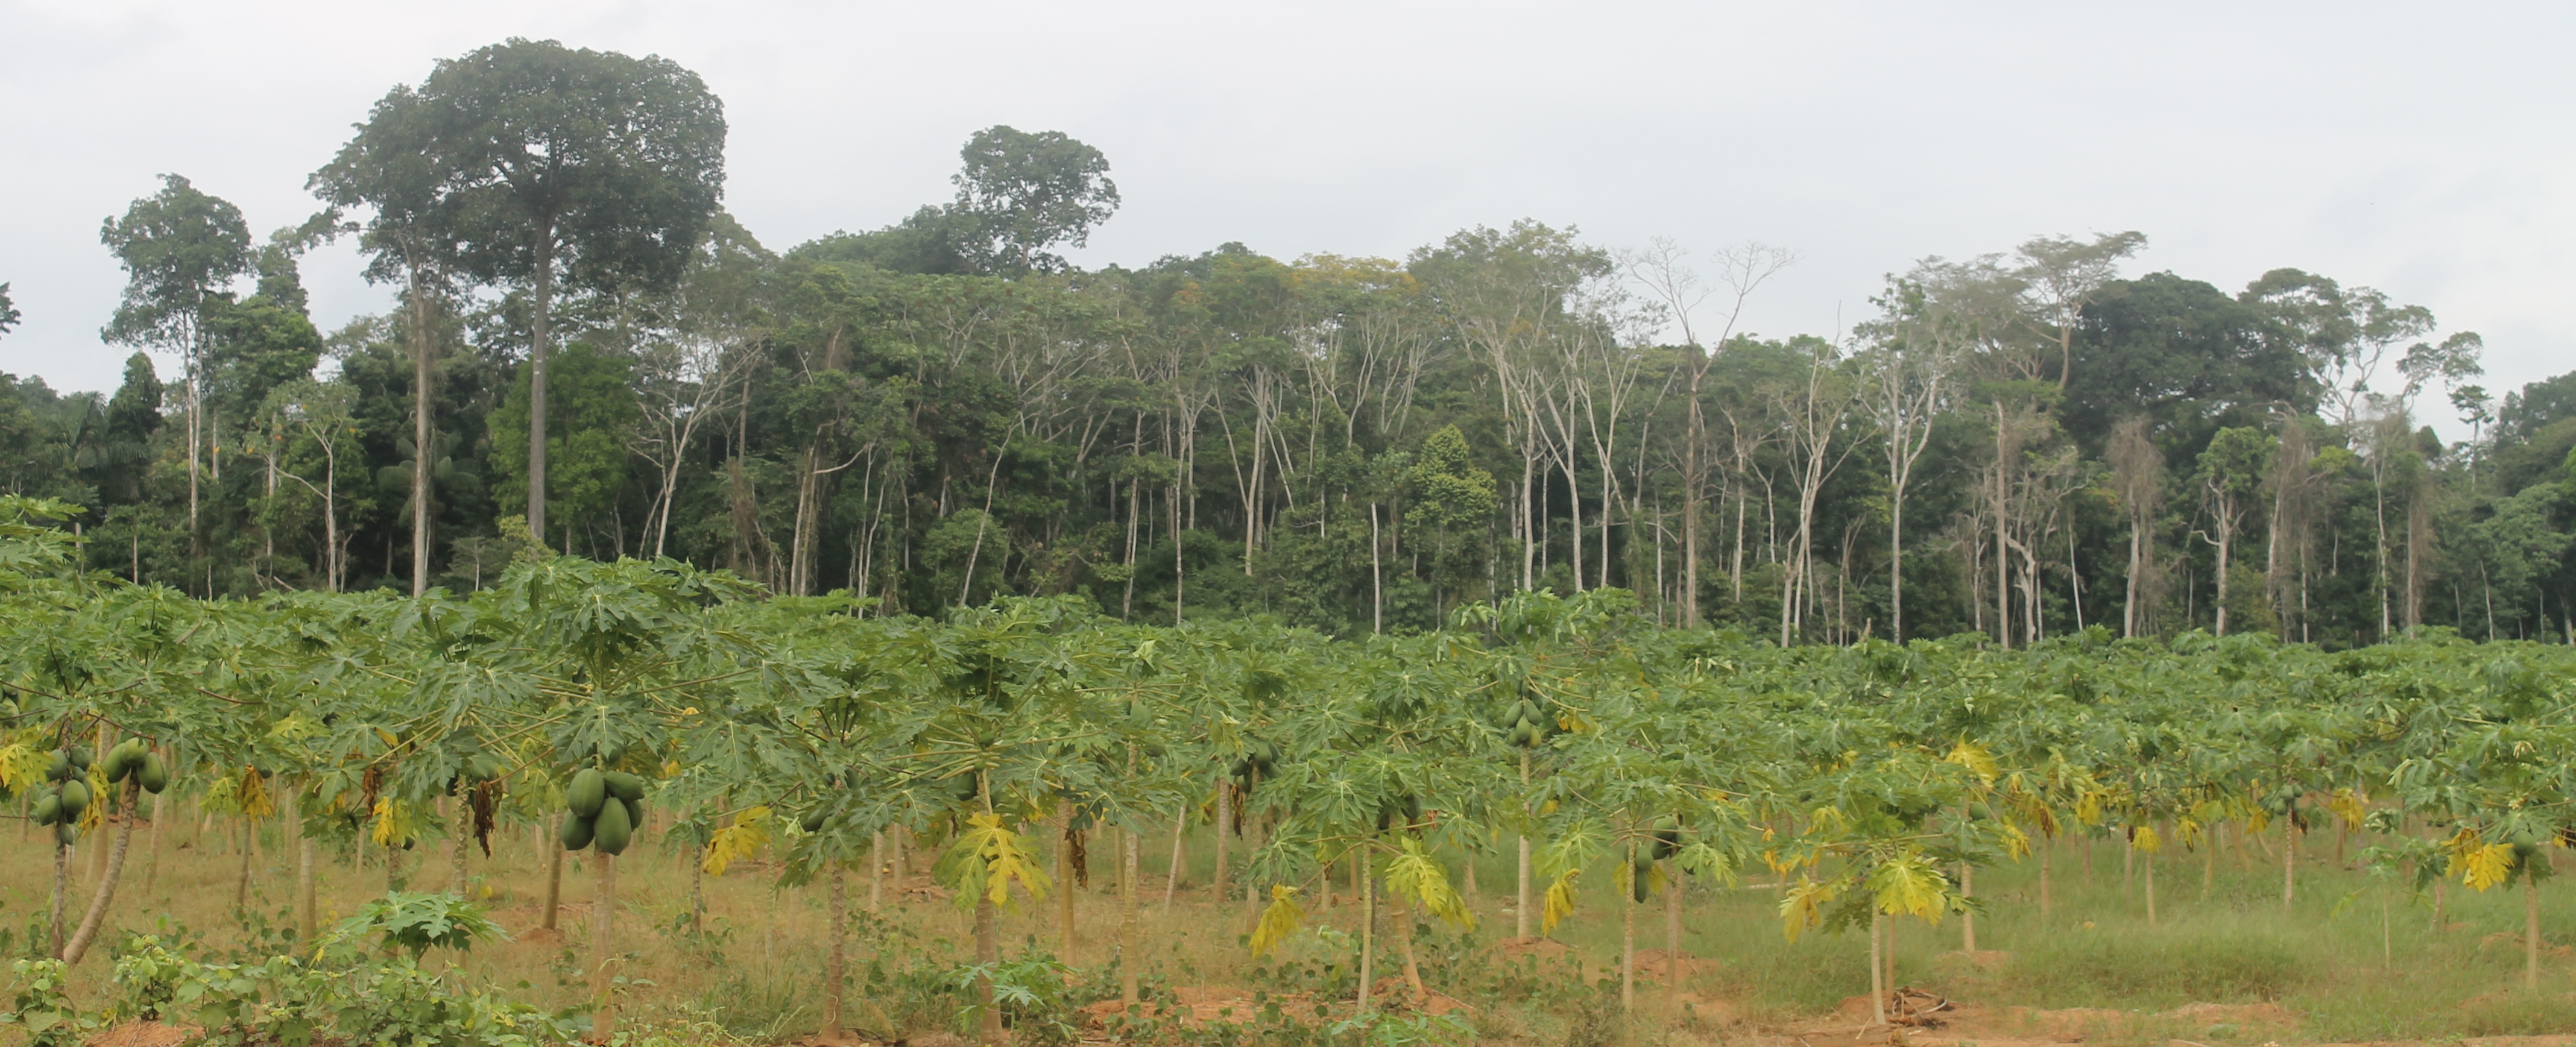
Image 42j shows the deforestation of 9 hectares between April 2015 (left panel) and May 2016 (right panel). The yellow boxes indicate the same place in both images. Image 42k is a photo of the new papaya plantation in this area.
Citation
Finer M, Novoa S, Carrasco F (2016) Papaya – Potential New Driver of Deforestation in Madre de Dios. MAAP: 42.
