In MAAP # 85, we showed how medium and high-resolution satellites (such as Landsat, Planet and Sentinel-1) could be used to monitor the construction of logging roads in near-real time.
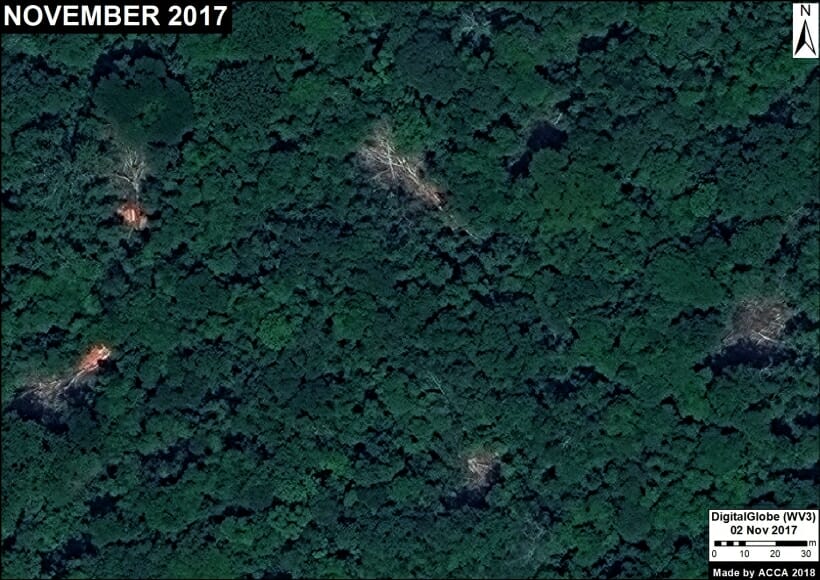
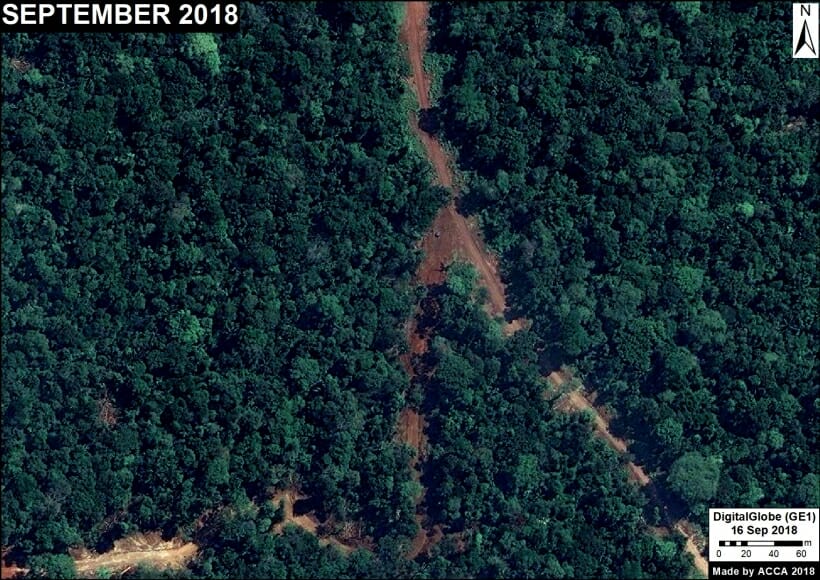
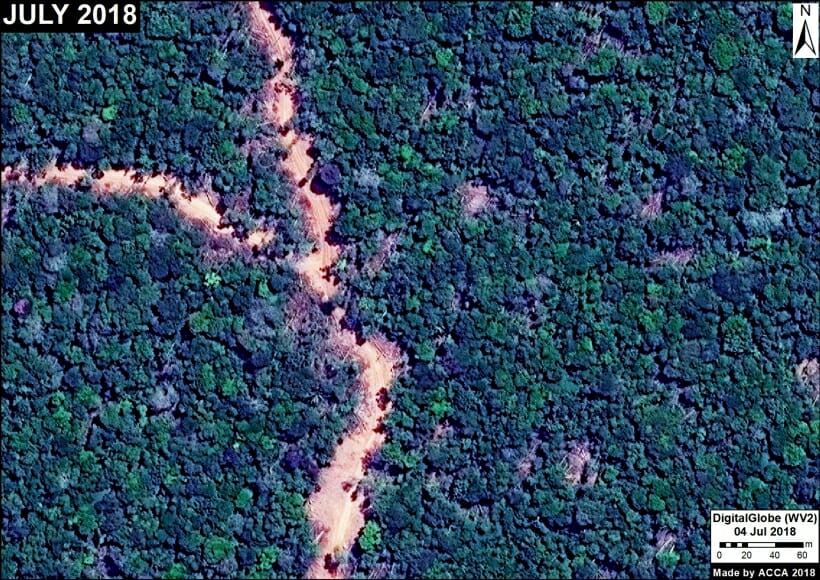
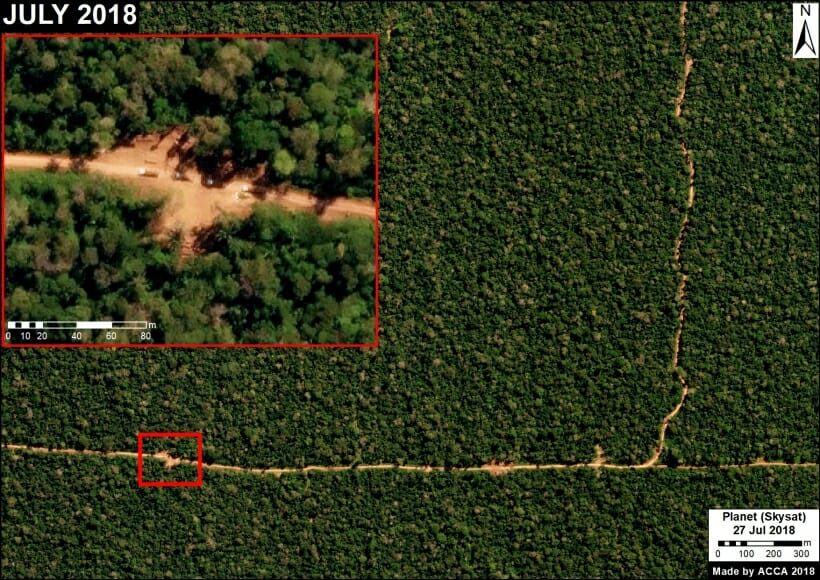
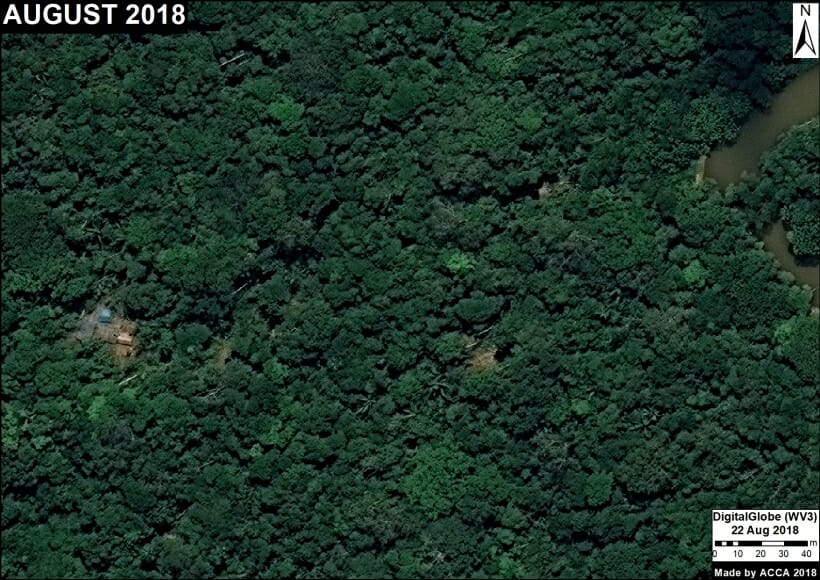
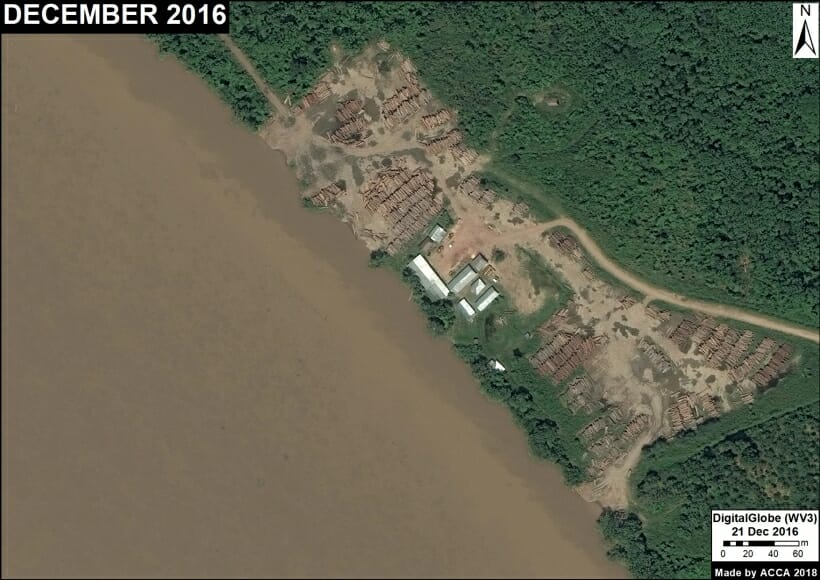
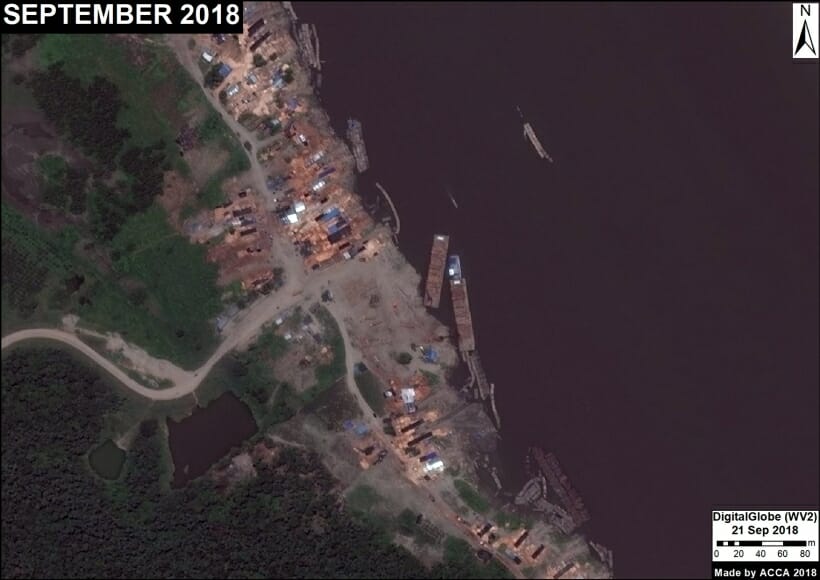
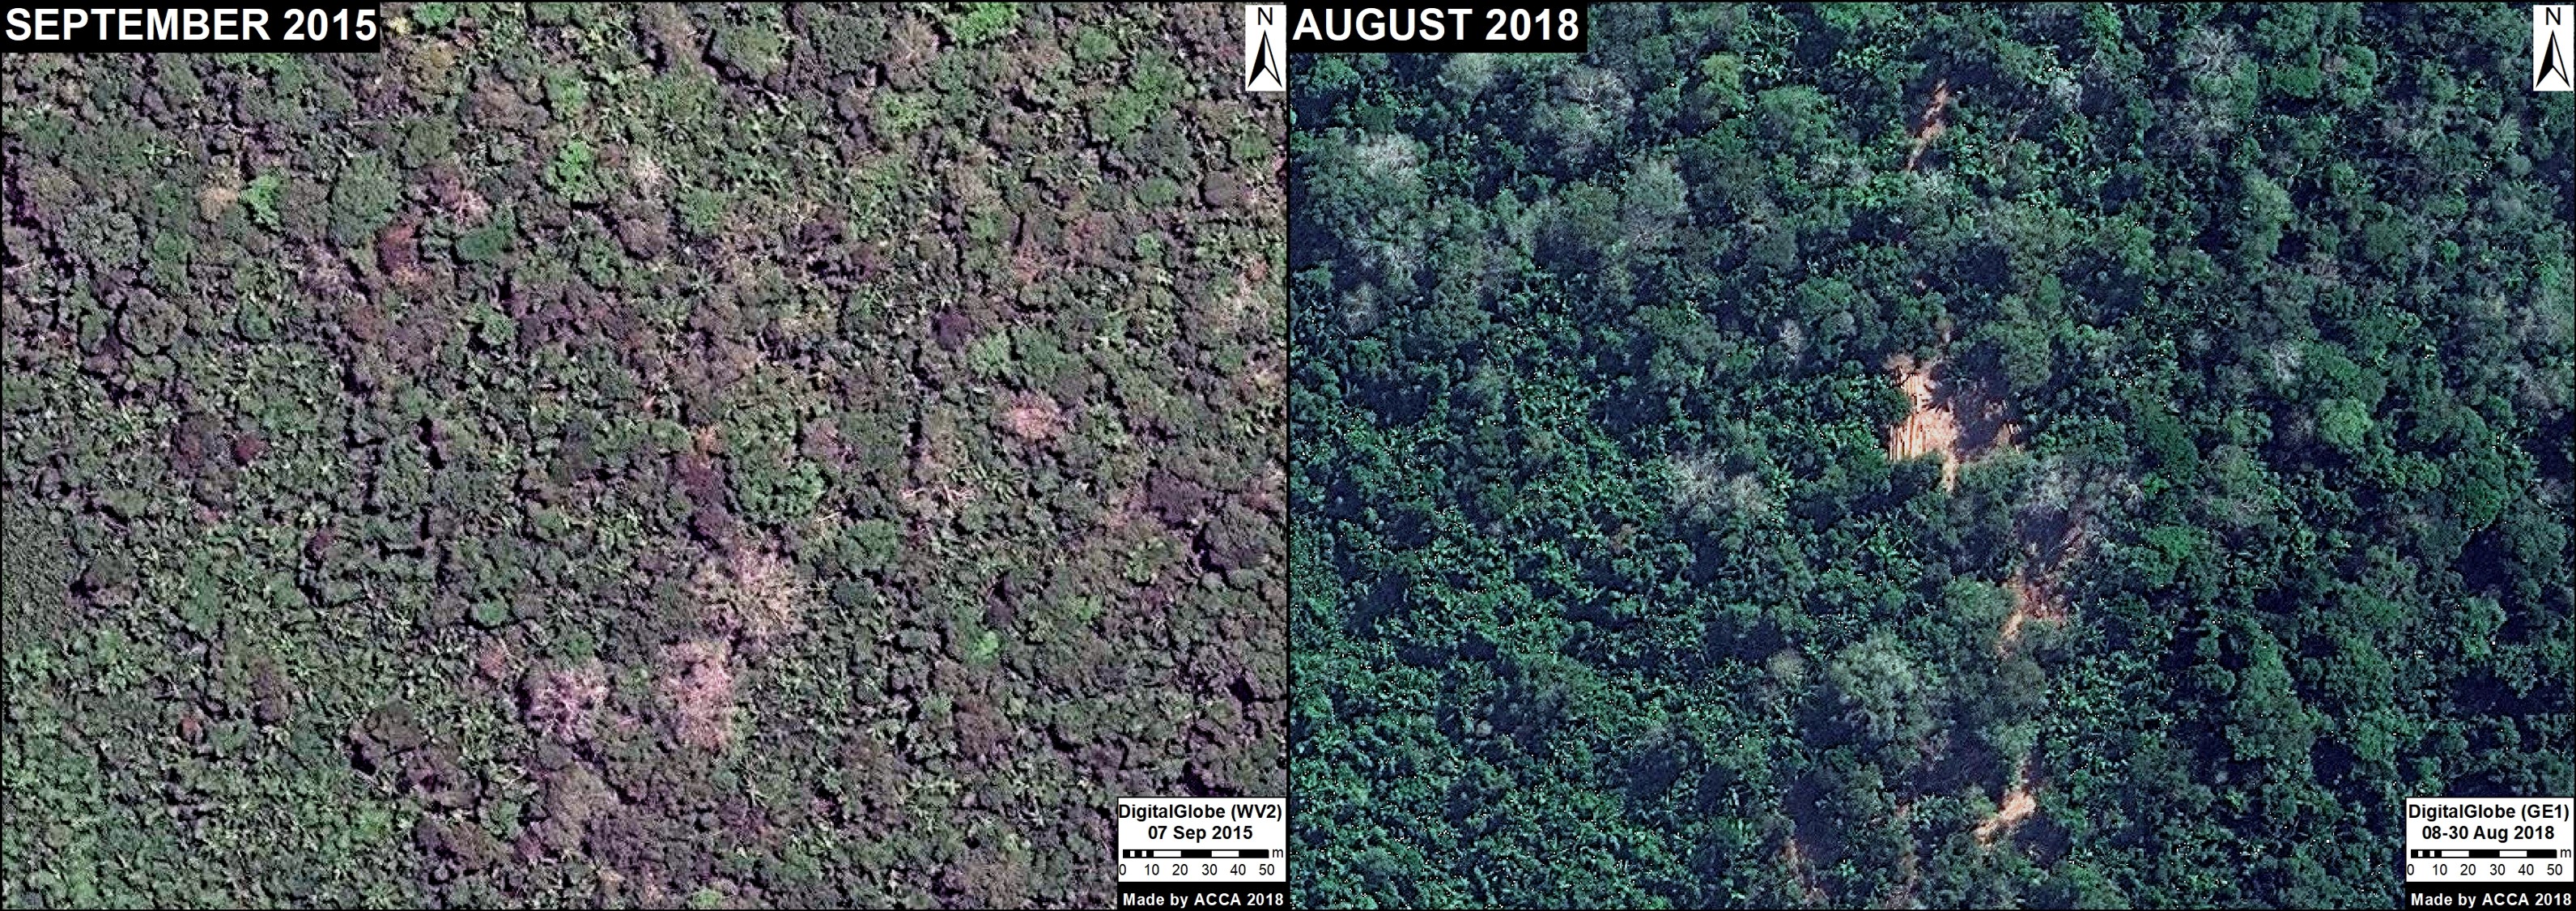
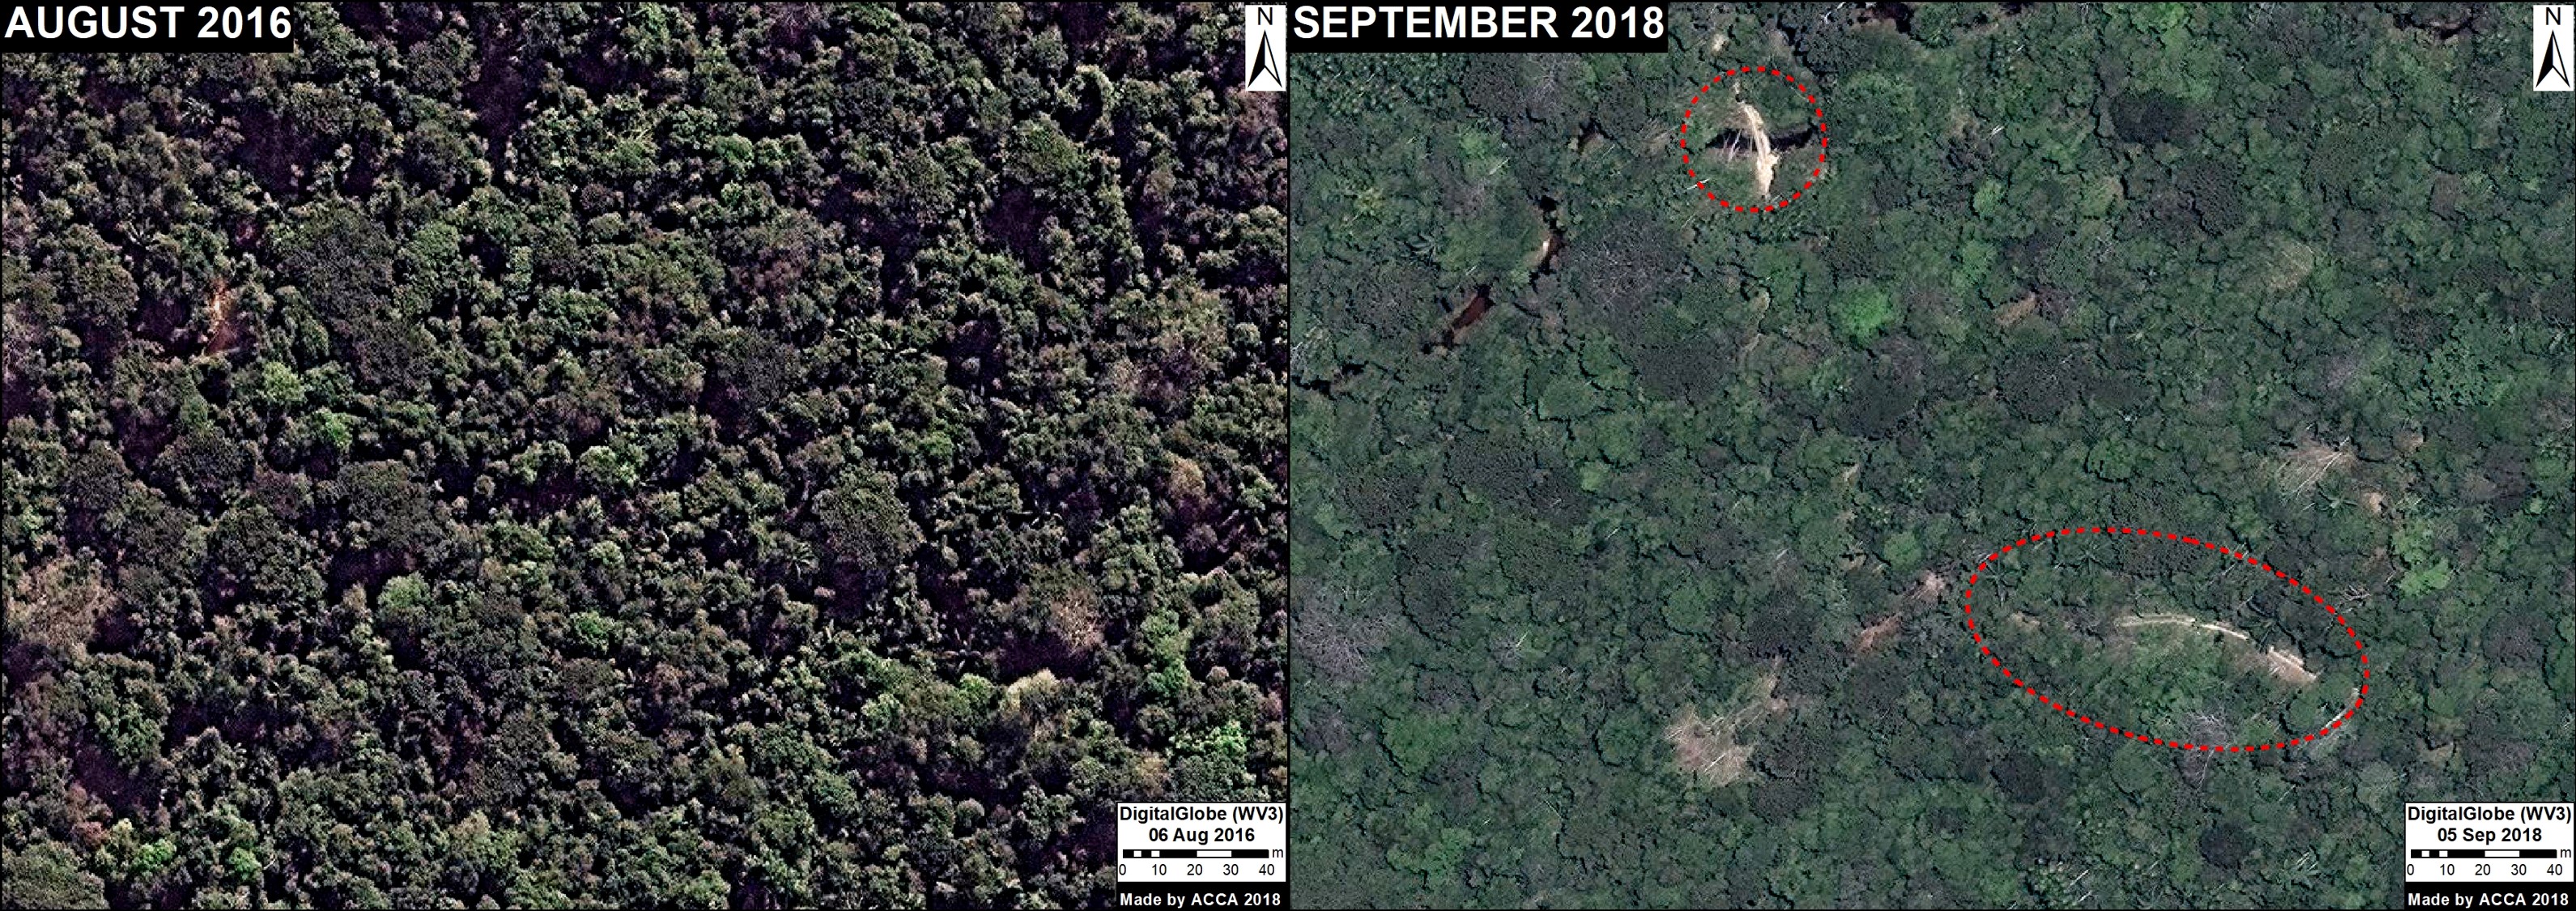
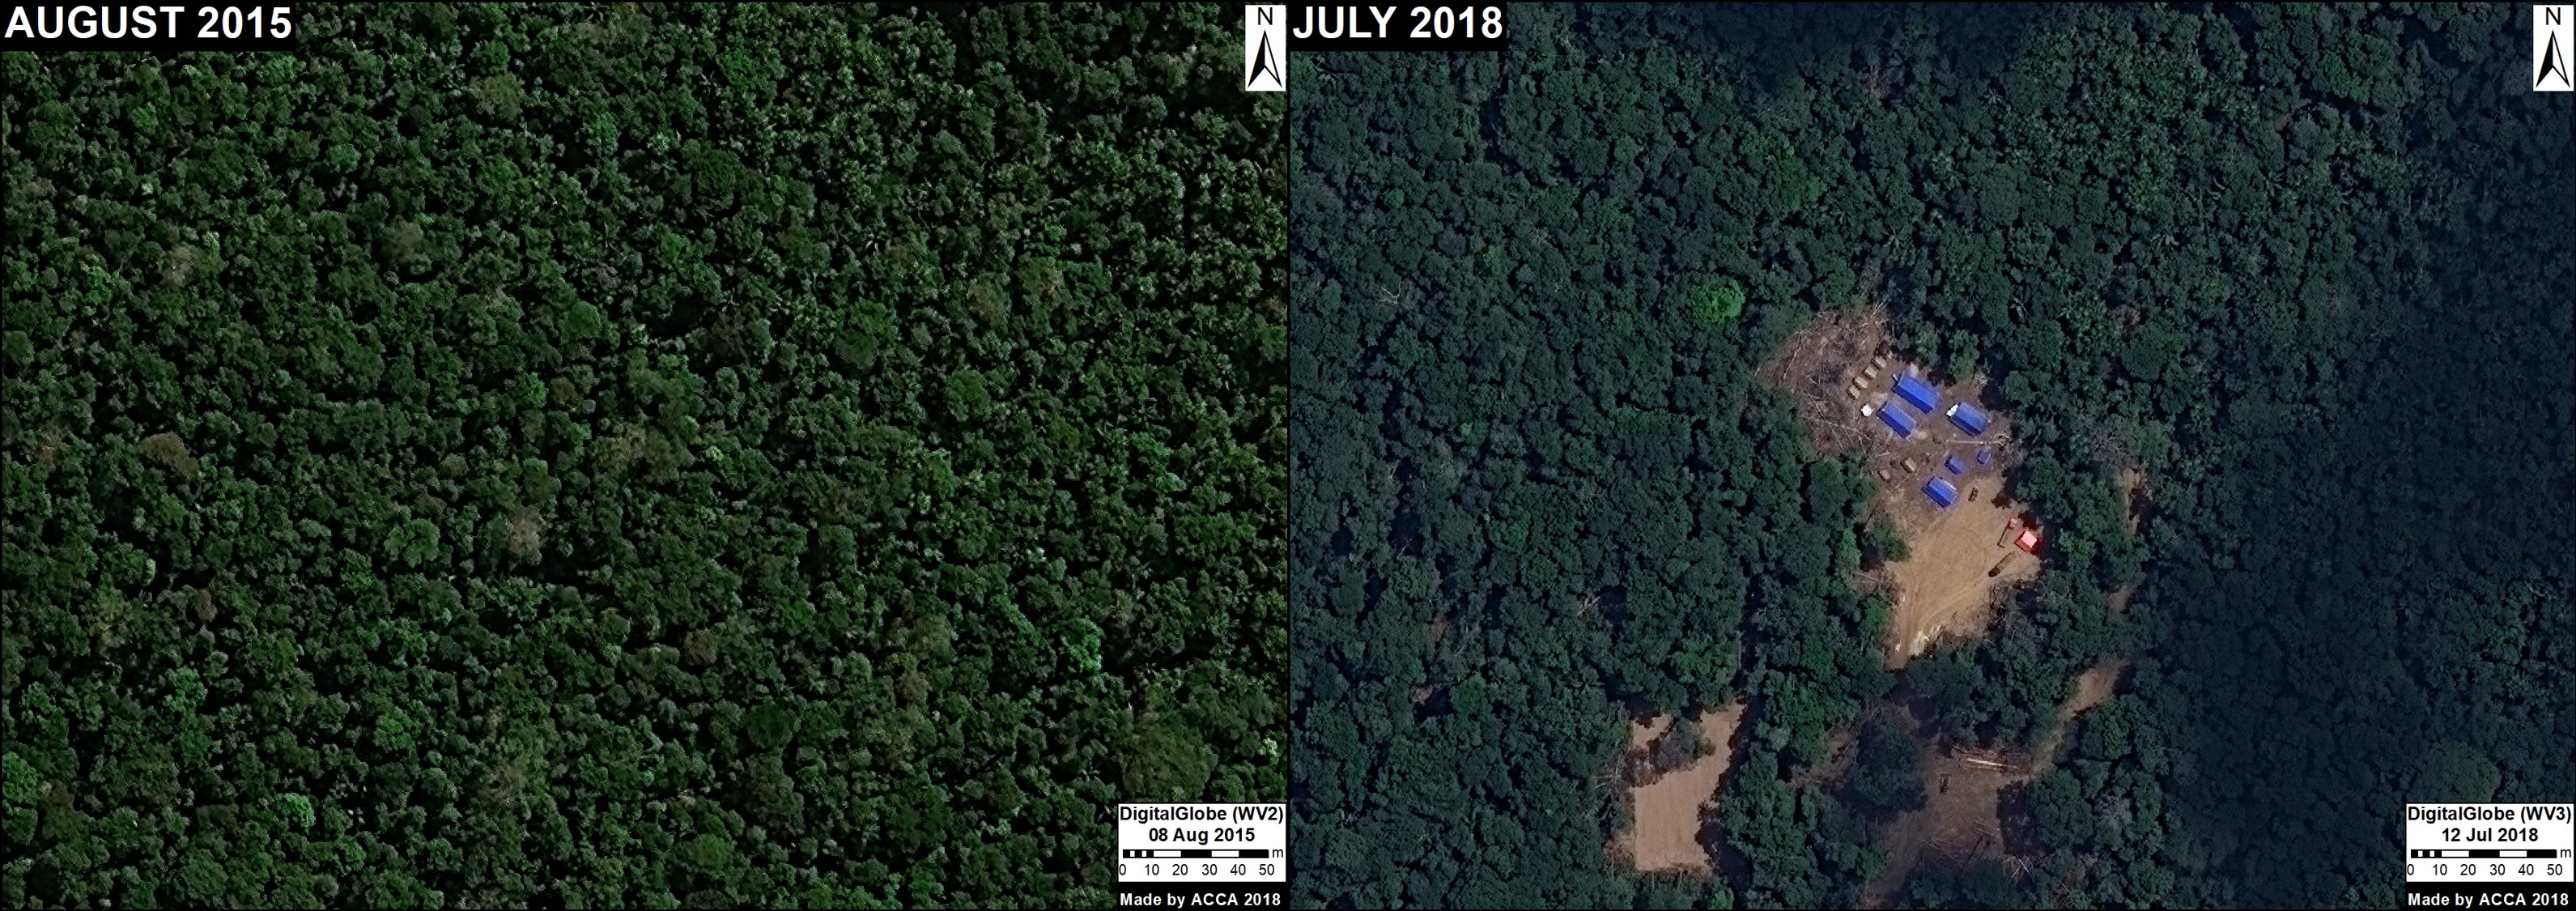
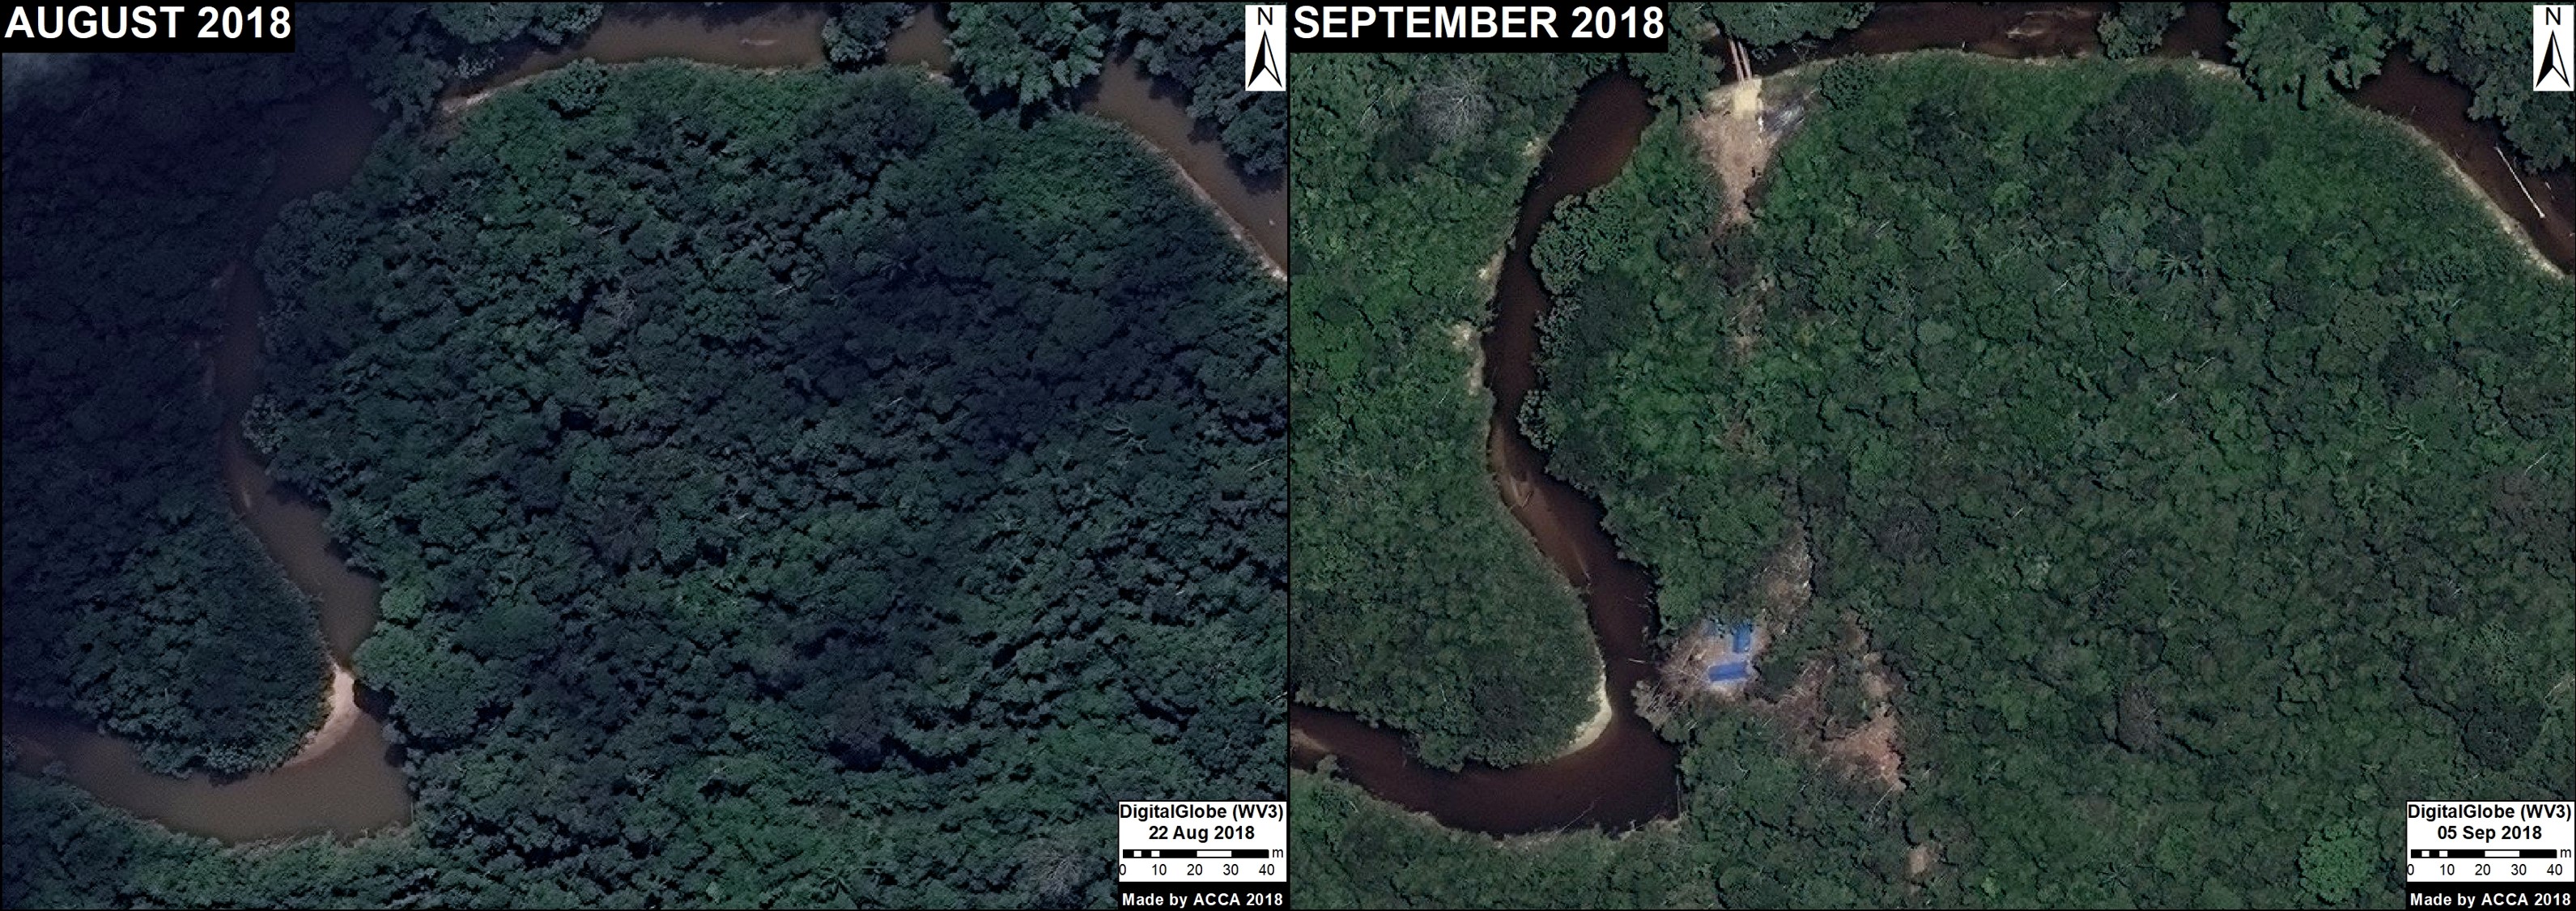
Here, we show the potential of very high-resolution satellites (such as DigitalGlobe and Planet’s Skysat), to identify the activities associated with logging, including illegal logging.
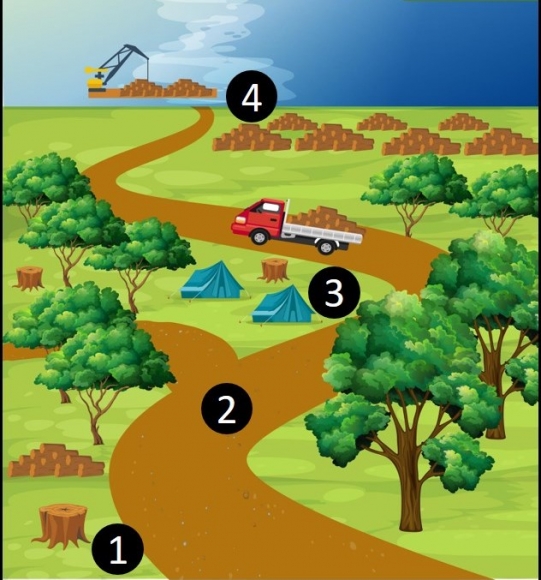
These activities include (see Base Map):
1. Selective logging of high-value trees,
2. Construction of logging roads (access roads),
3. Logging camps
4. Storage and transport
Next, we show a series of very high-resolution images (>50 centimeters), which allow clear identification of these activities.
Note that we show images of both possible legal logging in authorized areas (Images 1,2,5,6,7,9,10) and confirmed illegal logging in unauthorized areas (Images 3,4,8,11,12).*
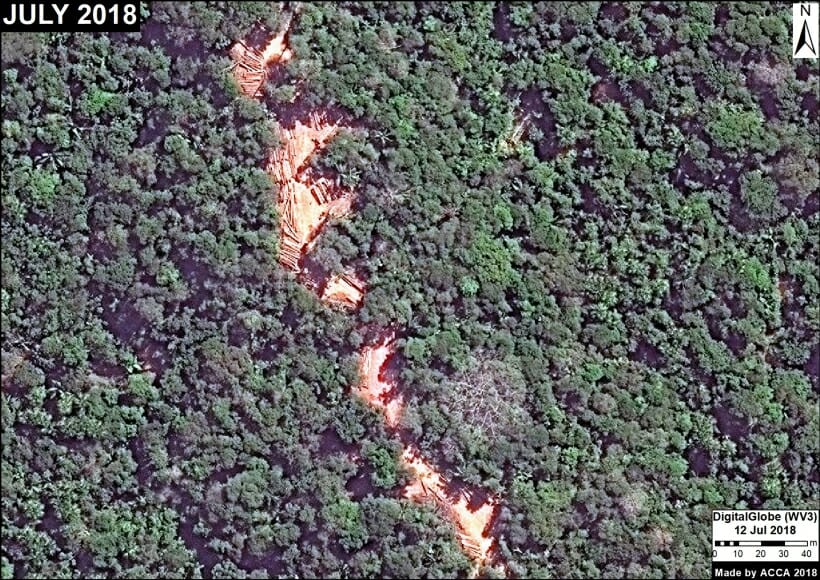
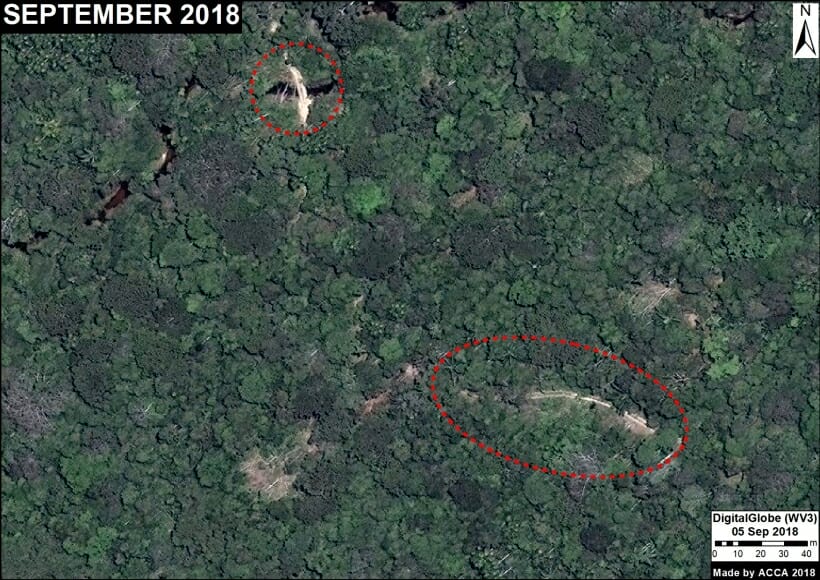
1. Selective logging of high-value trees
The following images (1-4) show examples of selective logging. Importantly, note that Images 3 and 4 show examples of confirmed illegal logging.
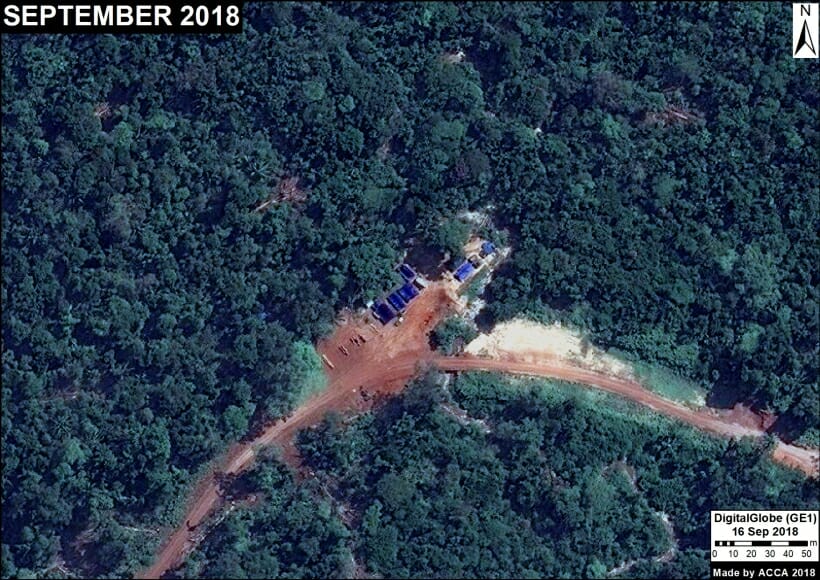
2. Construction of logging roads
The following images (5-8) show examples of the construction of logging roads for access to logging areas and subsequent transport of the wood to collection areas. In Image 7, note that it is possible to identify down to the level of logging trucks. Image 8 shows an example of an illegal logging path in an unauthorized area.
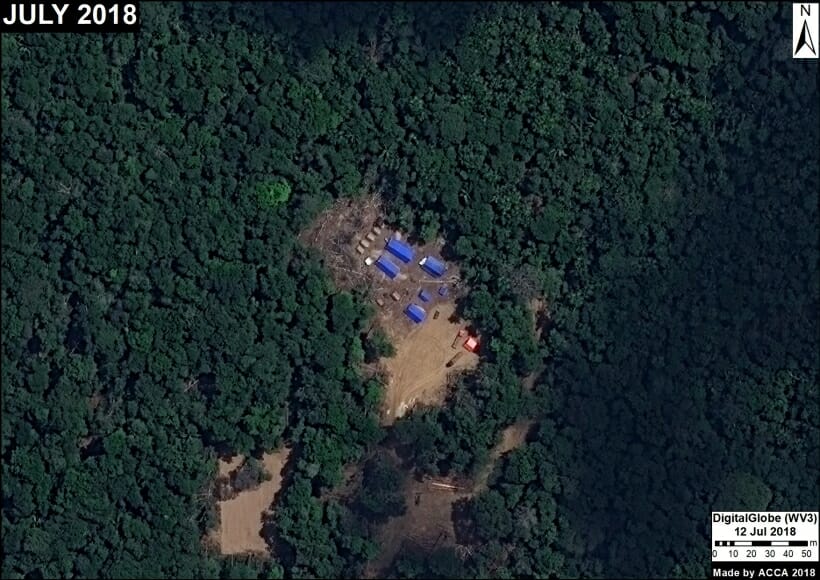
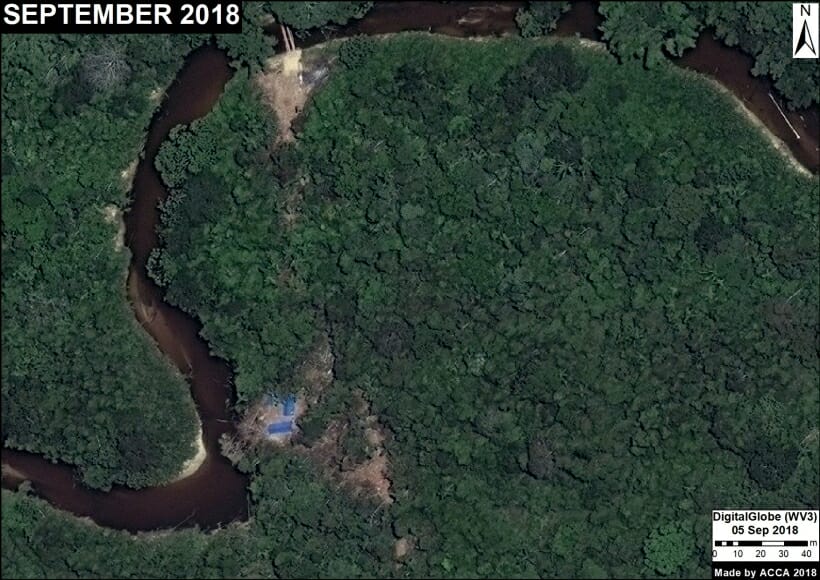
3. Logging camps
The following images (9-12) show examples of logging camps. Note that Images 11 and 12 show illegal camps in unauthorized areas.
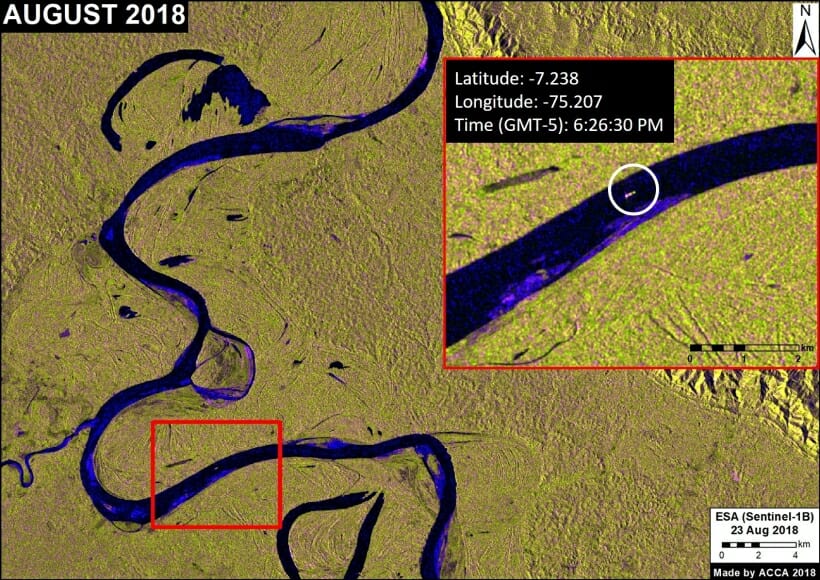
4. Storage and transport
The following images (13-15) show examples of large timber storage areas along major rivers, and the subsequent river transport by boat to the sawmills. In Figure 15, note that radar satellites (such as Sentinel-1) can relatively clearly identify timber transport ships.
Annex
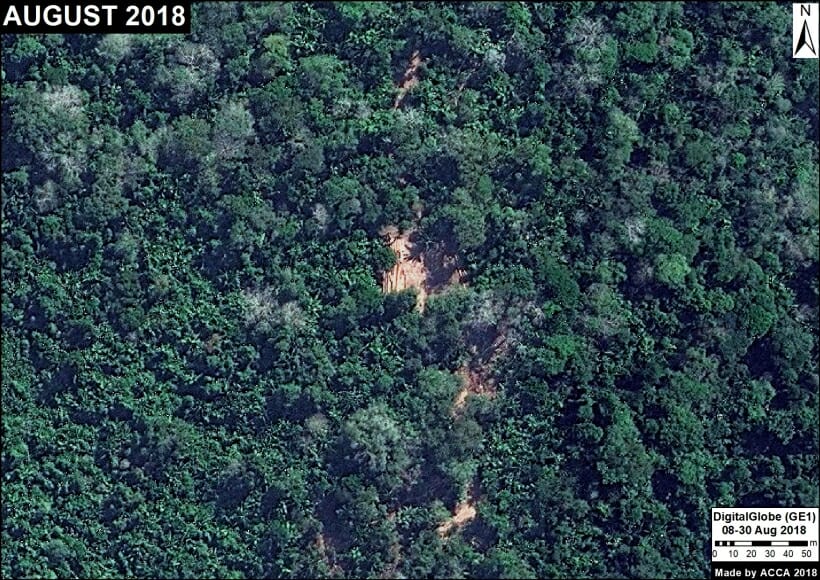
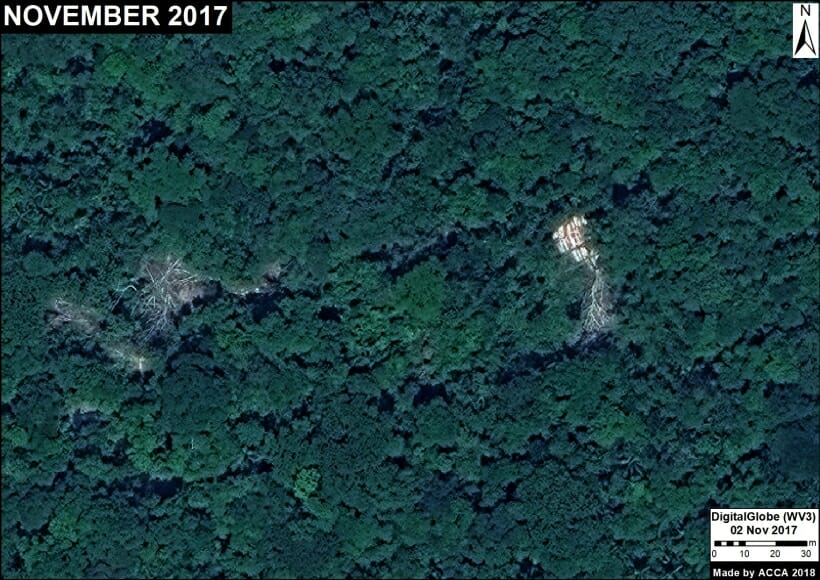
Before and after images. Here we show some of the images as above, but with an additional panel showing what the area looked like before the logging activity.
*Notes
We determined illegal logging by incorporating additional spatial information regarding forestry and conservation areas. Although very high resolution images allow the detection of activities related to selective logging, the determination of the legality of these activities often requires complementary and detailed information from the corresponding government entities.
Citation
Villa L, Finer M (2018) Detecting Logging in the Peruvian Amazon with High Resolution Imagery. MAAP: 94.
