Continuing our annual series, we present a detailed look at the major 2024 Amazon forest loss hotspots, based on the final annual data recently released by the University of Maryland and featured on Global Forest Watch. As in other reports of the series, we take this global dataset and analyze it for the Amazon specifically.
This forest loss dataset serves as a consistent source across all nine countries of the Amazon, distinguishing forest loss from fire and non-fire causes. We use the non-fire forest loss as a proxy for human-caused deforestation, although it also includes some natural loss (such as landslides and windstorms). Previous research has confirmed that nearly all Amazon fires are human-caused (MAAP #189).
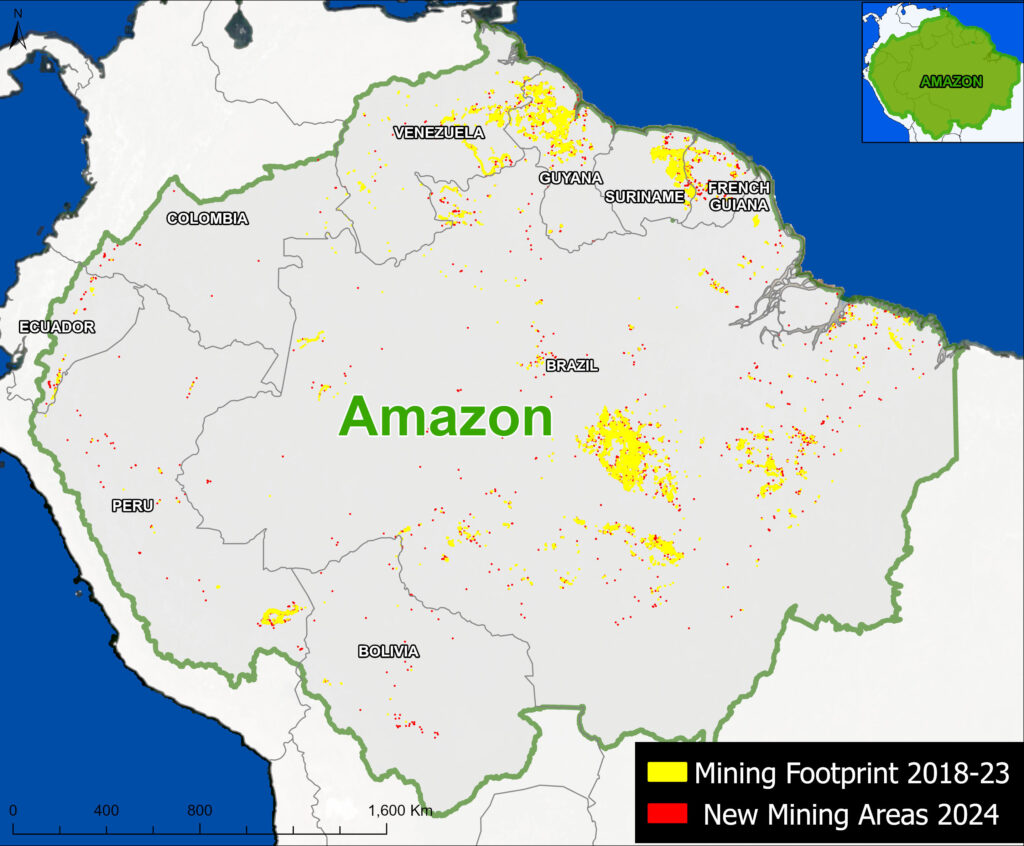
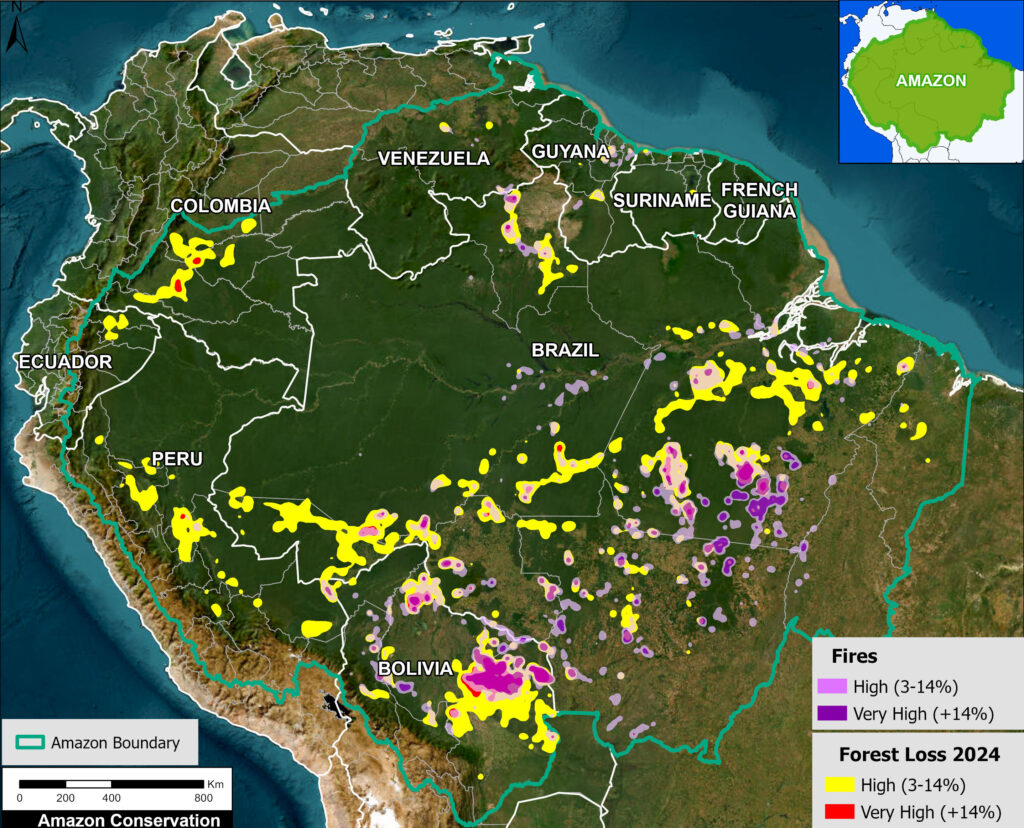
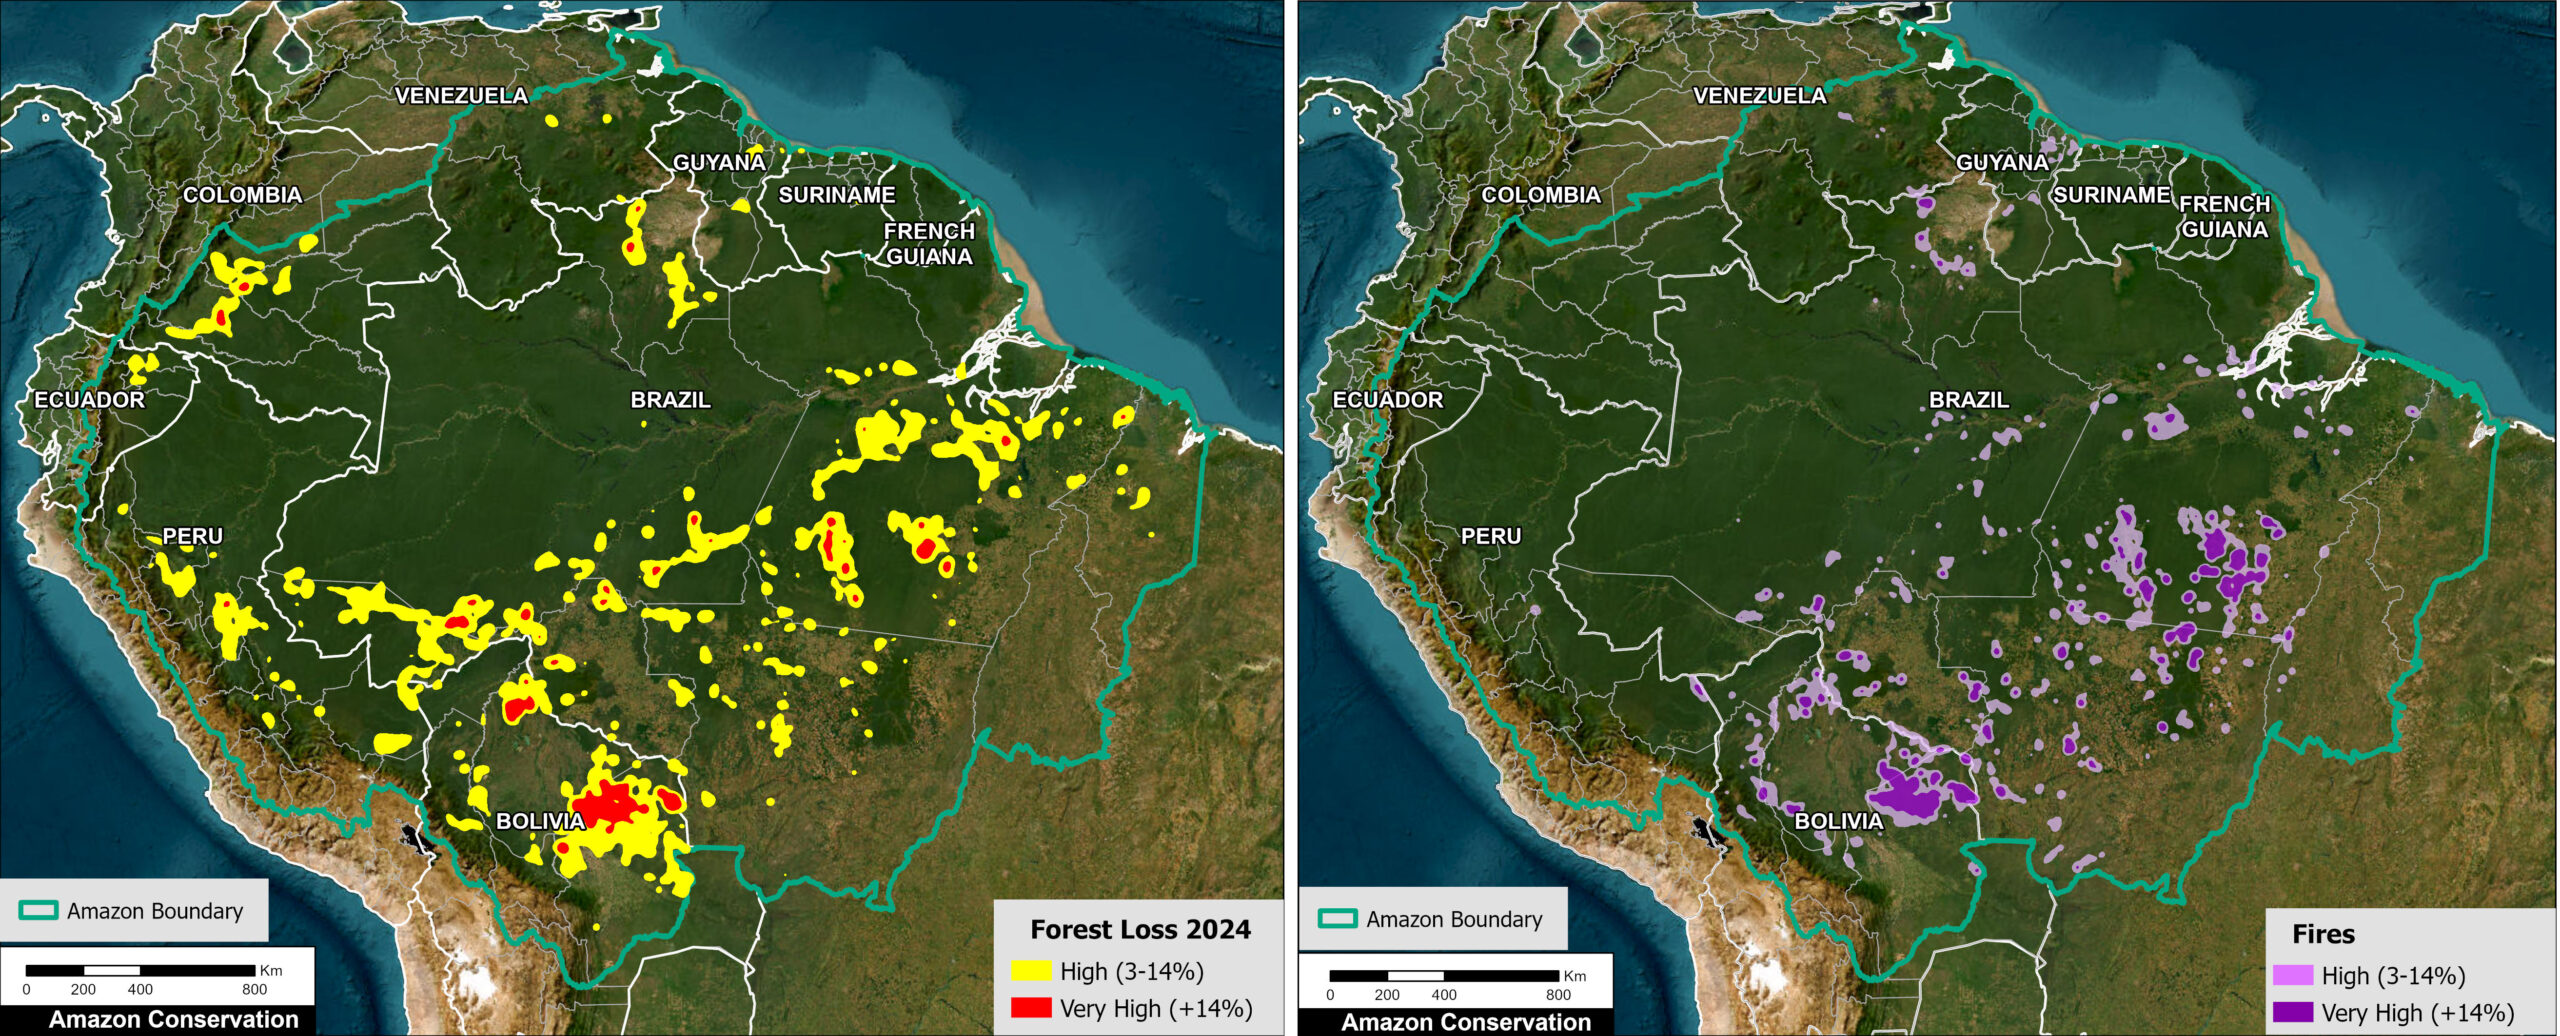
With this context, we are able to present both estimated deforestation and fire hotspots across the Amazon (see Base Map and Graph 1).
In 2024, the deforestation was the fifth highest on record (since 2002), at over 1.7 million hectares (4.3 million acres) across the Amazon. This value represents a major increase (34%) from 2023, but a decrease (12%) from the recent peak in 2022 (1.98 million hectares). The majority of the deforestation occurred in Brazil (54.7%), followed by Bolivia (27.3%), Peru (8.1%), and Colombia (4.7%) as the clear top four in 2024.
The big story in 2024, however, was the record-breaking impact of fires on primary forests, with a total of 2.8 million hectares (6.9 million acres). This total shattered the previous record of 1.7 million hectares in 2016. The vast majority (95%) of this fire impact occurred in just two countries: Brazil and Bolivia, which both set annual fire records of their own (along with Peru, Guyana, Suriname, and French Guiana). Overall, this fire data may be interpreted as forest degradation, in contrast to the more permanent impacts of deforestation.
In terms of spatial patterns, the Base Map indicates that most of the intense forest loss hotspots were due to fire. These fire hotspots were especially concentrated in the soy and cattle frontiers of the southeast Brazilian Amazon and southeast Bolivian Amazon. The deforestation hotspots (without major associated fires) were largely due to agriculture and gold mining across the Amazon, notably in Bolivia, Brazil, Colombia, Ecuador, and Peru. See Annex 1 for the overall forest loss hotspots (without the specific fire loss data).
Previous research has revealed the tight link between deforestation and fires in the Amazon (MAAP #189). That is, many major fires are burning recently deforested areas, and sometimes escape into surrounding forests, especially with extended dry conditions.
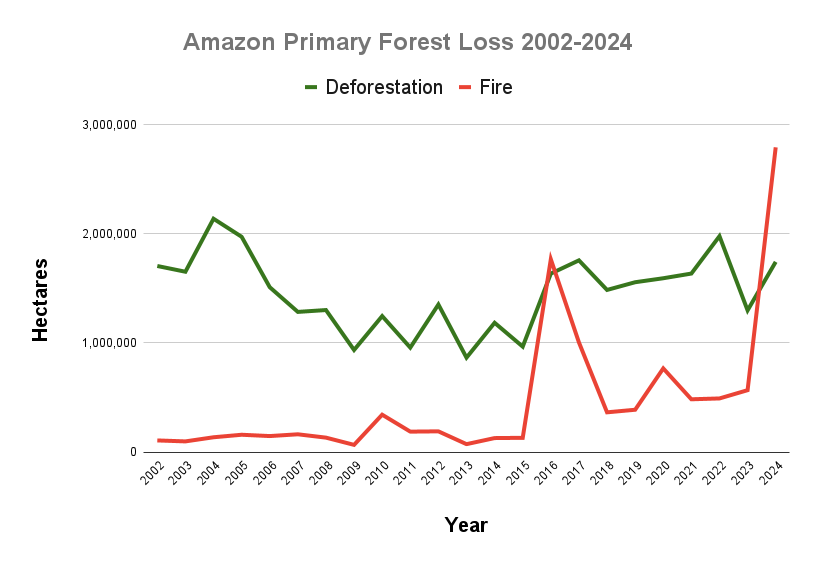
In total, 4.5 million hectares (11.2 million acres) of primary forest were impacted by deforestation and fire combined. This total is the highest on record by far, surpassing 2016 (3.4 million hectares) by over a million hectares.
Since 2002, we estimate the deforestation of 33.7 million hectares (83.4 million acres) of primary forest, greater than the size of the state of New Mexico. An additional 10.6 million hectares (26.2 million acres) have been impacted by fires.
Below, we zoom in on the four countries with the highest deforestation (Brazil, Bolivia, Peru, and Colombia), plus additional highlights from around the Amazon (Guyana, Venezuela, and Ecuador).
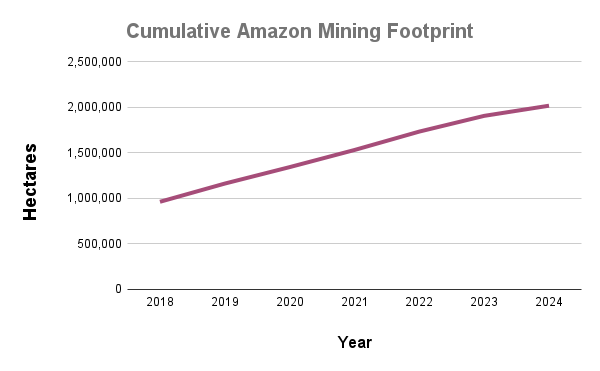
Amazon Primary Forest Loss, 2002-2024
Graph 1 shows the historical trend of Amazonian primary forest loss, from 2022 to present.
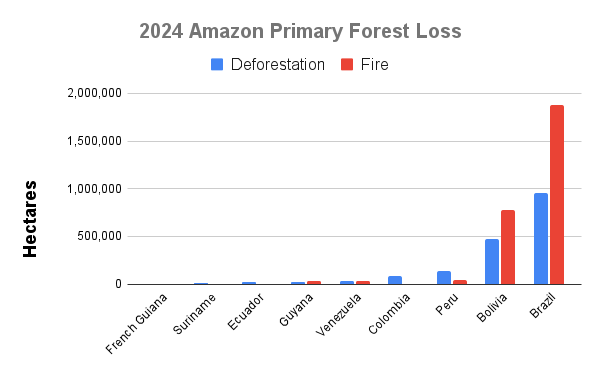
Amazon Primary Forest Loss (By Country), 2002-2024
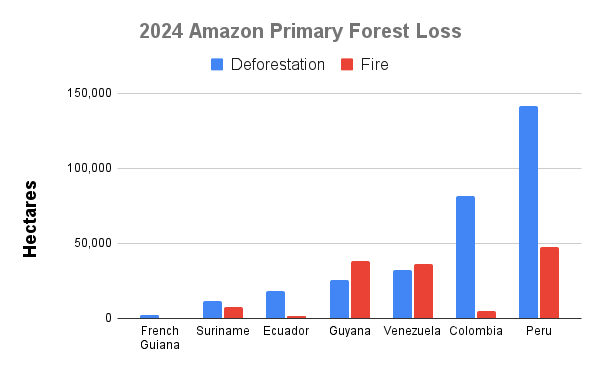
Graph 2a shows 2024 Amazon primary forest loss for all nine countries. In Annex 2, Graph 2b removes Brazil and Bolivia to see the other countries in greater detail.
Brazilian Amazon
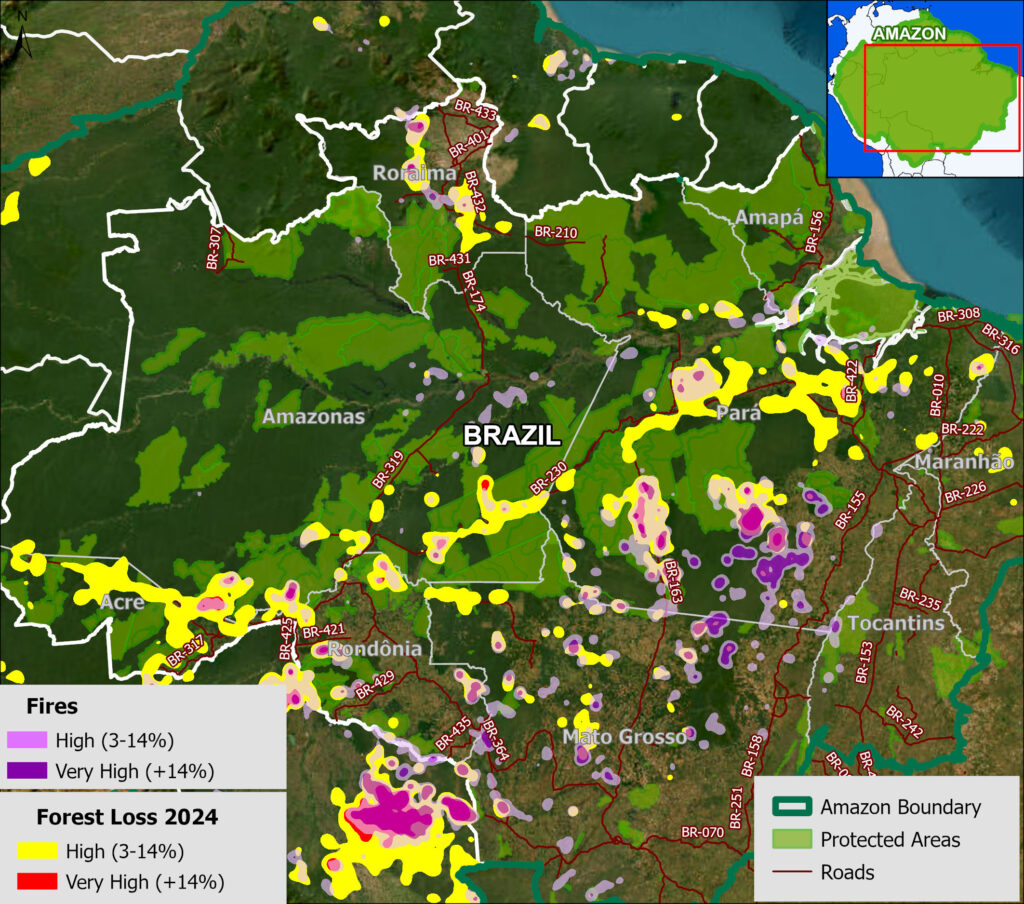
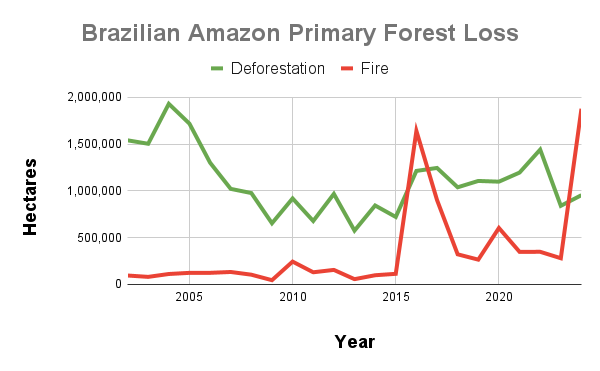
In 2024, the Brazilian Amazon lost 954,126 hectares (2.4 million acres) of primary forest to deforestation. Although this total marked a 13.6% increase from 2023, it was historically relatively low (16th highest overall since 2002).
The bigger story is that fires directly impacted an additional 1.9 million hectares (4.6 million acres). This fire impact was the highest on record, surpassing the previous high of 2016 (1.6 million hectares).
All of the most intense forest loss hotspots were characterized by intense fires. Many of these hotspots were concentrated in the southeast Brazilian Amazon (Figure 2). These areas include along the major north-south road in the state of Pará (BR-163), and further to the east of this road. The hotpots also expanded south into the soy frontier of Mato Grosso state.
Fire hotspots were also located in the northern state Roraima, and along the other major road networks, especially road BR-230 (Trans-Amazonian Highway) in the states of Pará and Amazonas, and road BR-364 in the state of Acre.
Previous research has revealed that over 70% of major fires in the Brazilian Amazon are burning recently deforested areas (MAAP #189). In extended dry conditions, such as 2016 and 2024, these major fires escape into surrounding forests.
Bolivian Amazon
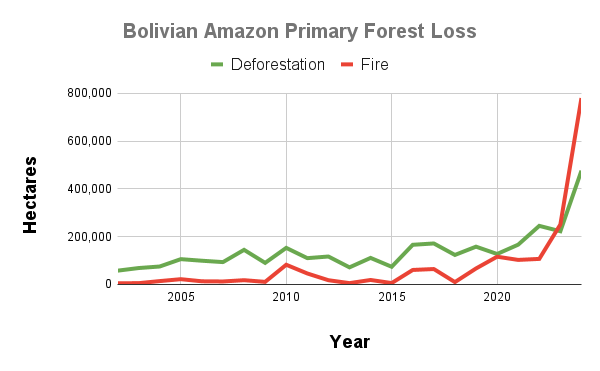
In 2024, the Bolivian Amazon lost 476,030 hectares (1.2 million acres) of primary forest to deforestation. This total was the highest on record, surpassing the previous high of 2022 (245,177 hectares).
In an even bigger shattering record, fires directly impacted an additional 779,960 hectares (1.9 million acres). This total crushed the previous record of 2023 (250,843 hectares).
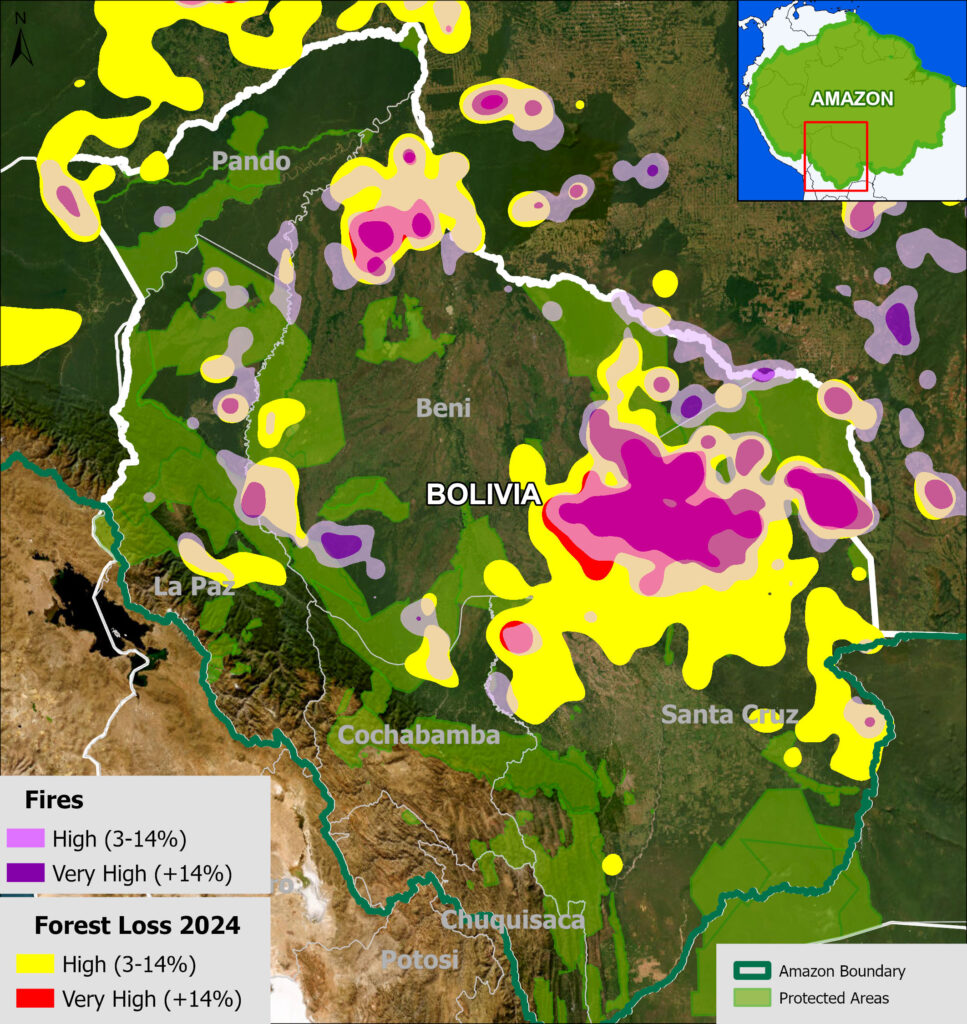
Like Brazil, the most intense forest loss hotspots were characterized by intense fires.
These fires were concentrated in the soy frontier located in the southeastern department of Santa Cruz (Figure 3). We emphasize that this particular hotspot is further north than in previous years, indicating a northern expansion of soy plantations.
There was also a concentration of fire hotspots along the Beni and Pando departments’ border, and closer to the Andes Mountains in the departments of La Paz and Beni.
Deforestation hotspots (without fires) were concentrated in the soy frontier in the southeast.
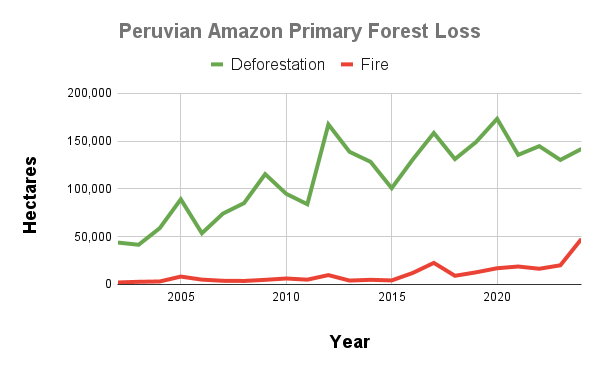
Peruvian Amazon
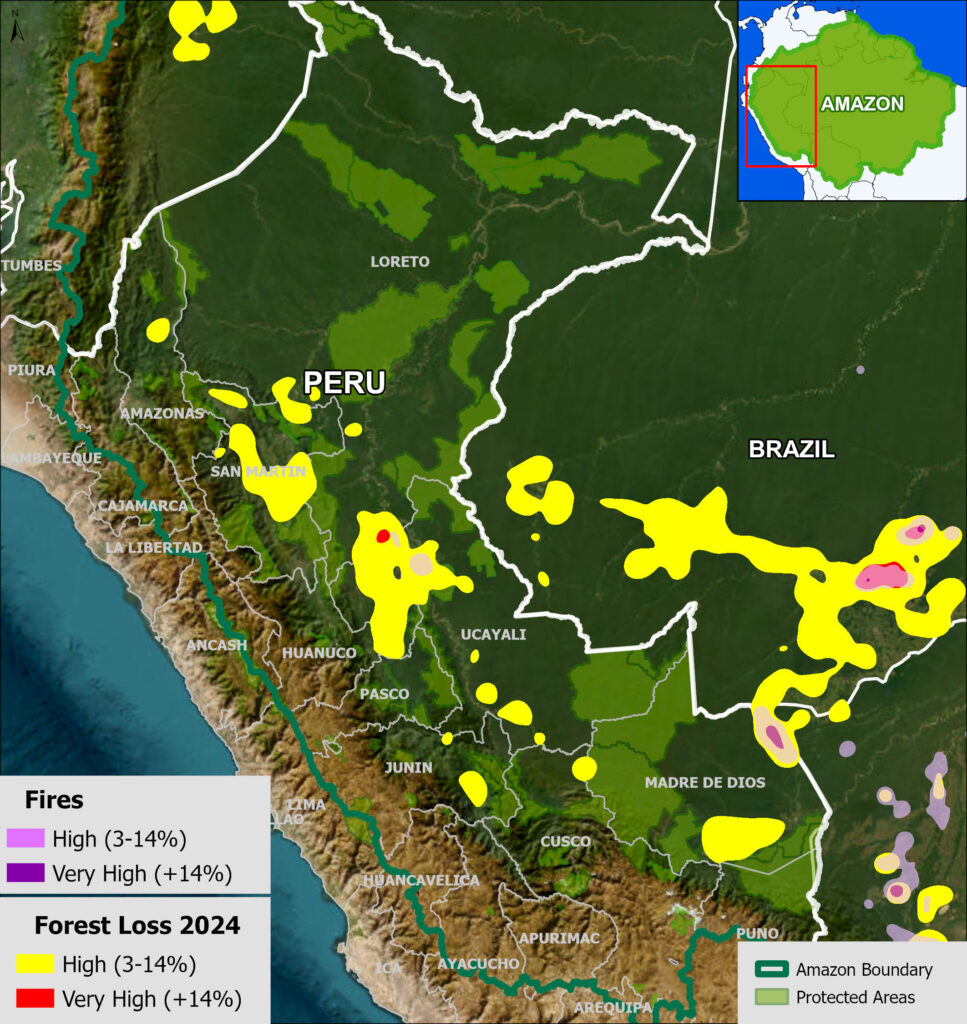
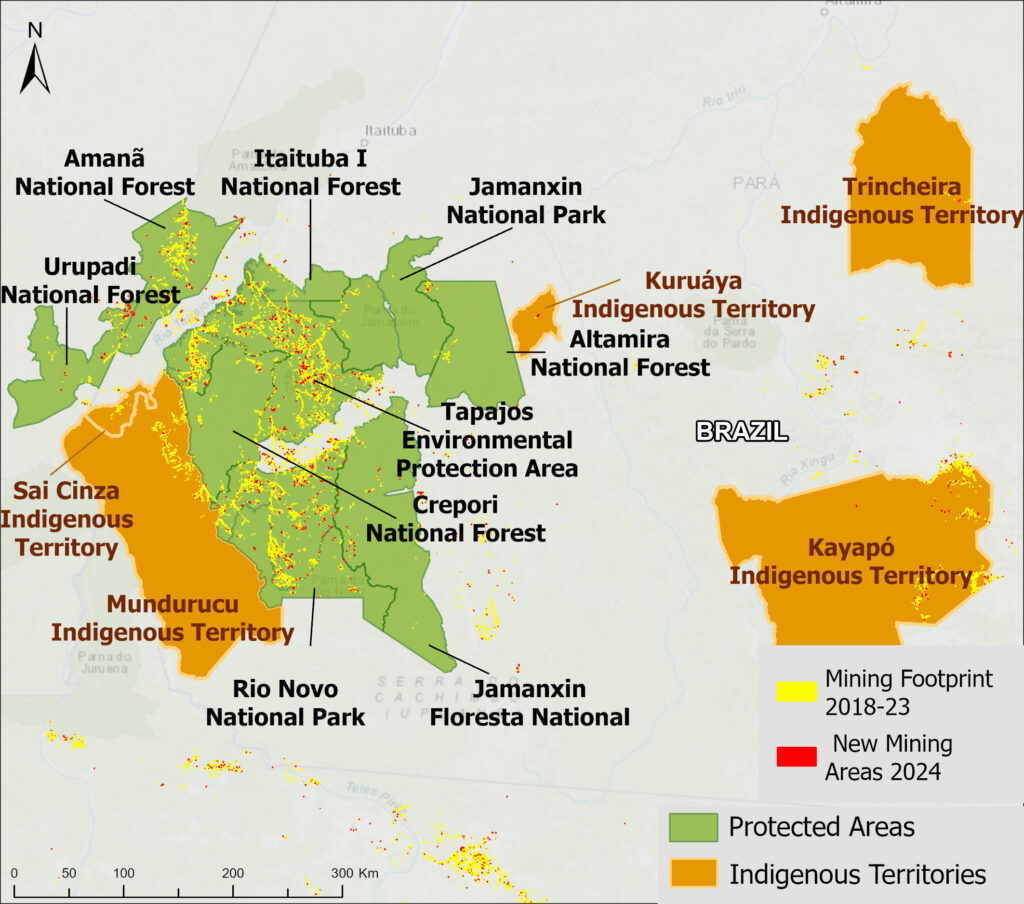
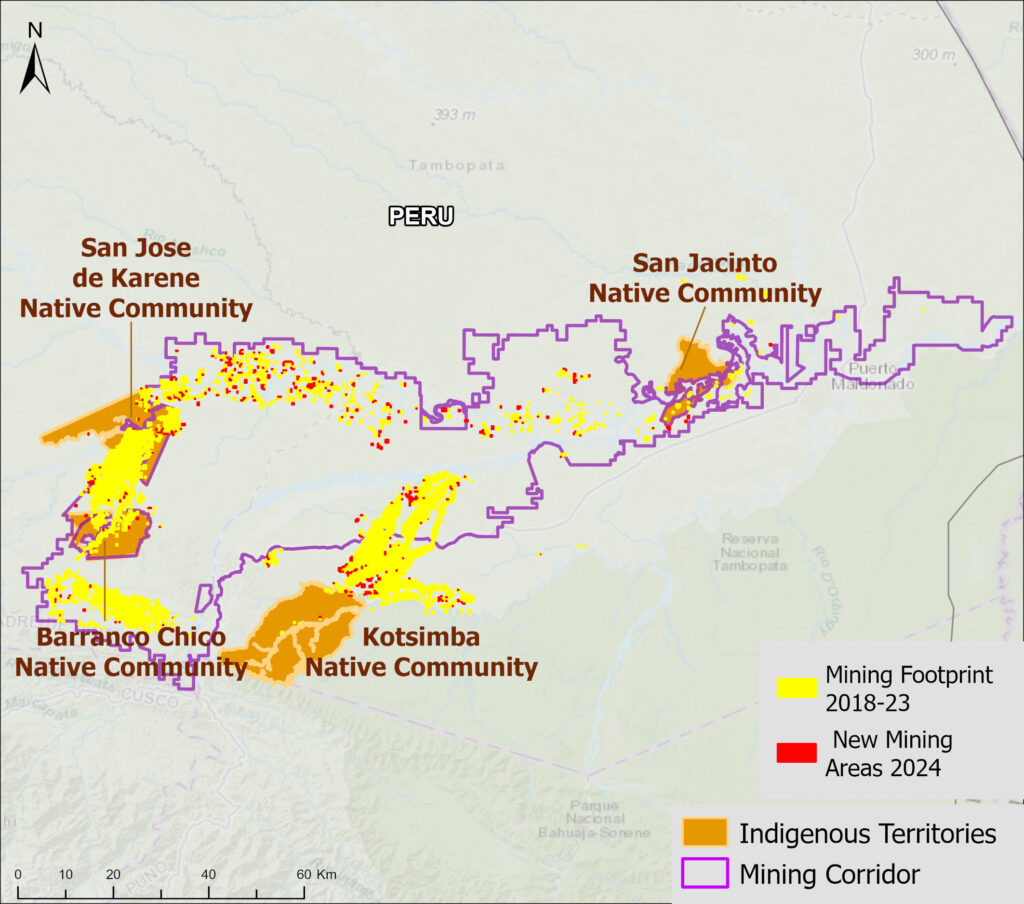
In 2024, the Peruvian Amazon lost 141,781 hectares (350,341 acres) of primary forest to deforestation. This total marks the 6th highest on record since 2002.
Breaking a record, fires impacted an additional 47,574 hectares (117,554 acres). This total more than doubled the previous high of 2023 (20,042 hectares). As noted above, this fire data may be interpreted as forest degradation, in contrast to the more permanent impacts of deforestation.
Like both Brazil and Bolivia, all of the most intense forest loss hotspots were characterized by intense fires. These fires were concentrated in the central and southeast Amazon (Ucayali and Madre de Dios regions, respectively) (Figure 4).
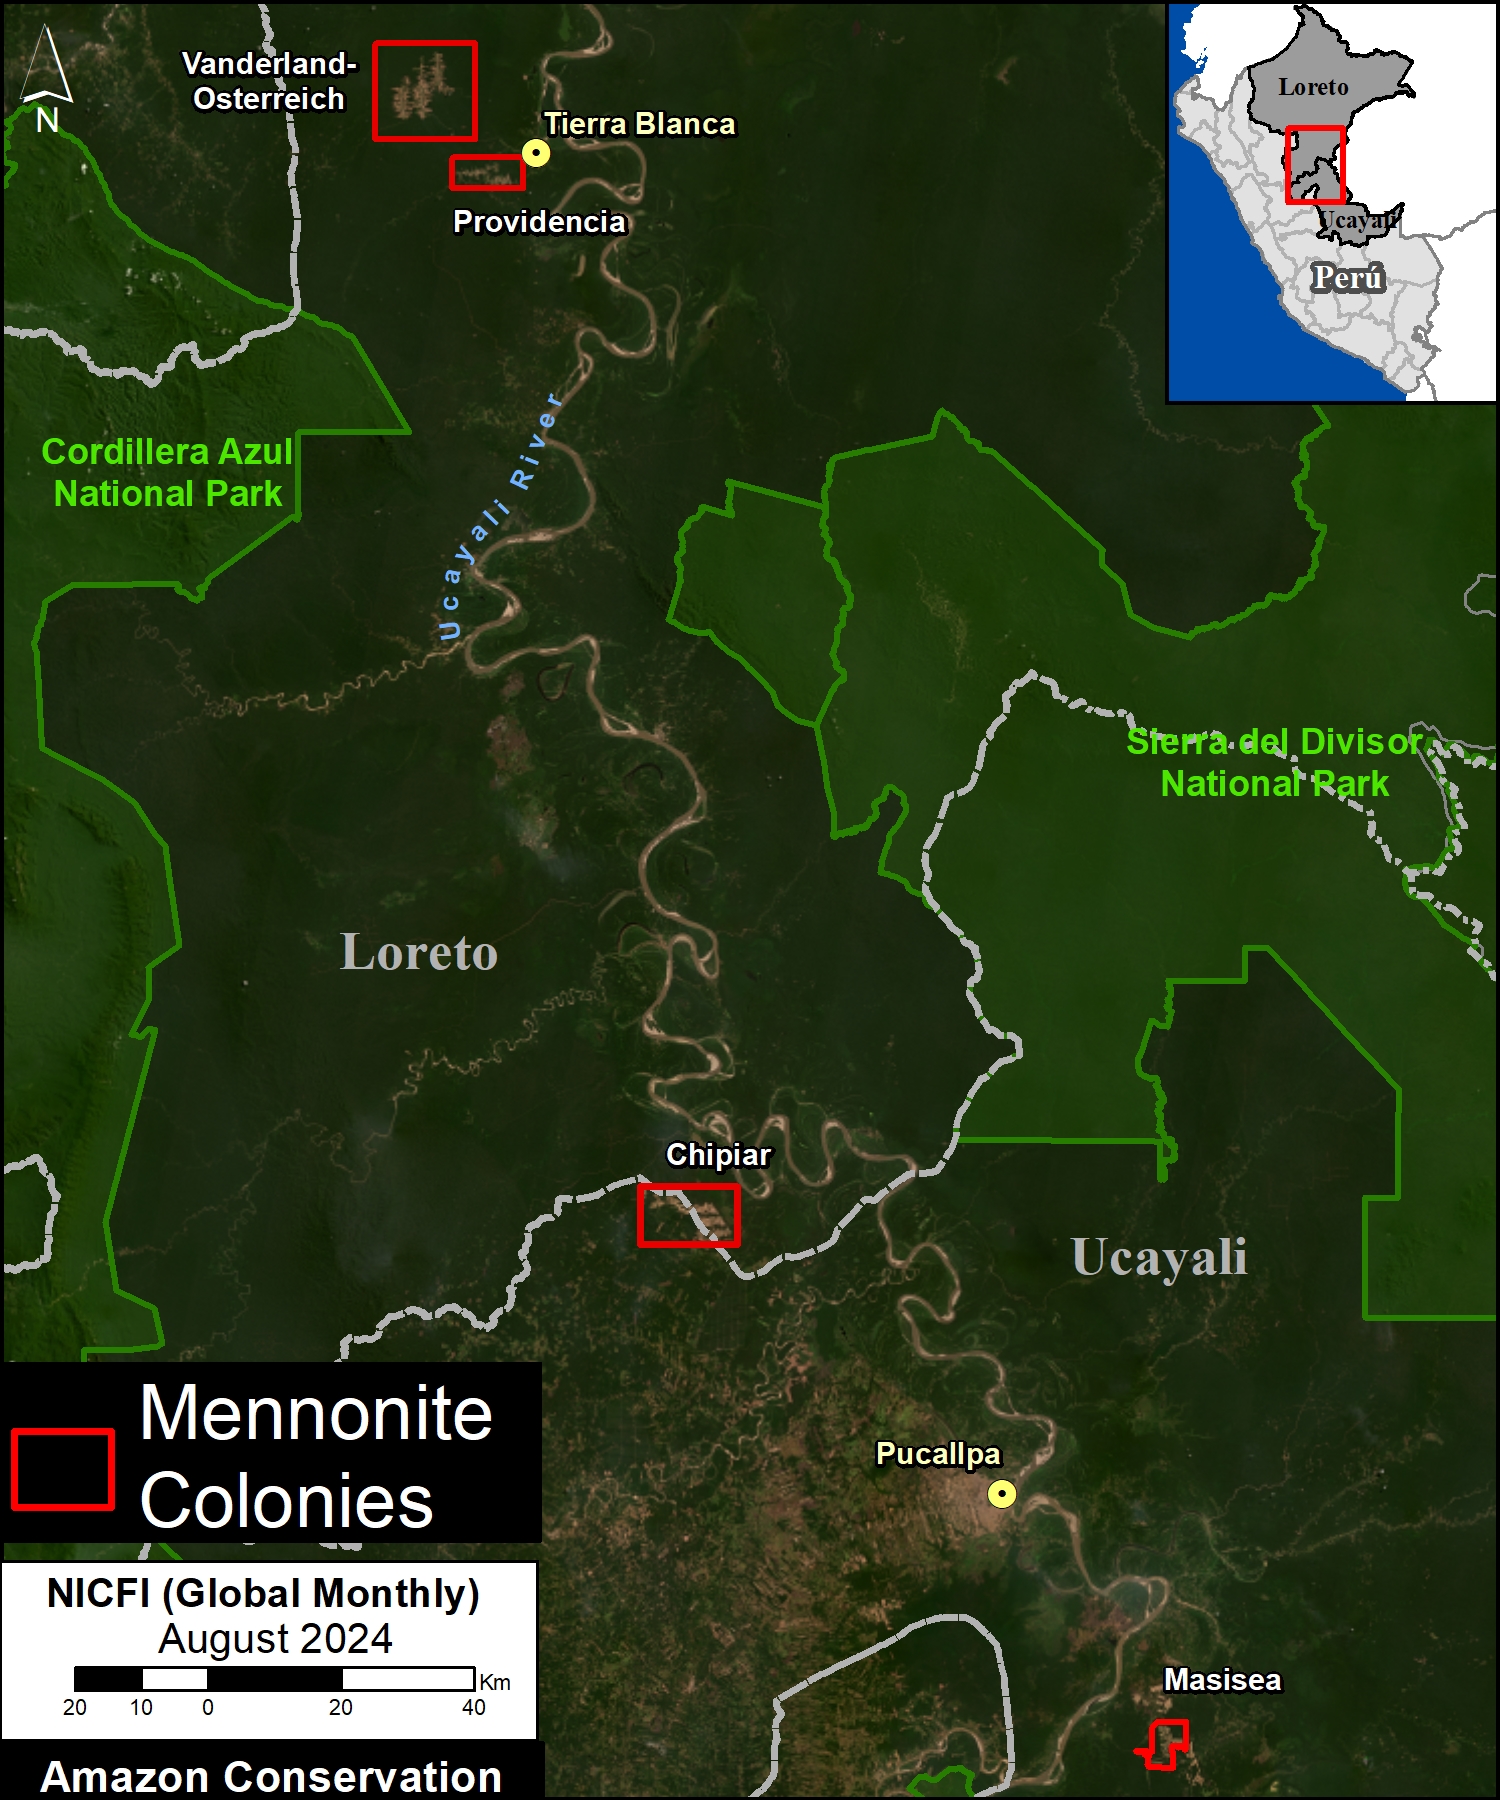
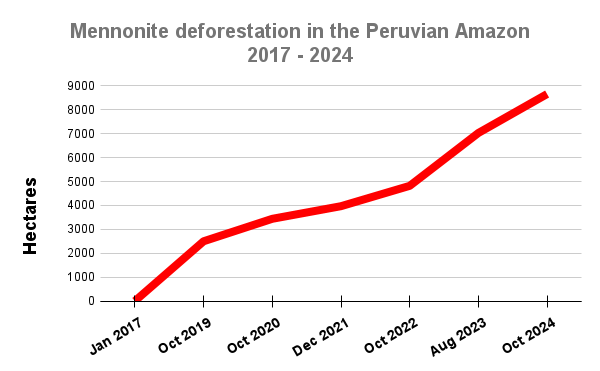
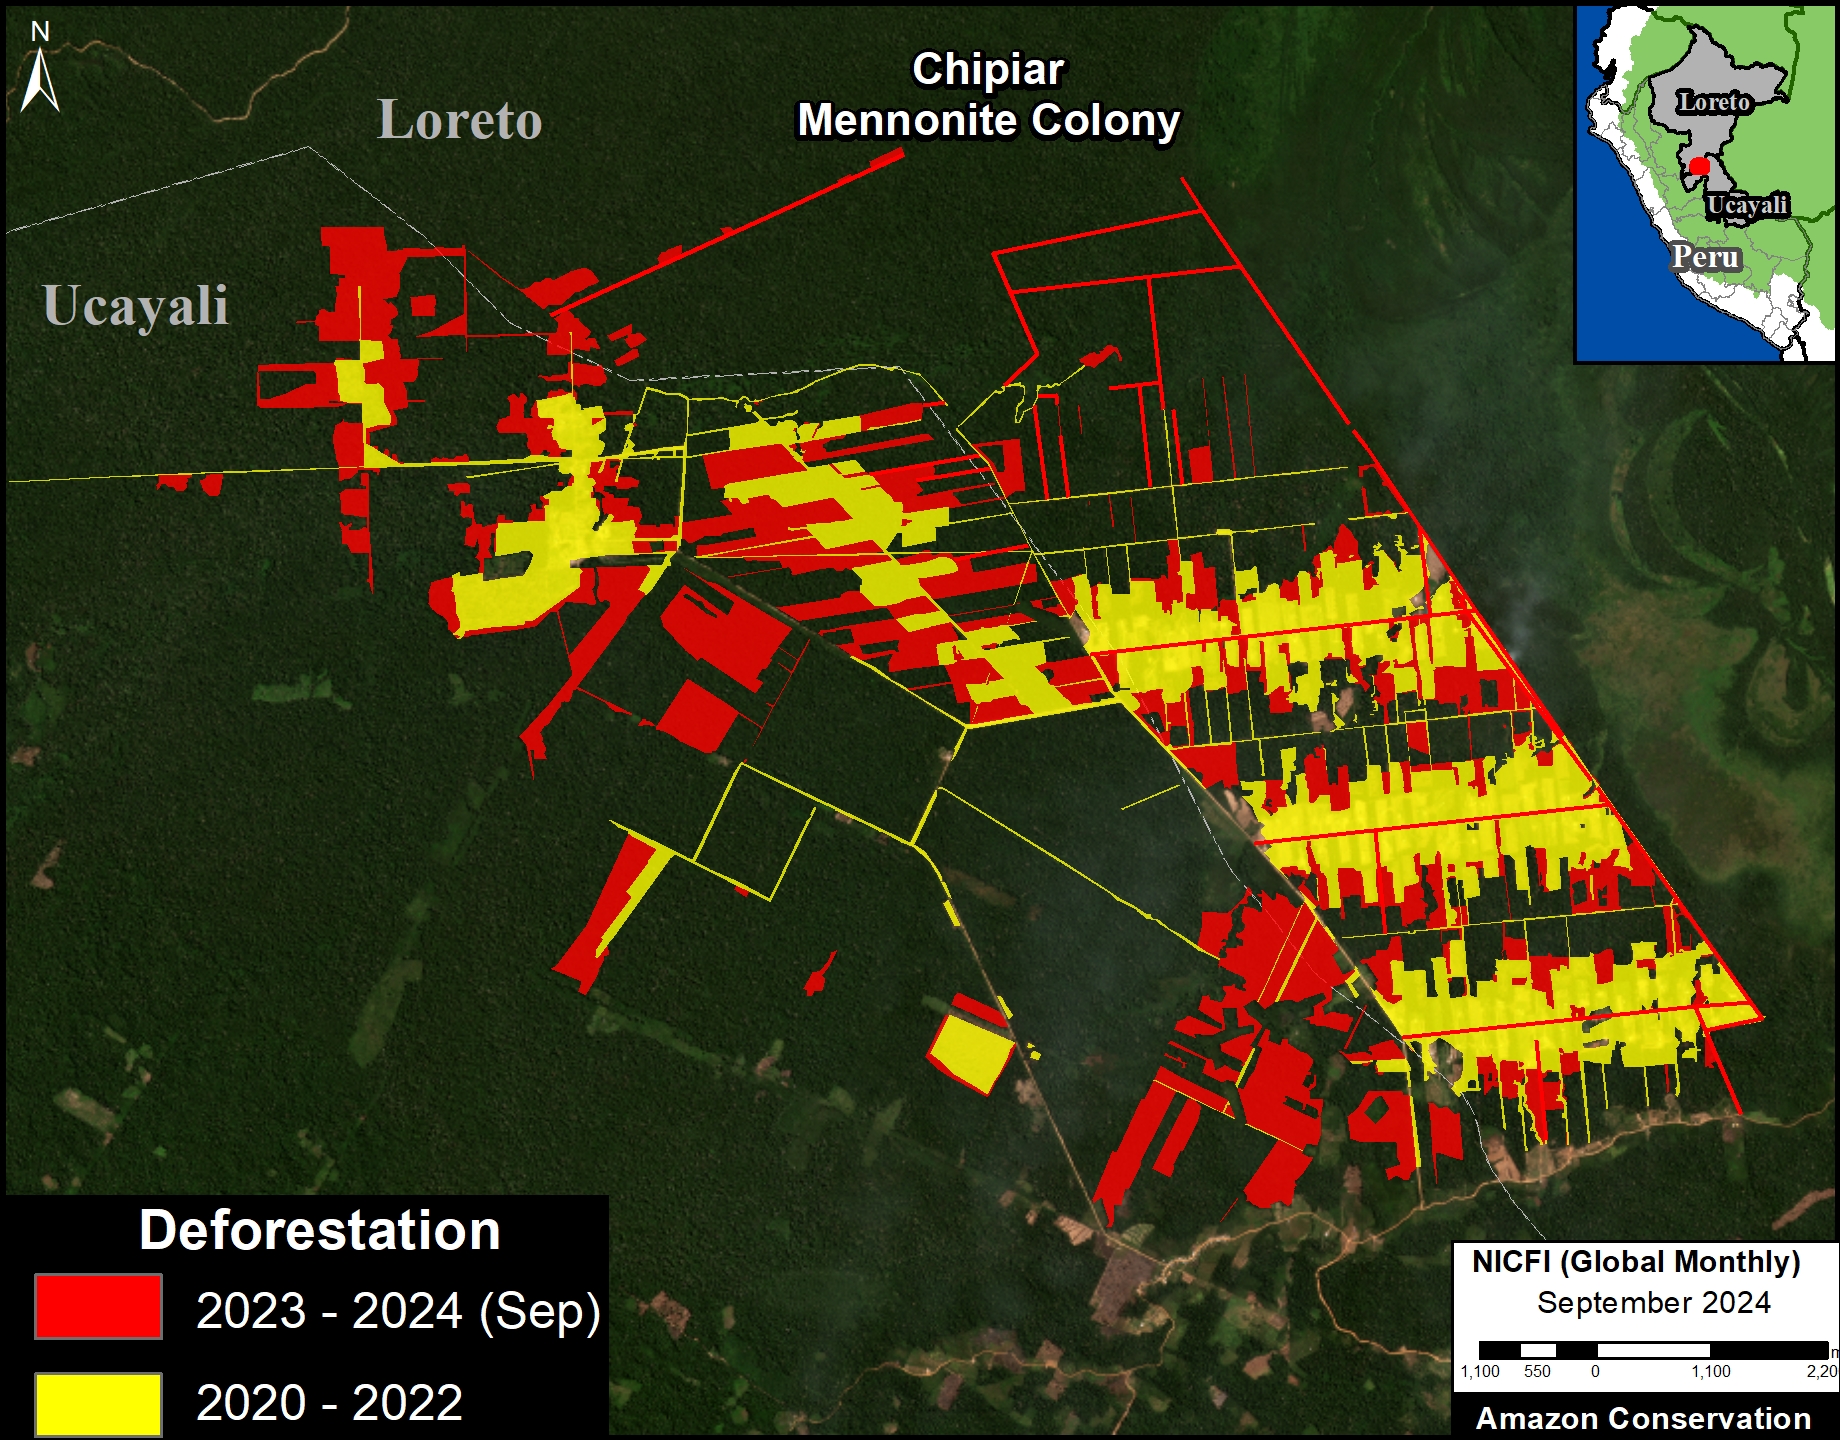
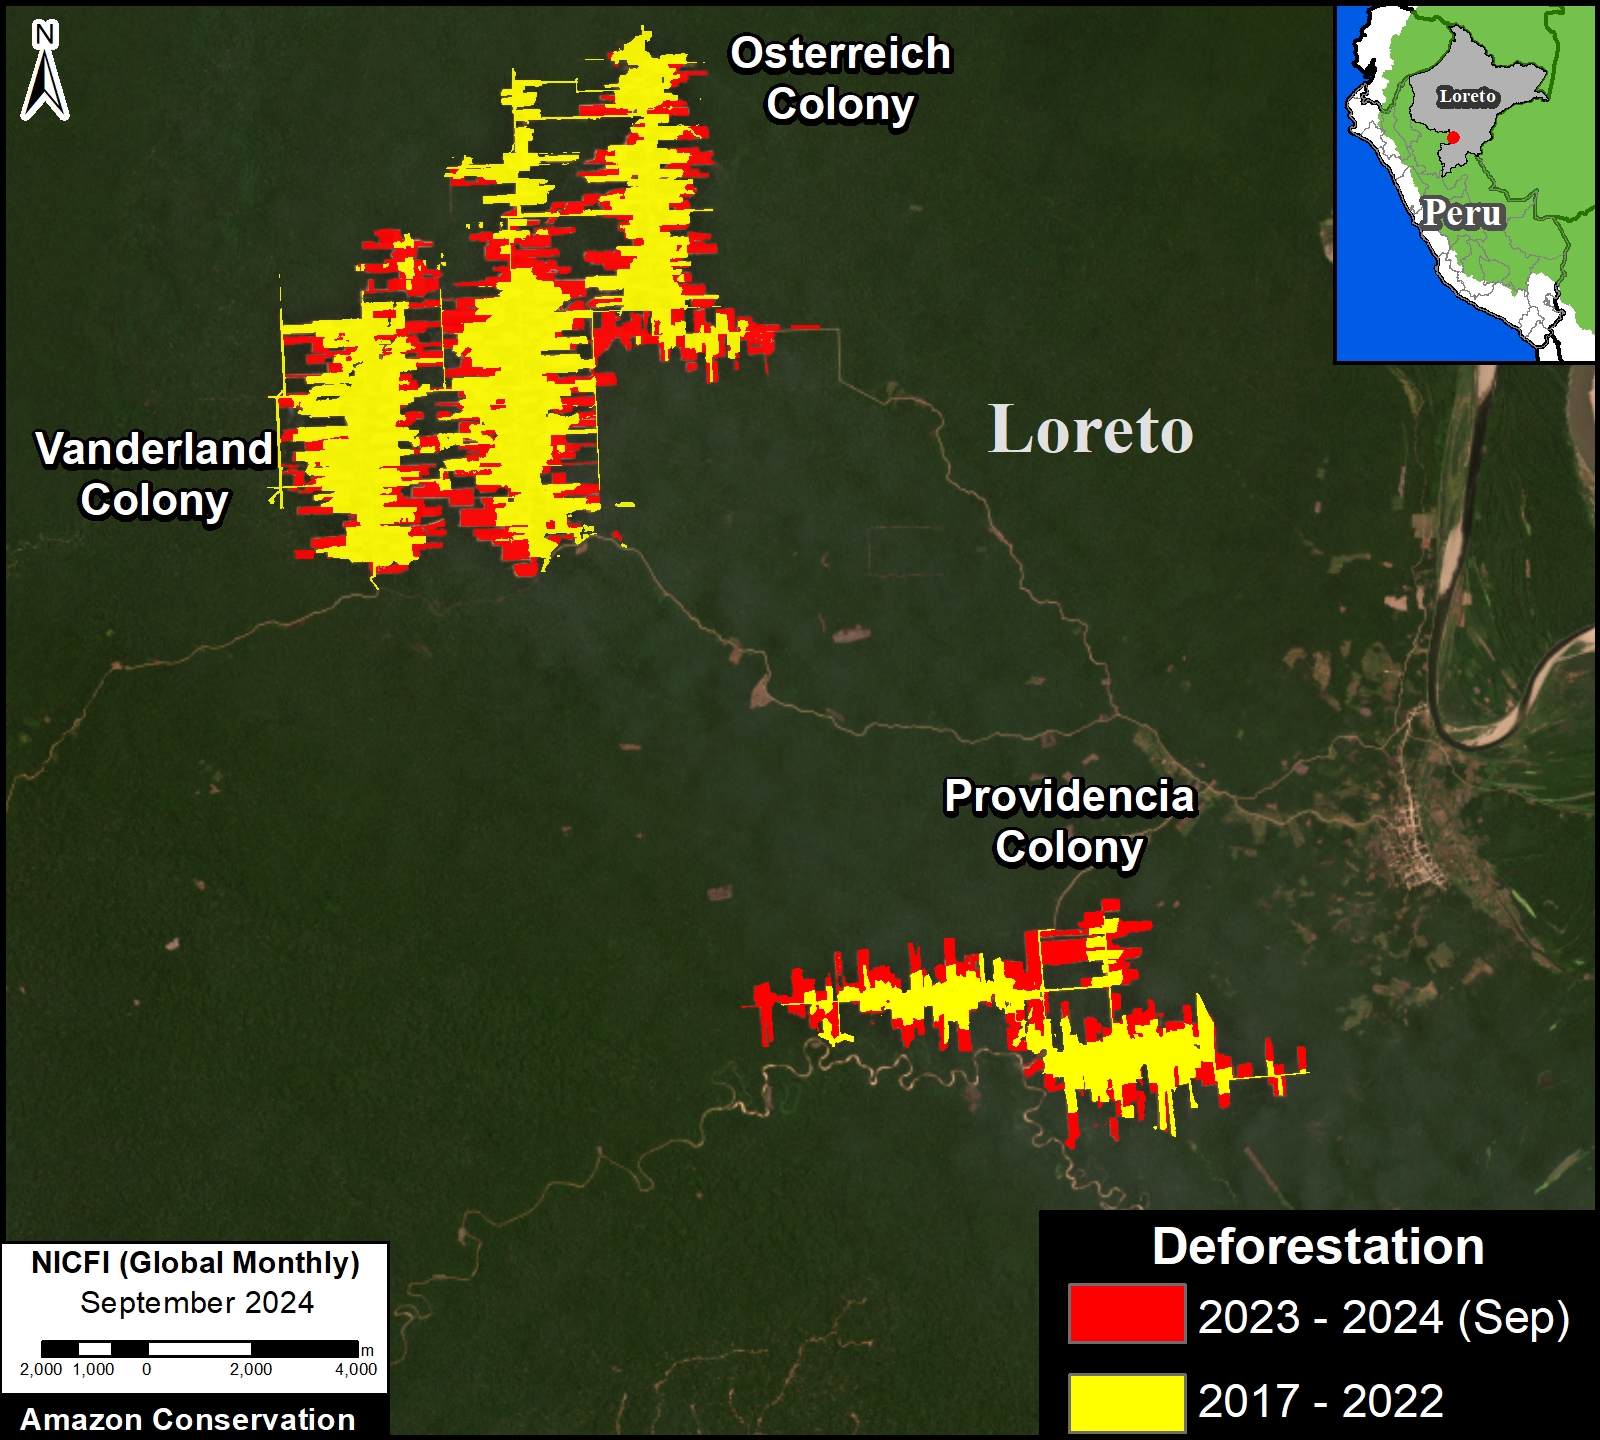
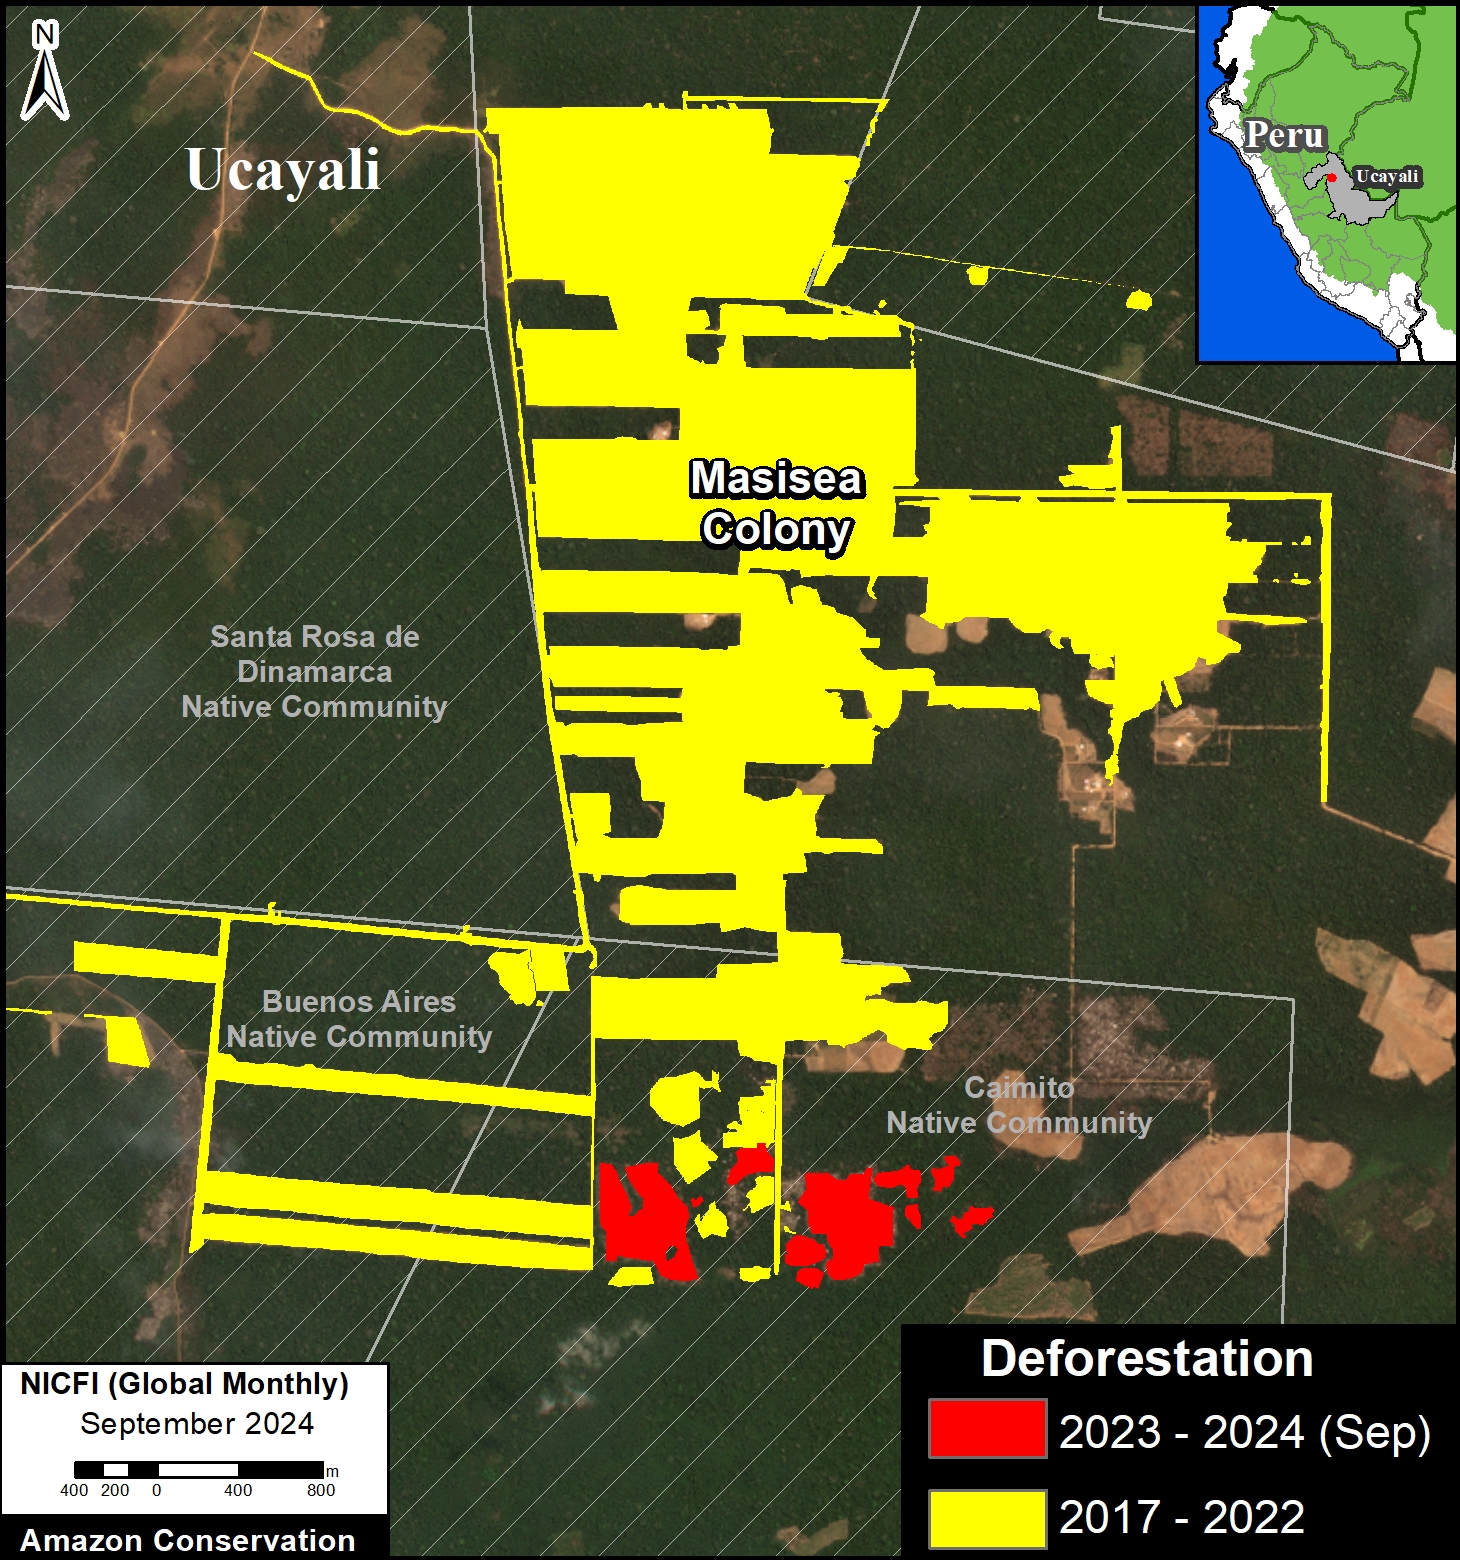
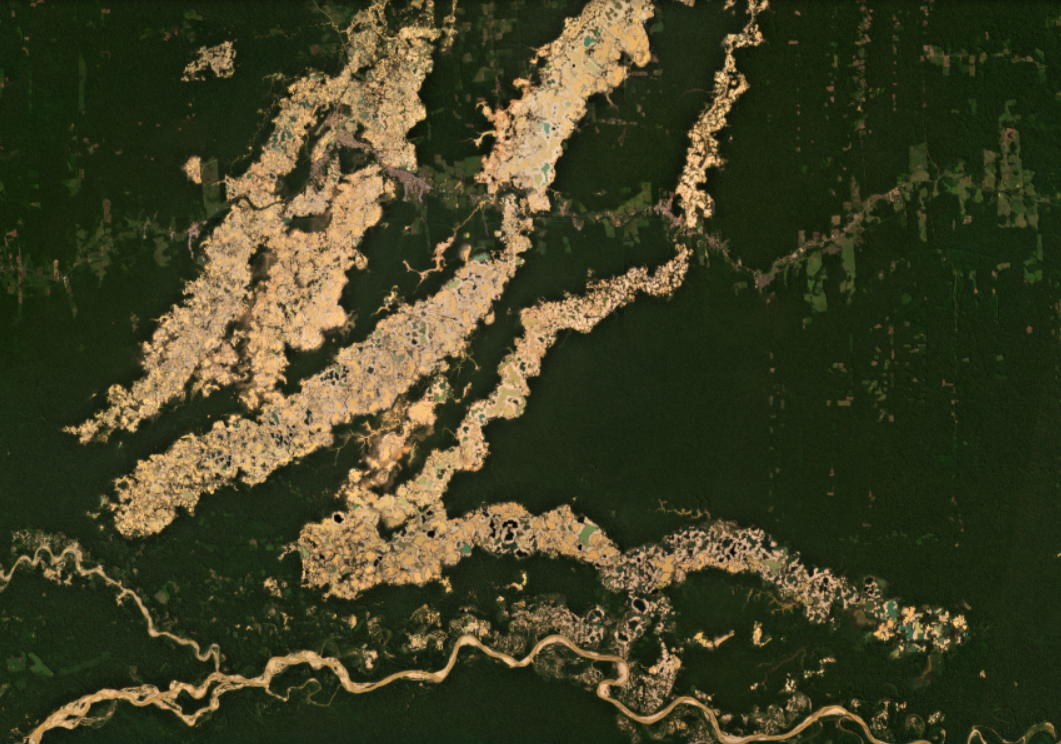
Deforestation hotspots were concentrated in the gold mining frontier in the southern Amazon and throughout the central Amazon. The very high hotspot in central Peru corresponds to the latest deforestation by Mennonite colonies (see MAAP #222 for context).
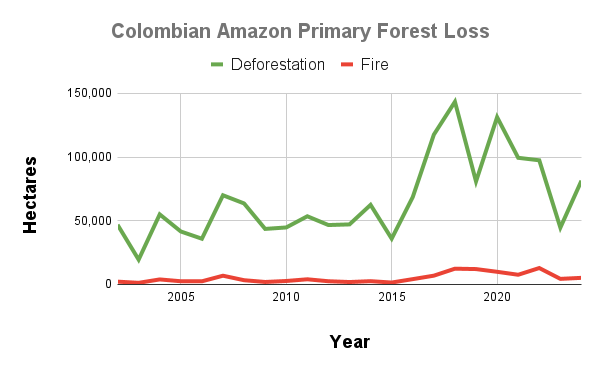
Colombian Amazon
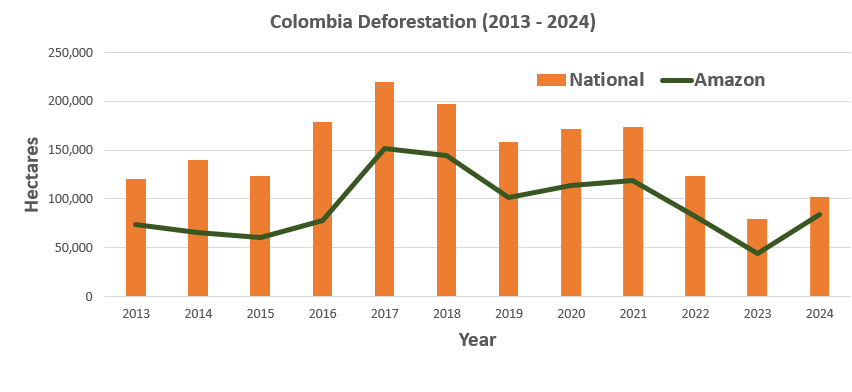
In 2024, the Colombian Amazon lost 81,396 hectares (201,129 acres) of primary forest to deforestation. This total marked a striking 82.5% increase from the recent low recorded in 2023. It was the 7th highest on record, continuing the trend of elevated forest loss since the FARC peace agreement in 2016 (all top seven deforestation annual totals have occurred since 2016).
Major fires were less of an issue in the Colombian Amazon, but did directly impact an additional 5,184 hectares (8th highest on record).
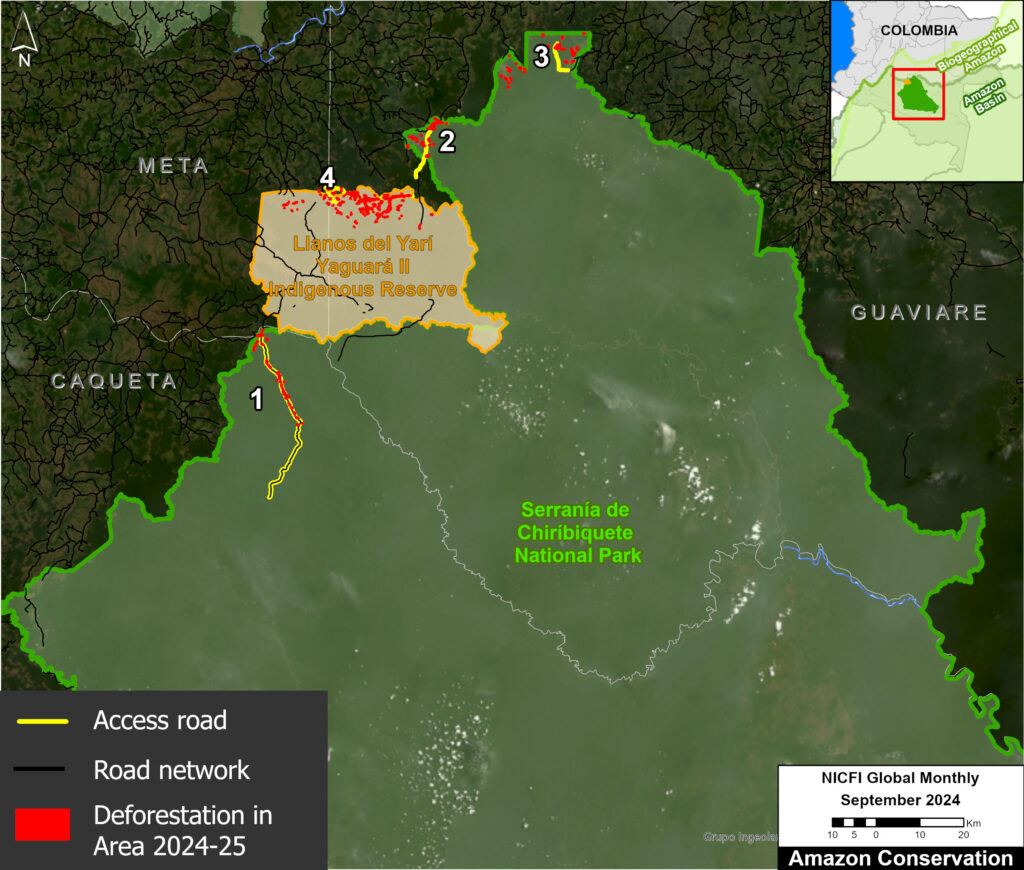
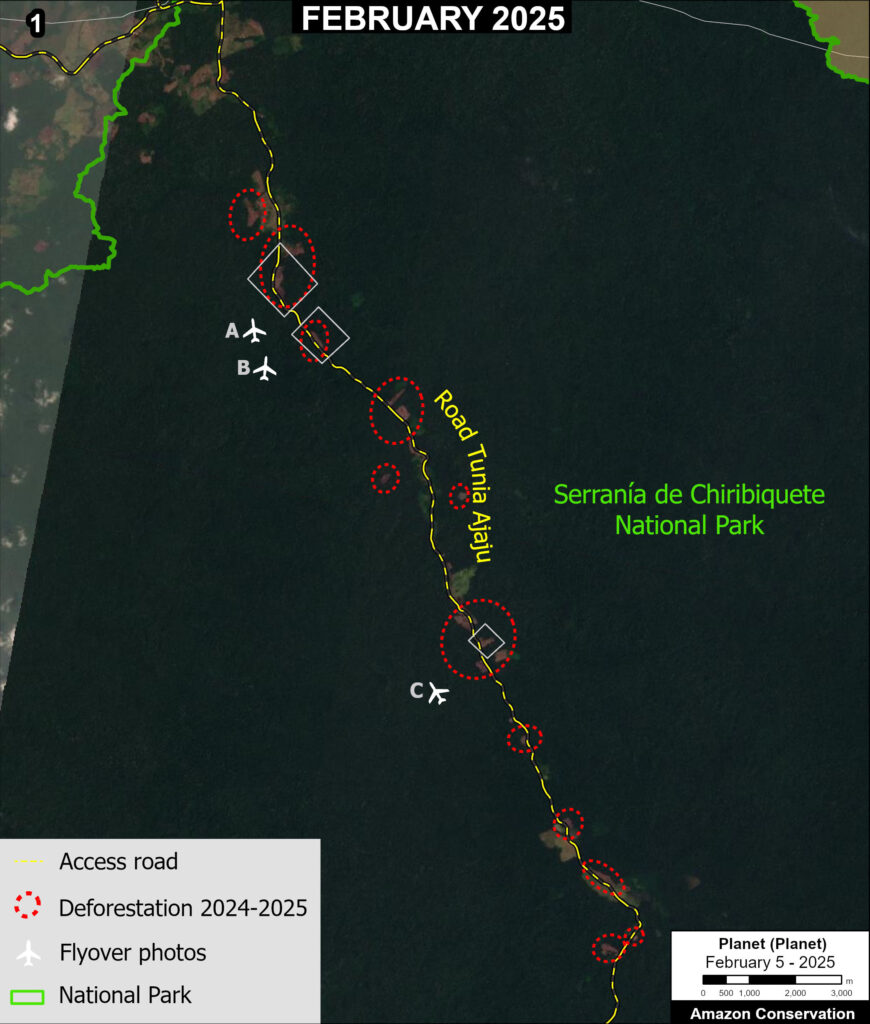
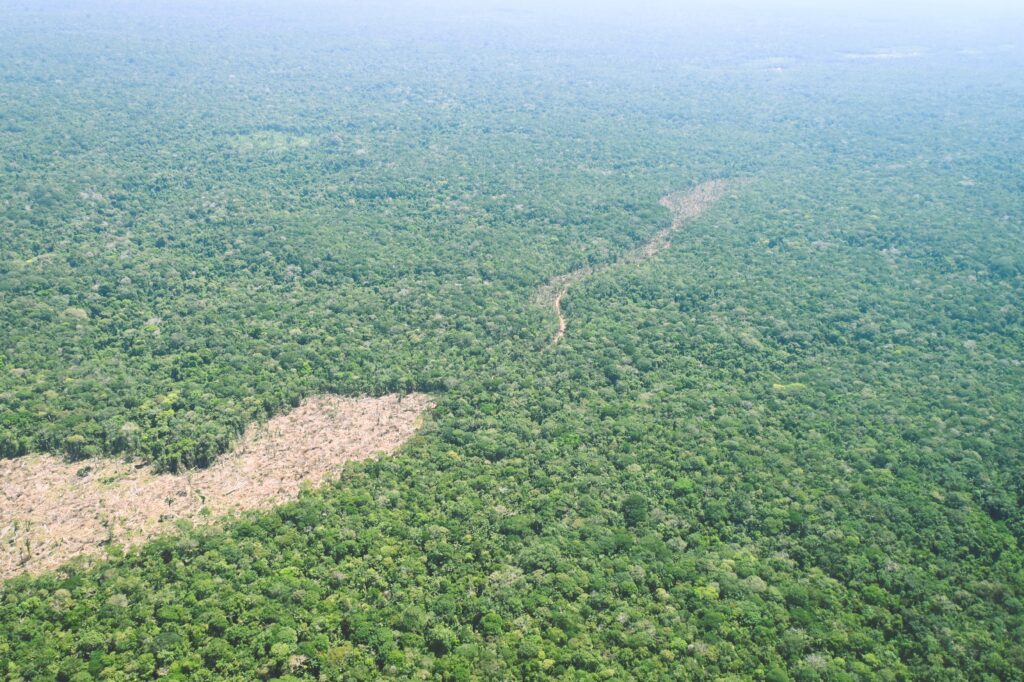
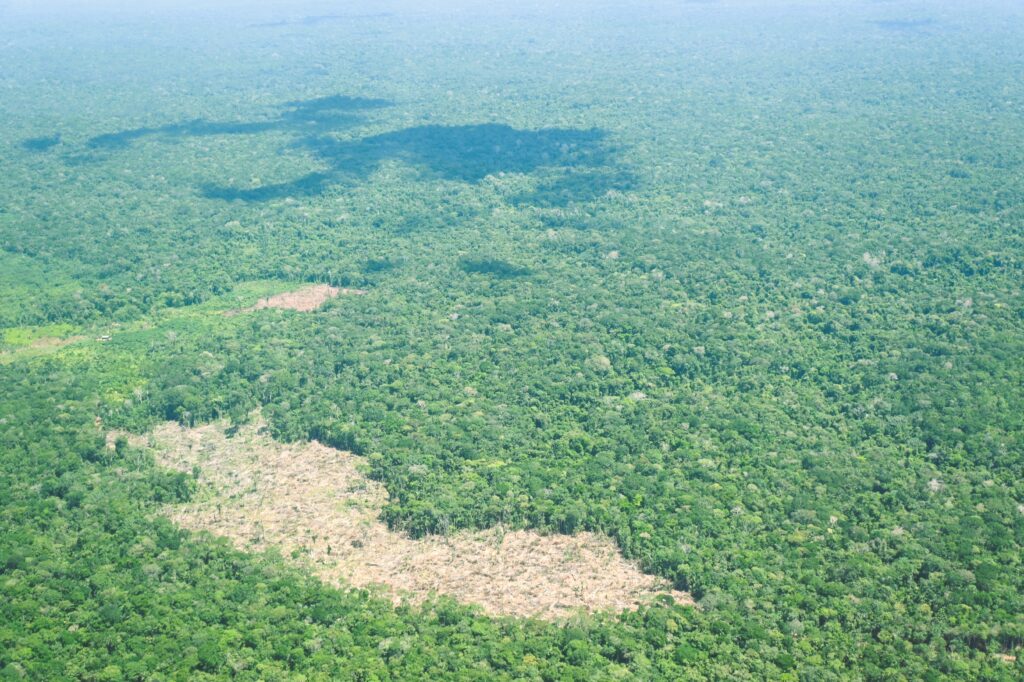
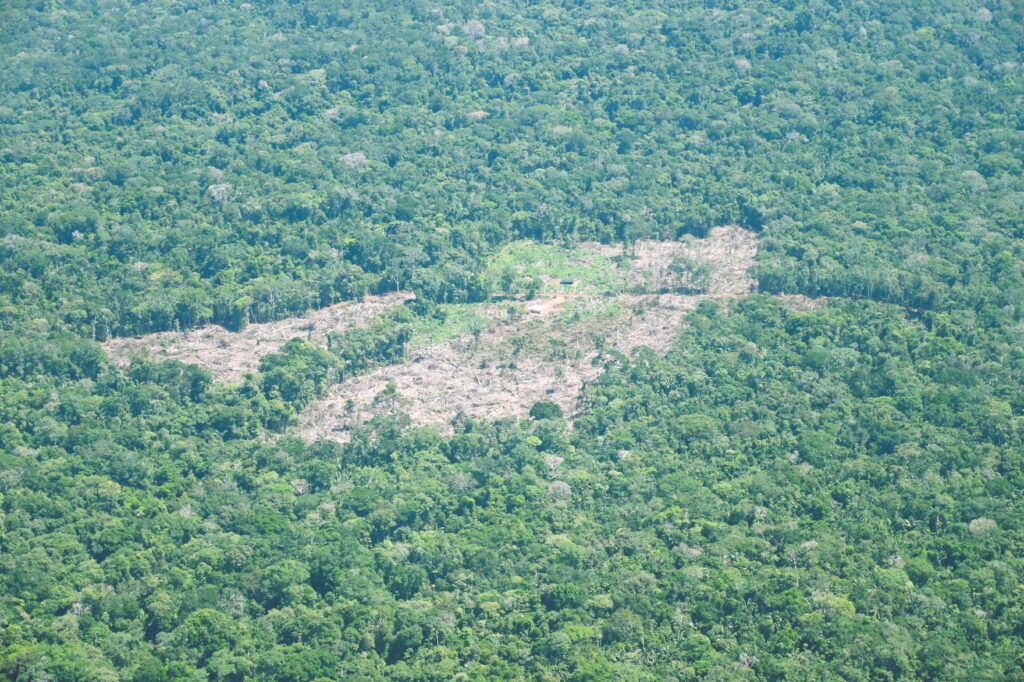
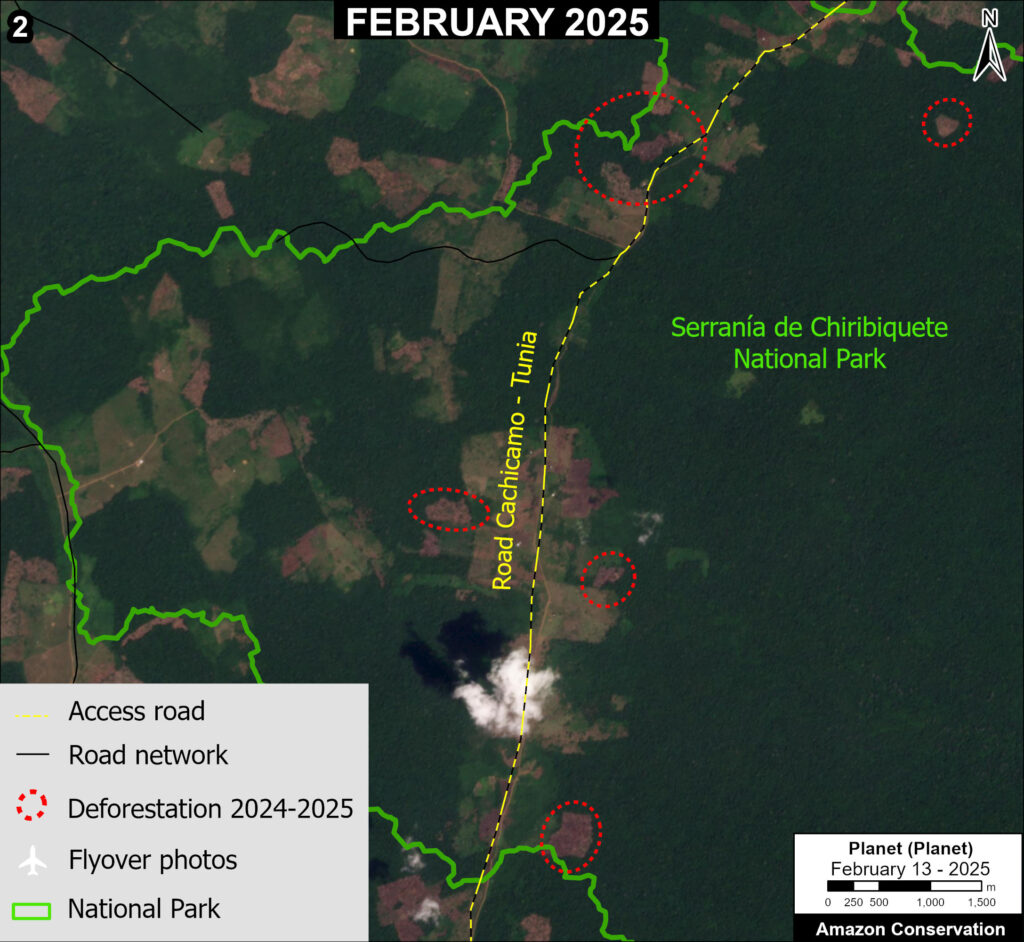
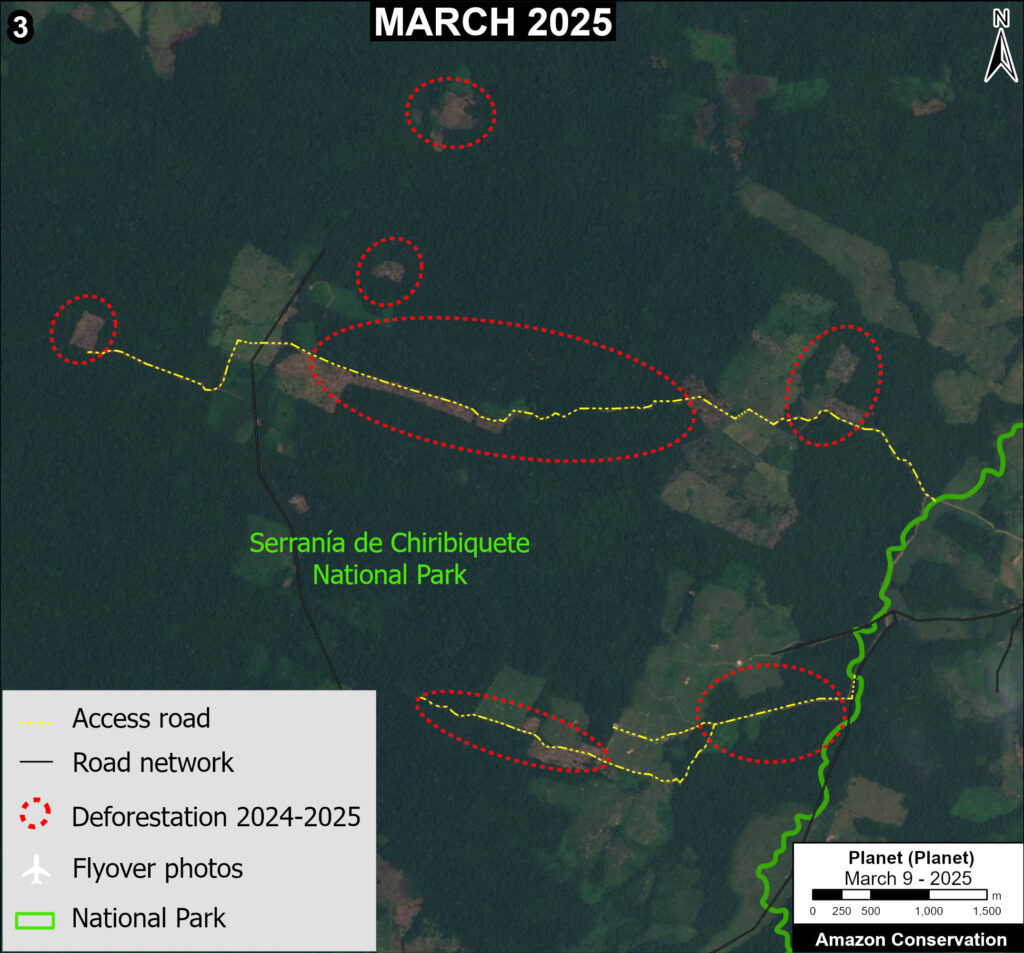
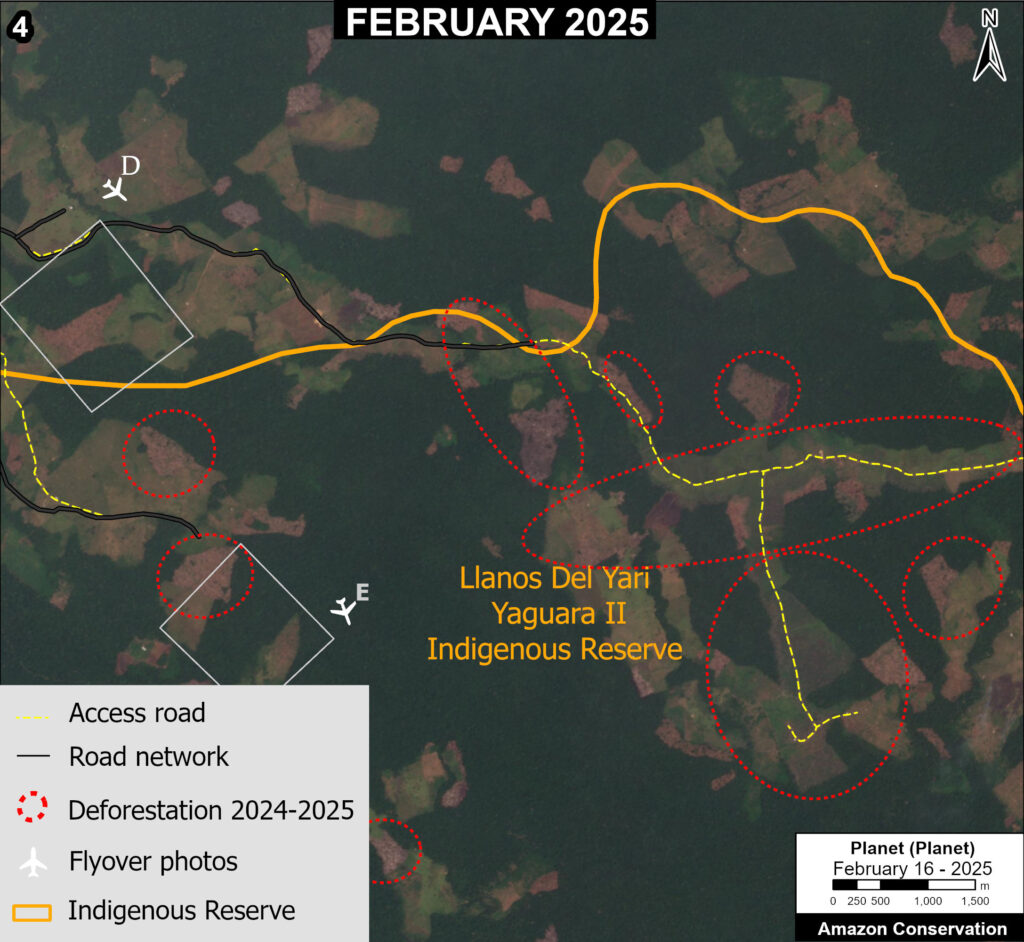
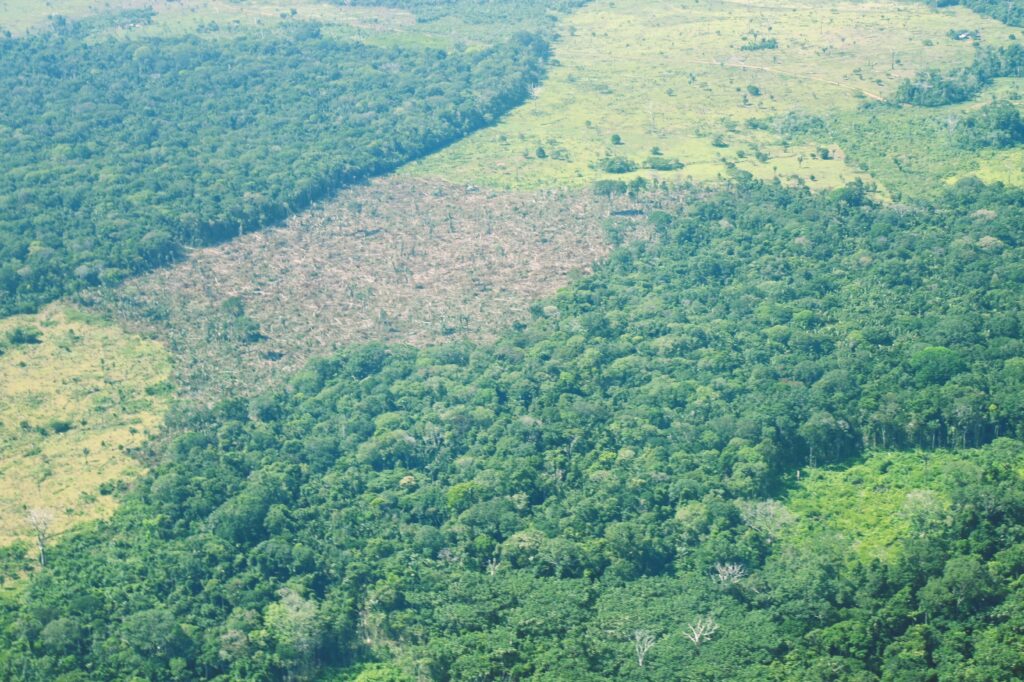
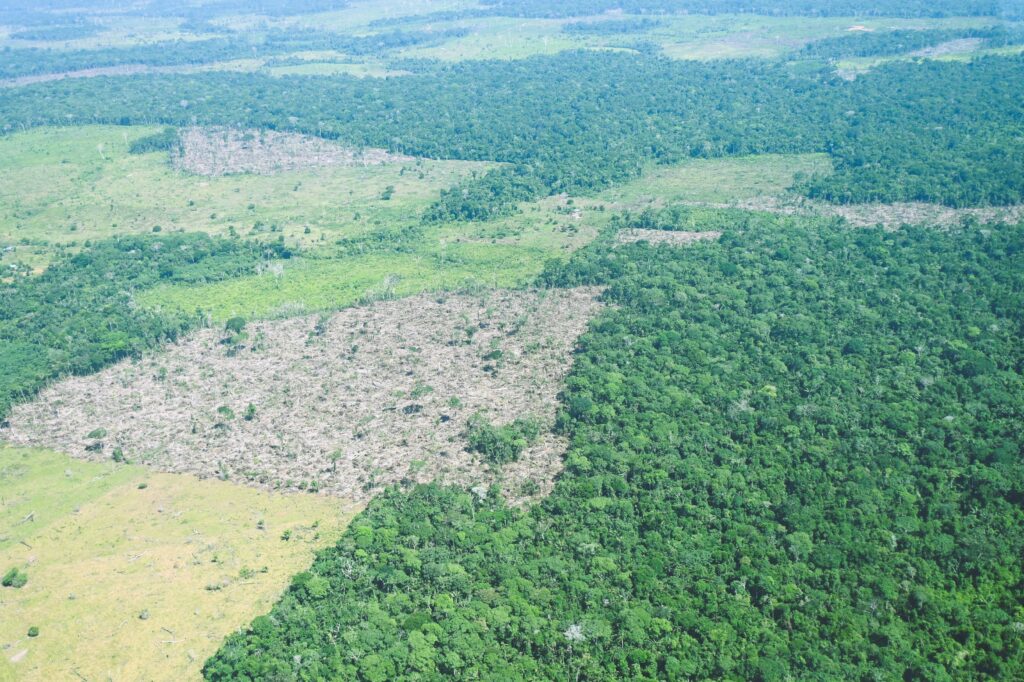
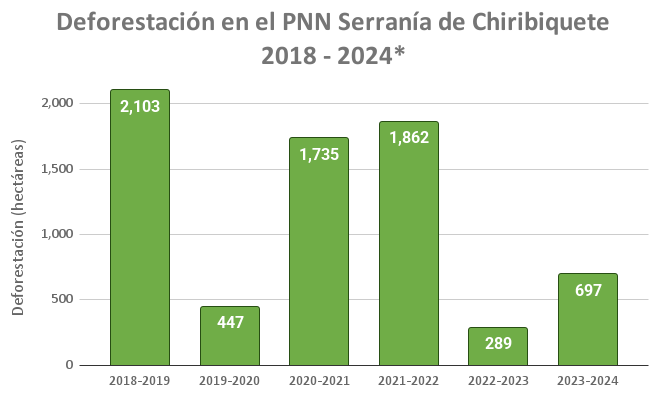
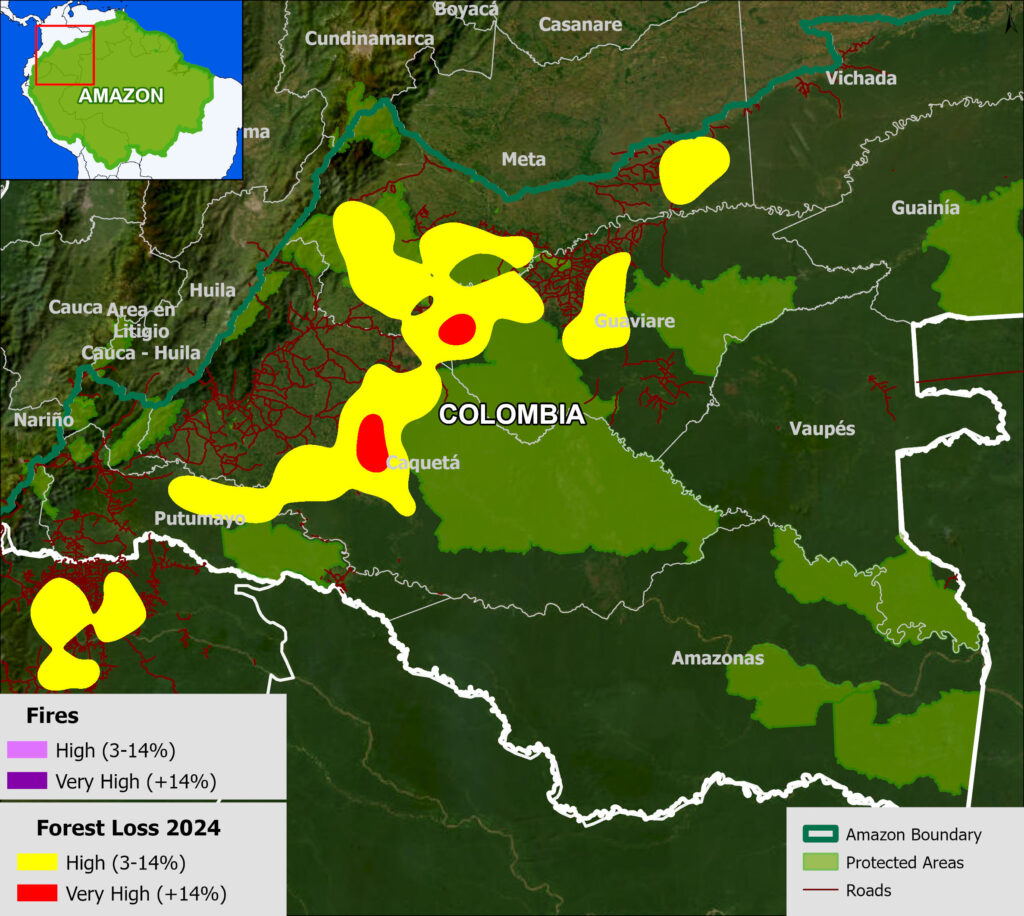
As described in previous reports (see MAAP #120), Figure 5 shows that there continues to be an “arc of deforestation” in the northwest Colombian Amazon (Caqueta, Meta, Putumayo and Guaviare departments). Most notably, there is a pair of very high deforestation areas surrounding Chiribiquete National Park, and high deforestation areas within Tinigua and Macarena National Parks.
This arc impacts numerous Protected Areas (particularly Tinigua and Chiribiquete National Parks) and Indigenous Reserves (particularly Yari-Yaguara II and Nukak Maku).
Rest of the Amazon
Other important highlights from around the Amazon include:
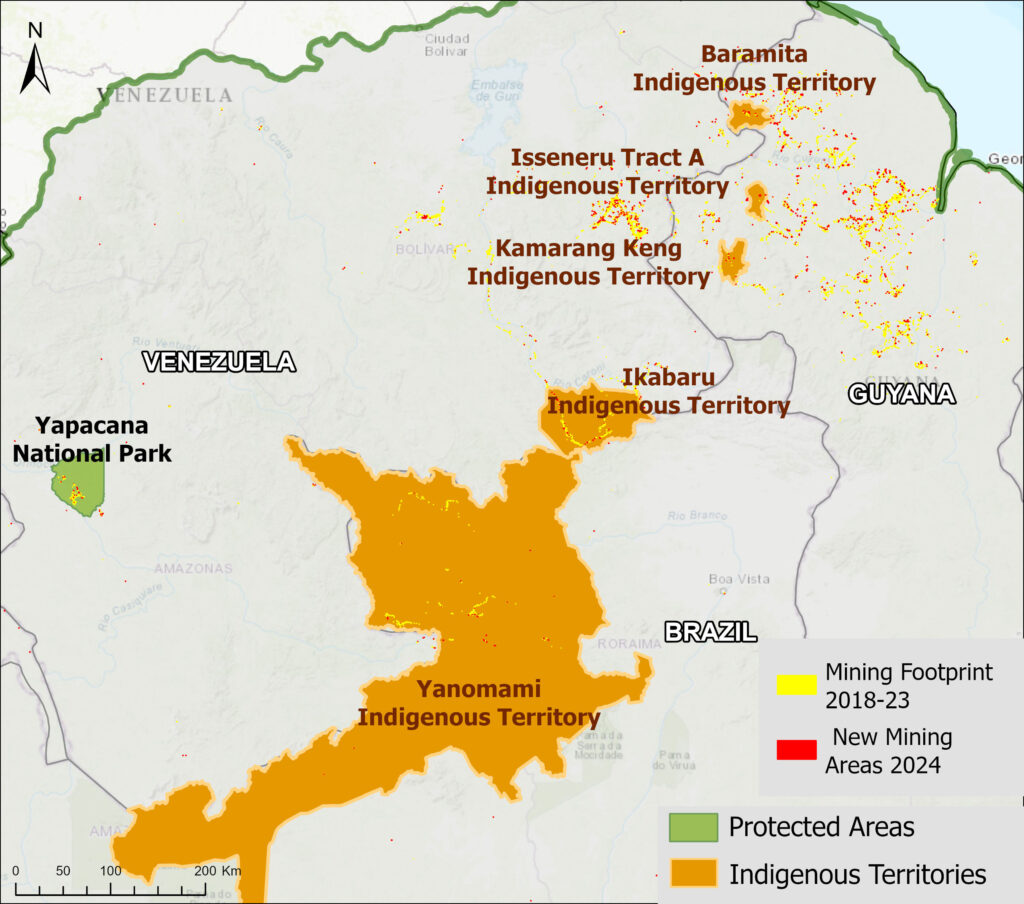
Deforestation and fire hotspots in northeast Guyana. In total, Guyana lost 25,858 hectares of primary forest to deforestation, and an additional 38,314 hectares to fires, both of which shattered previous records.
Deforestation in the Venezuelan Amazon was the highest on record (32,240 hectares), and additional fire impacts were the second highest (36,471 hectares).
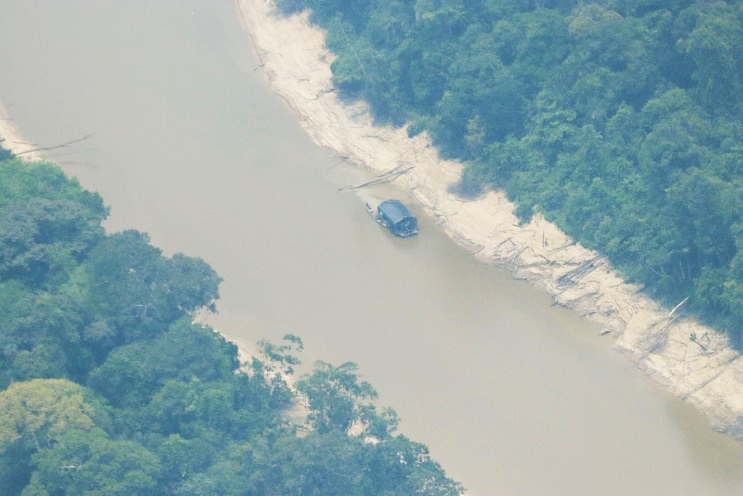
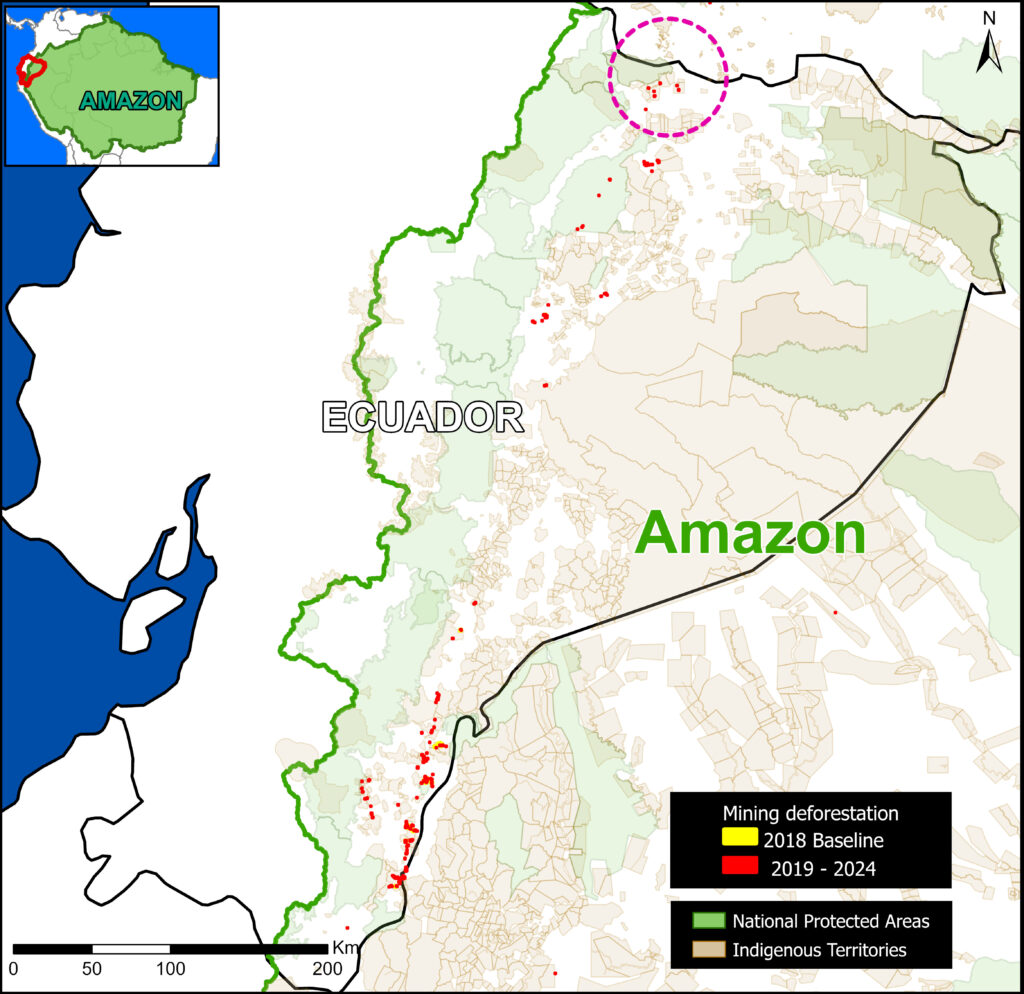
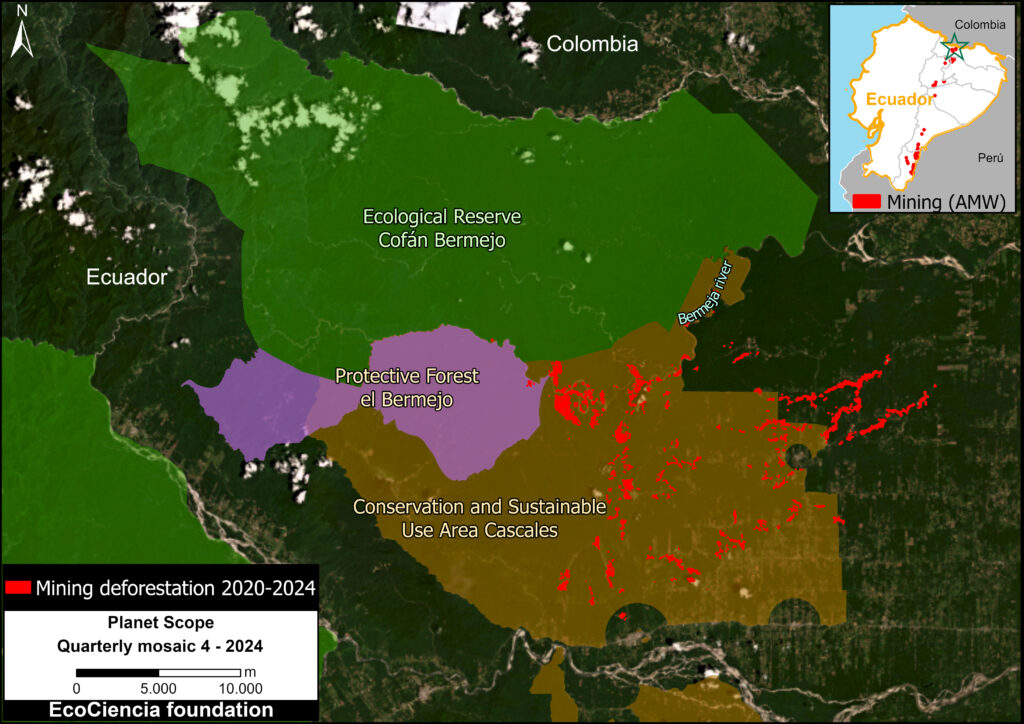
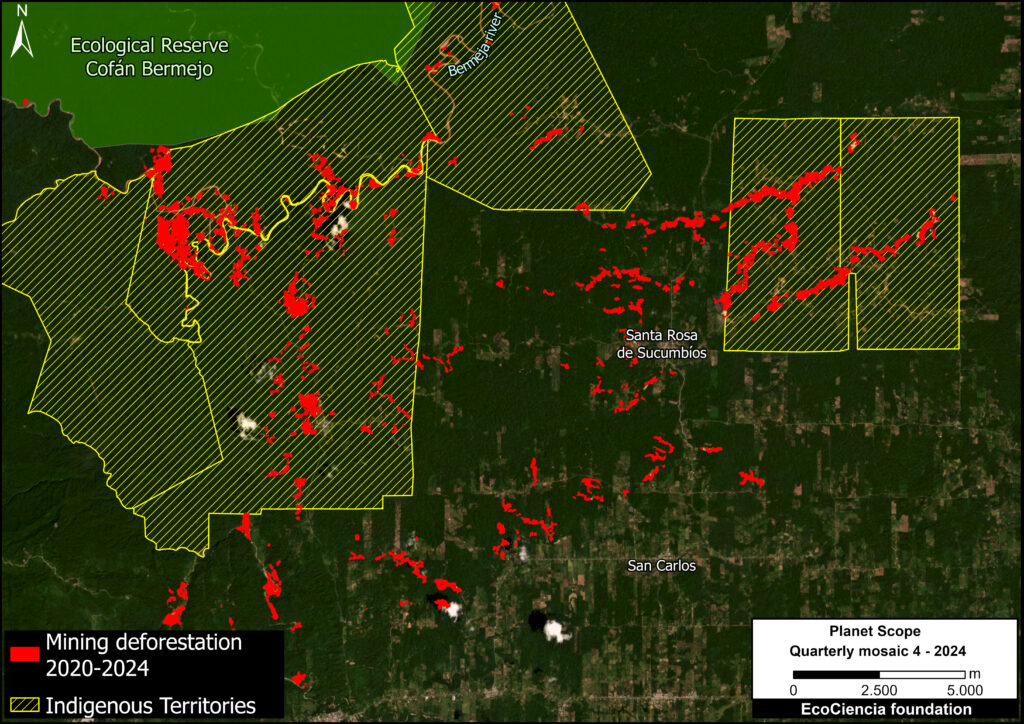
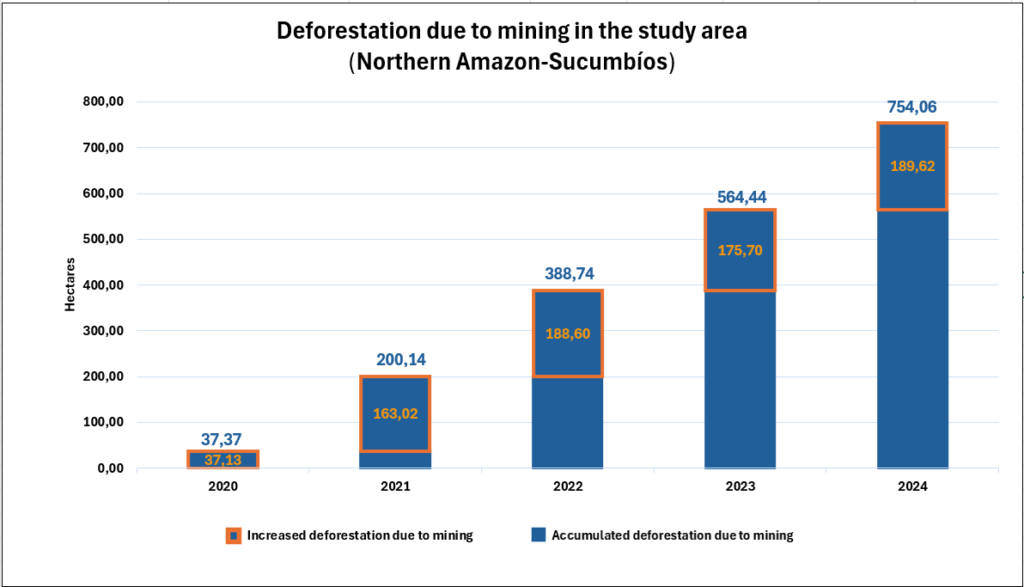
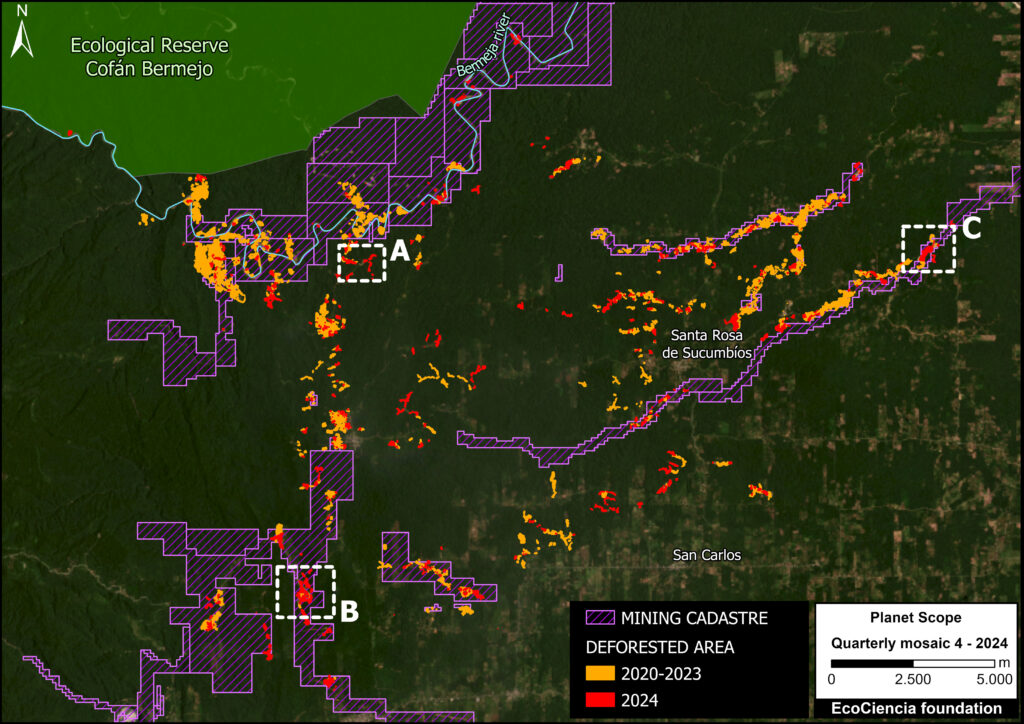
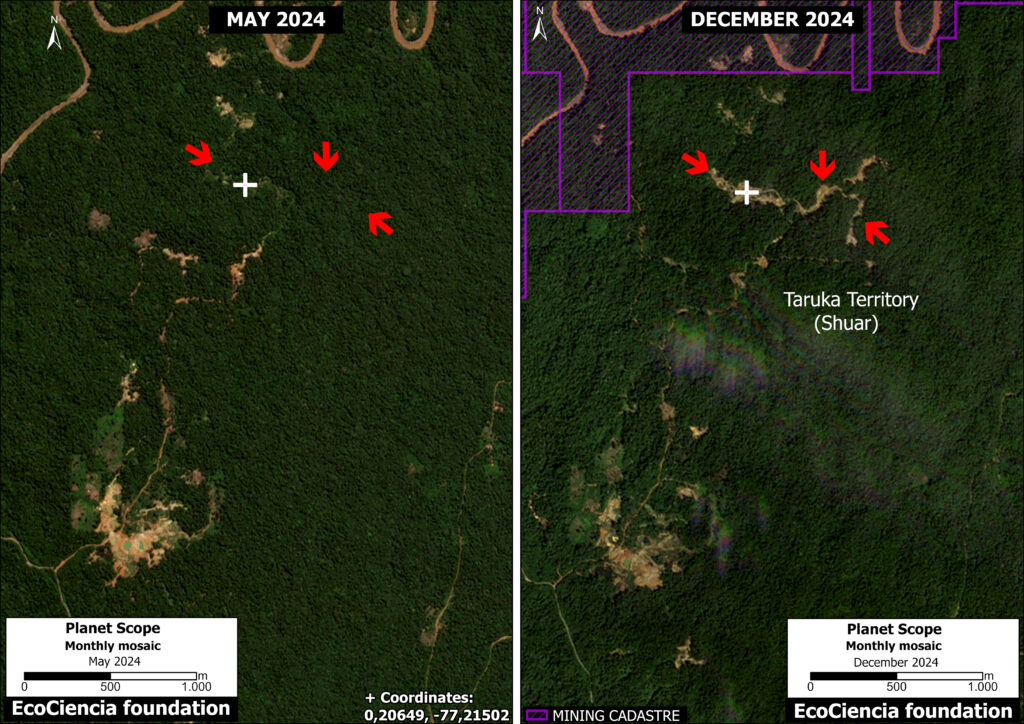
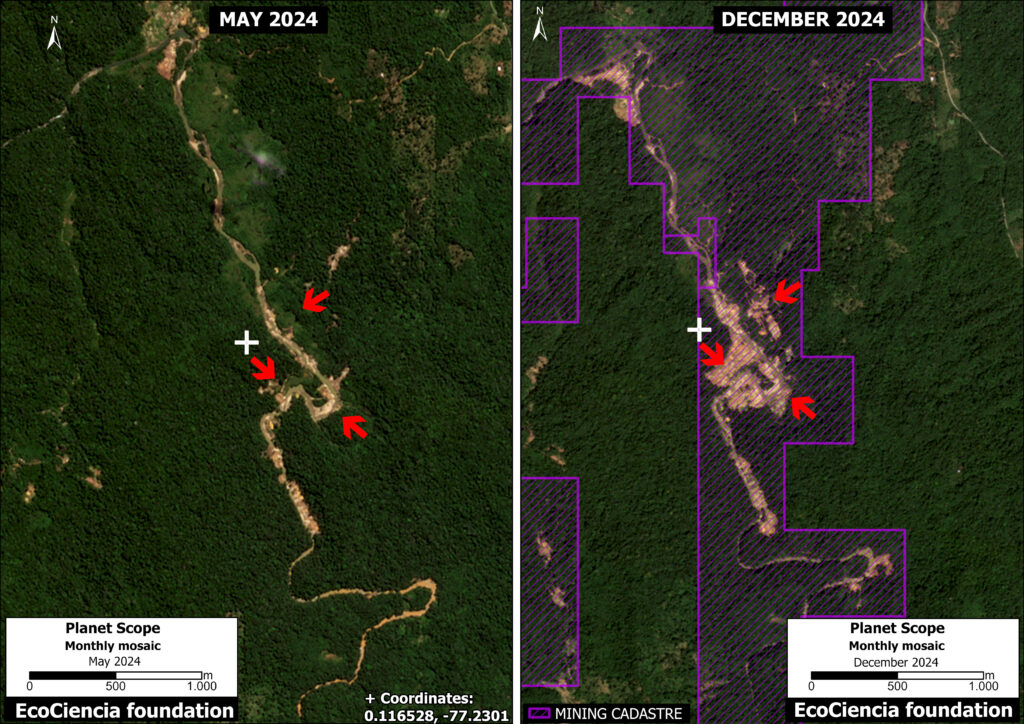
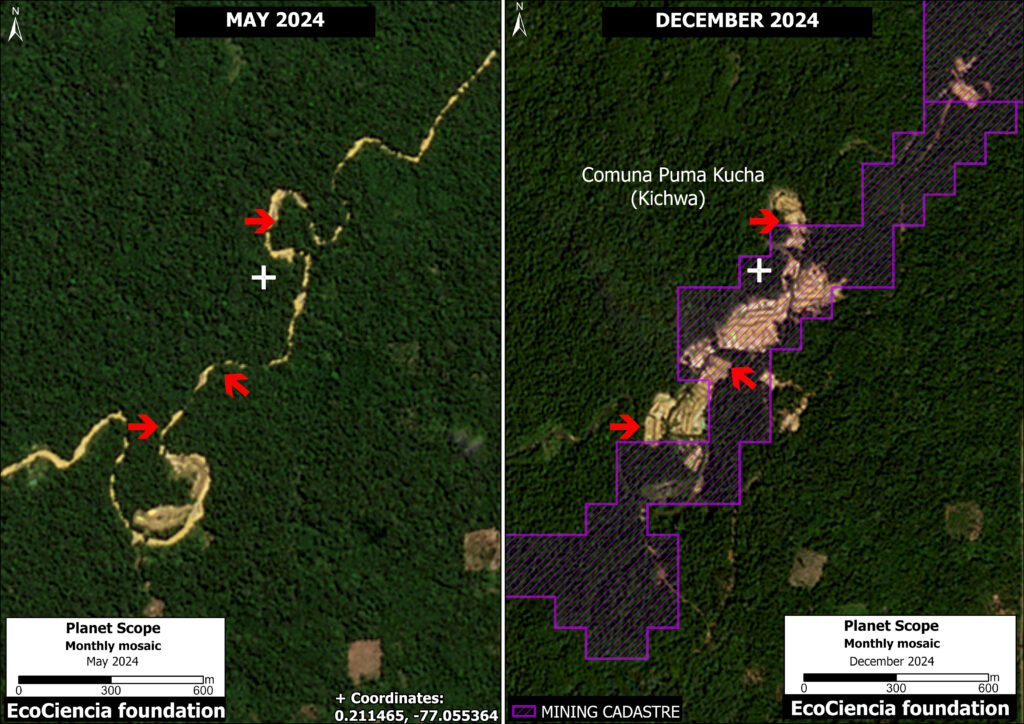
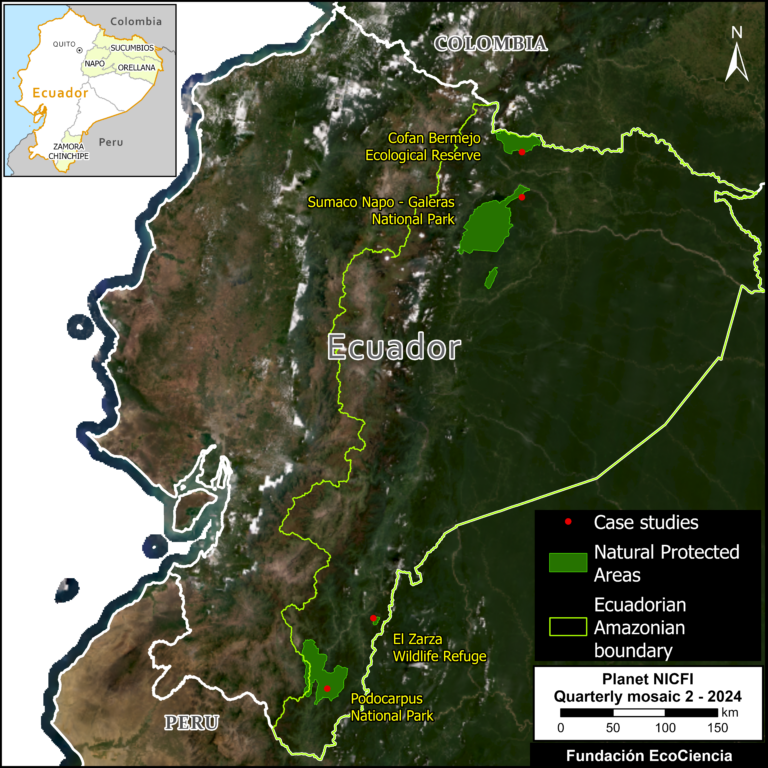
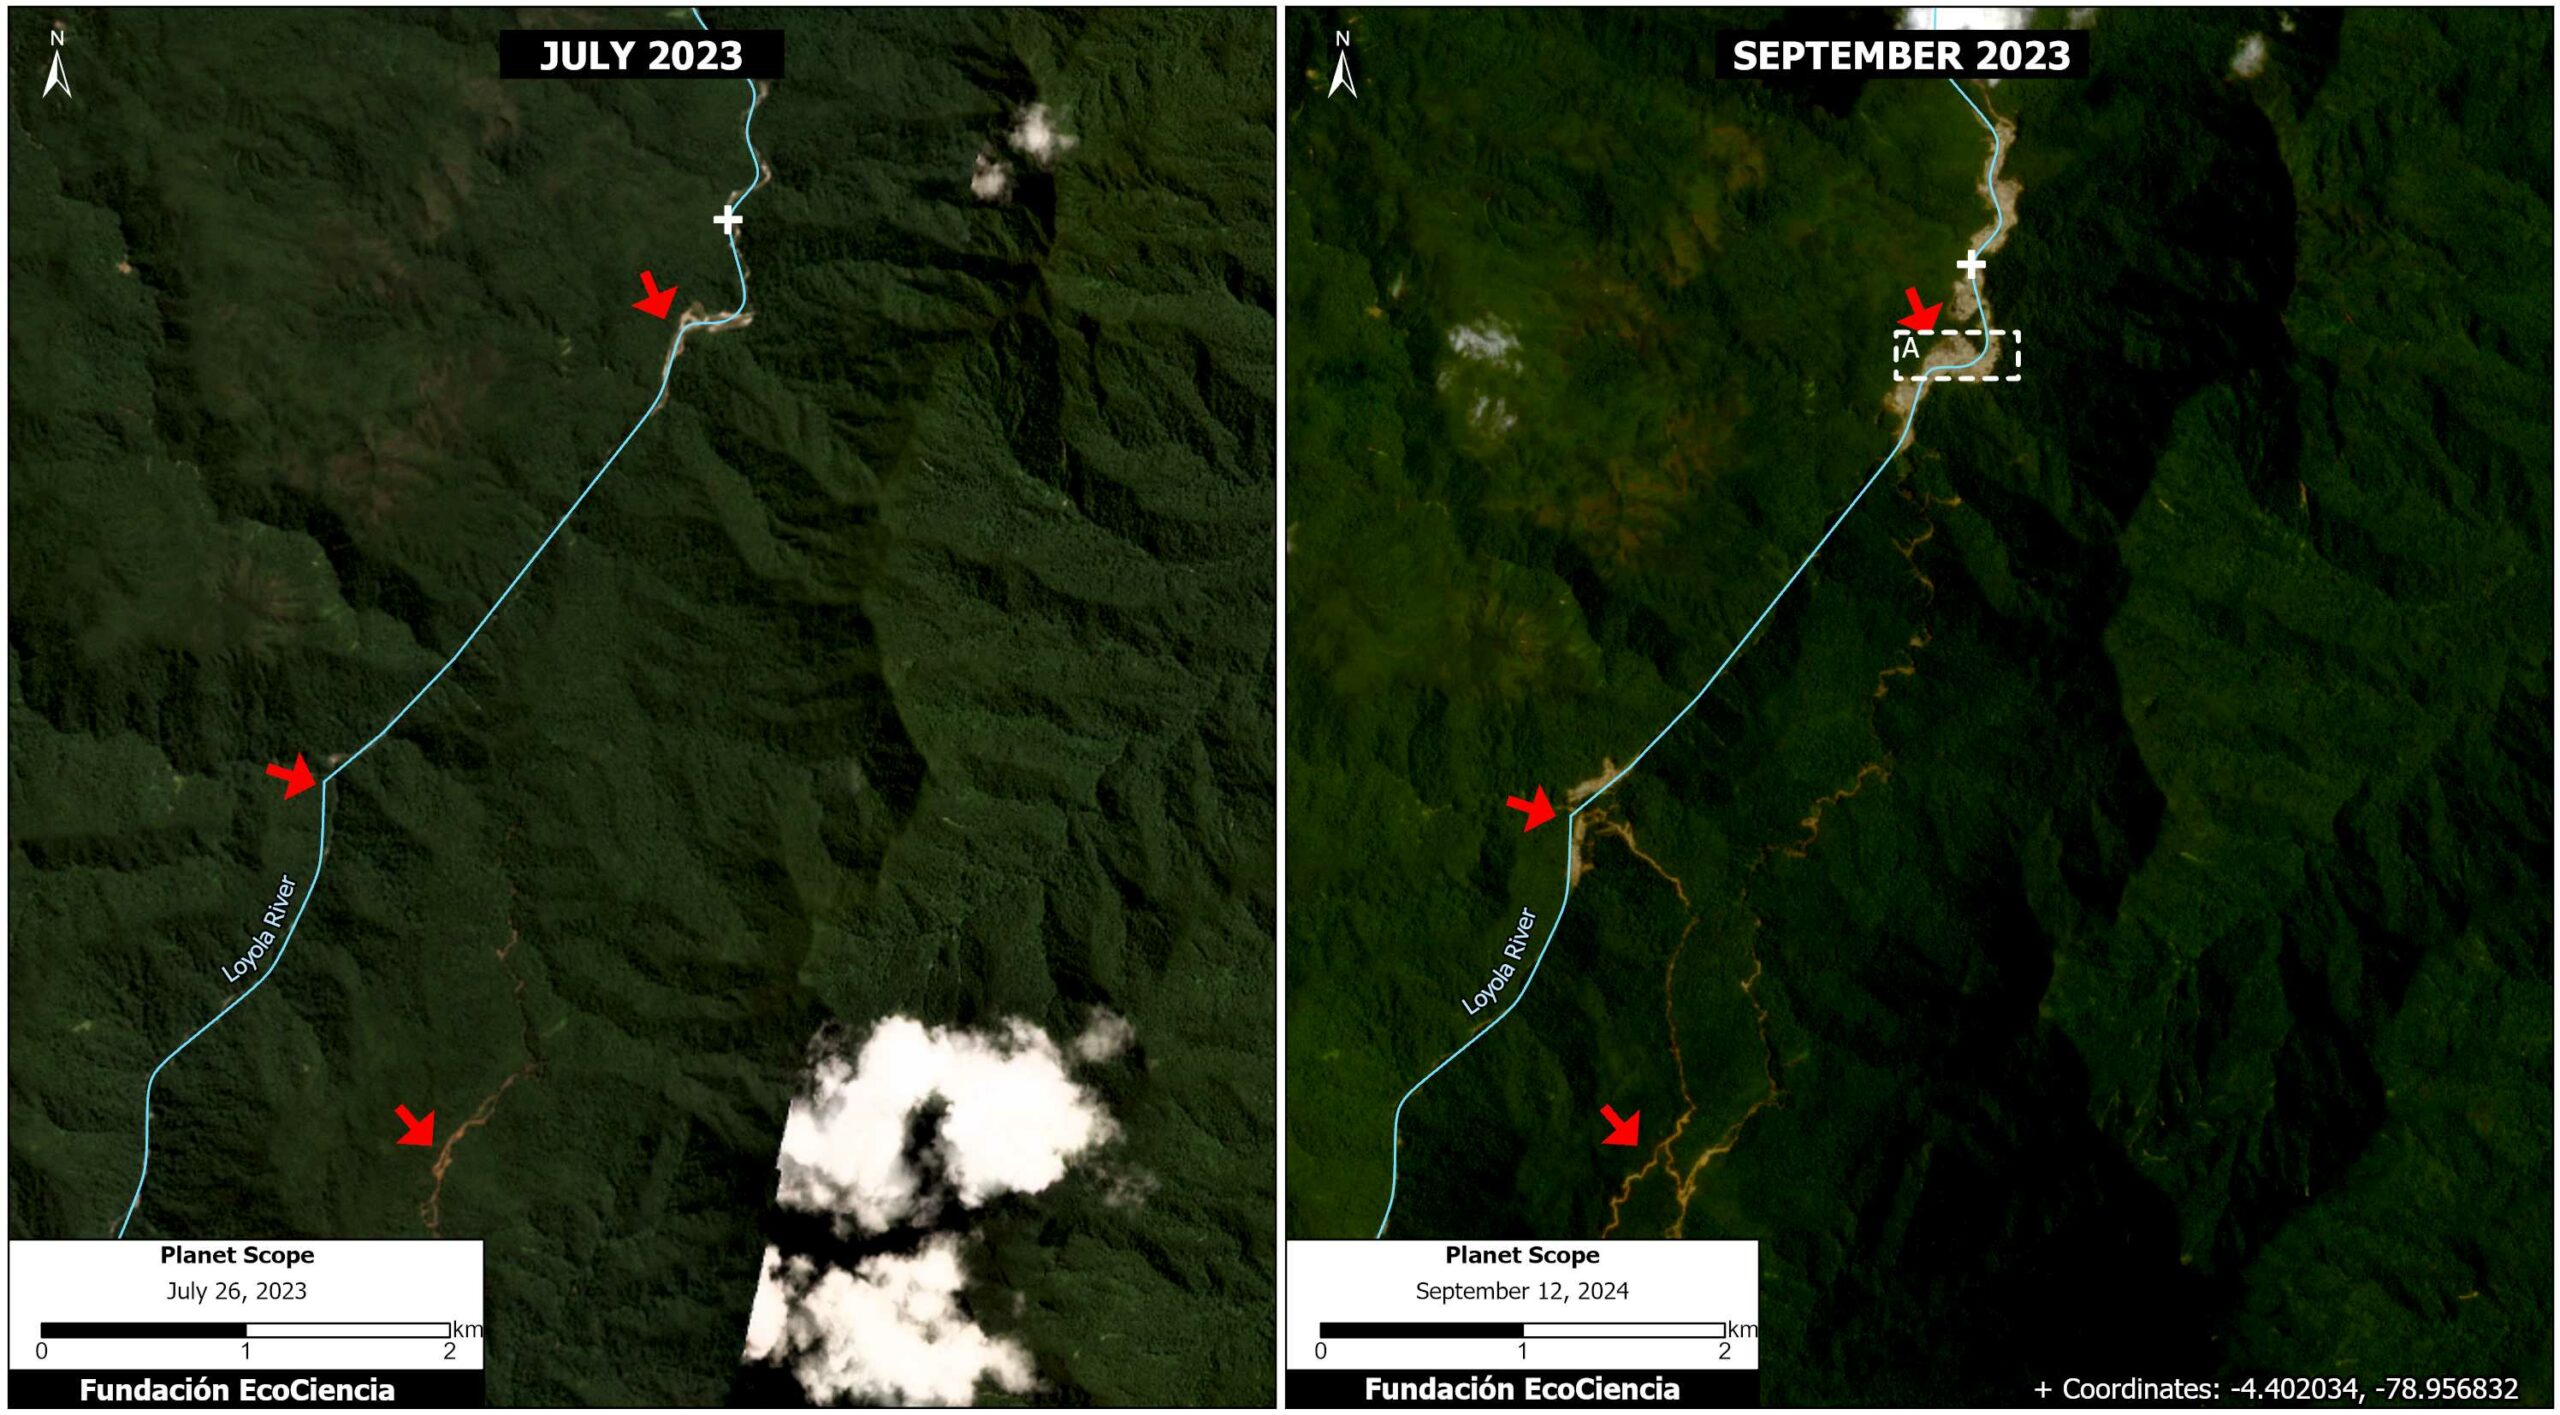
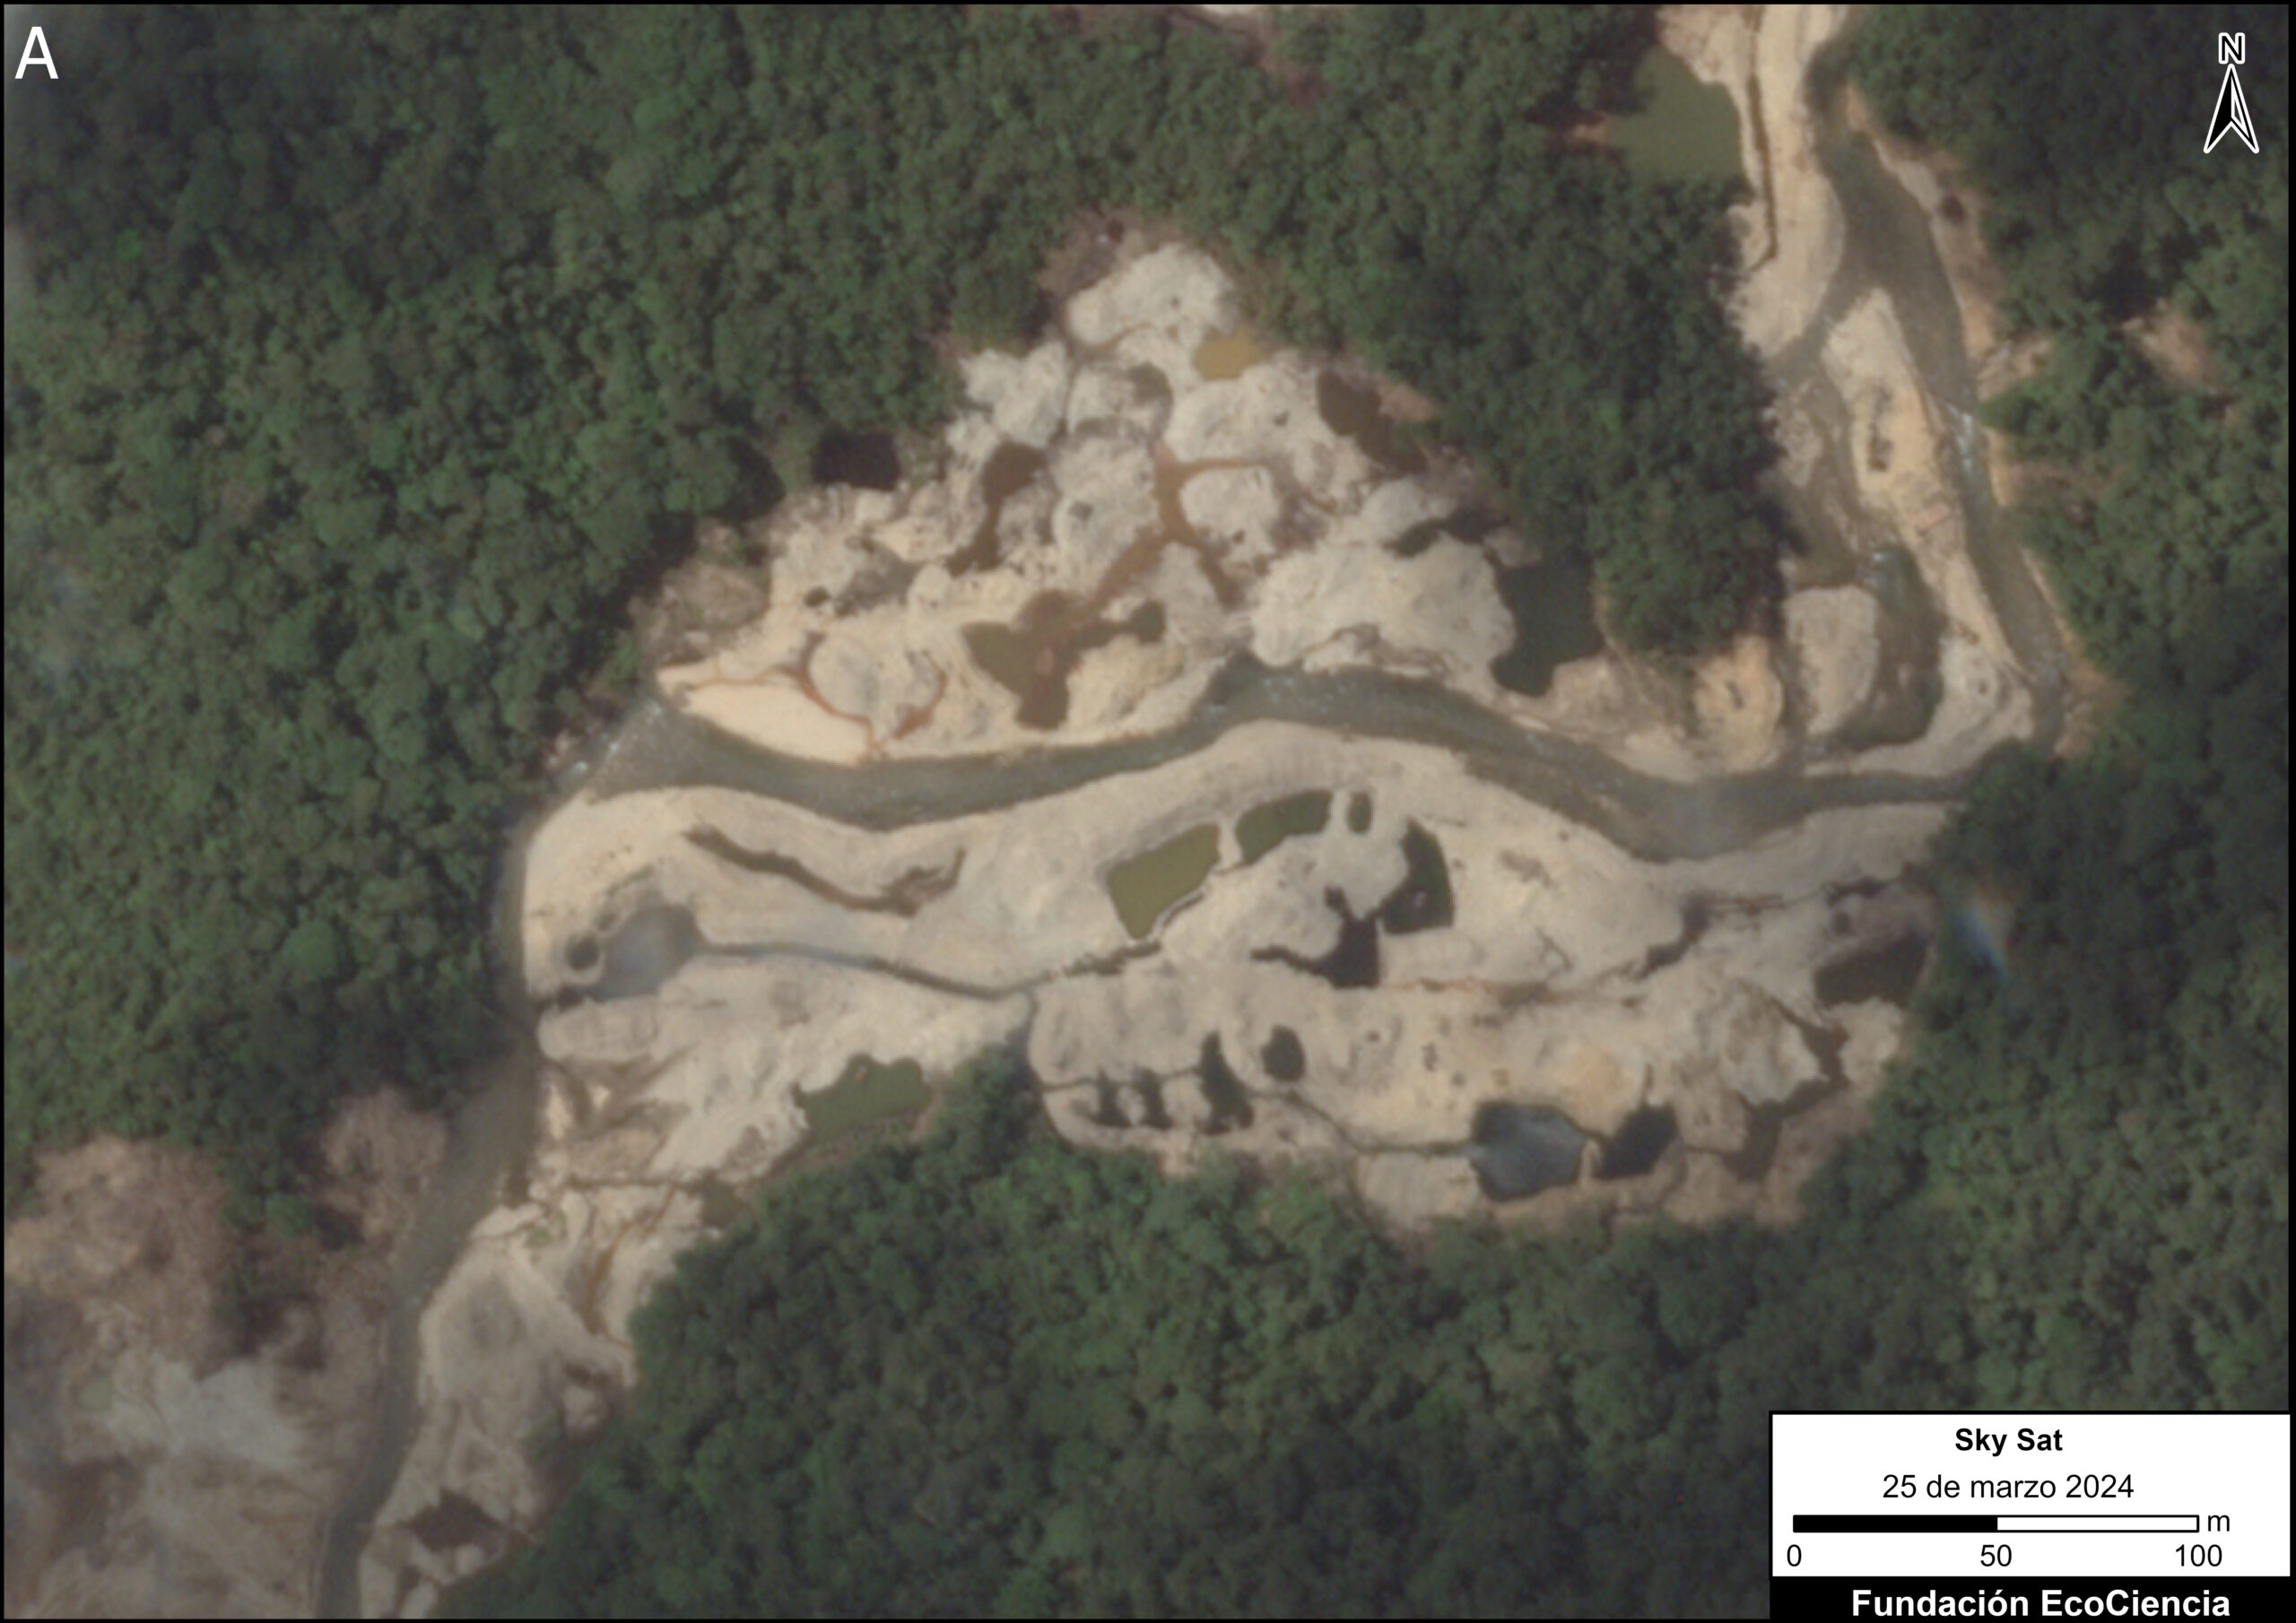
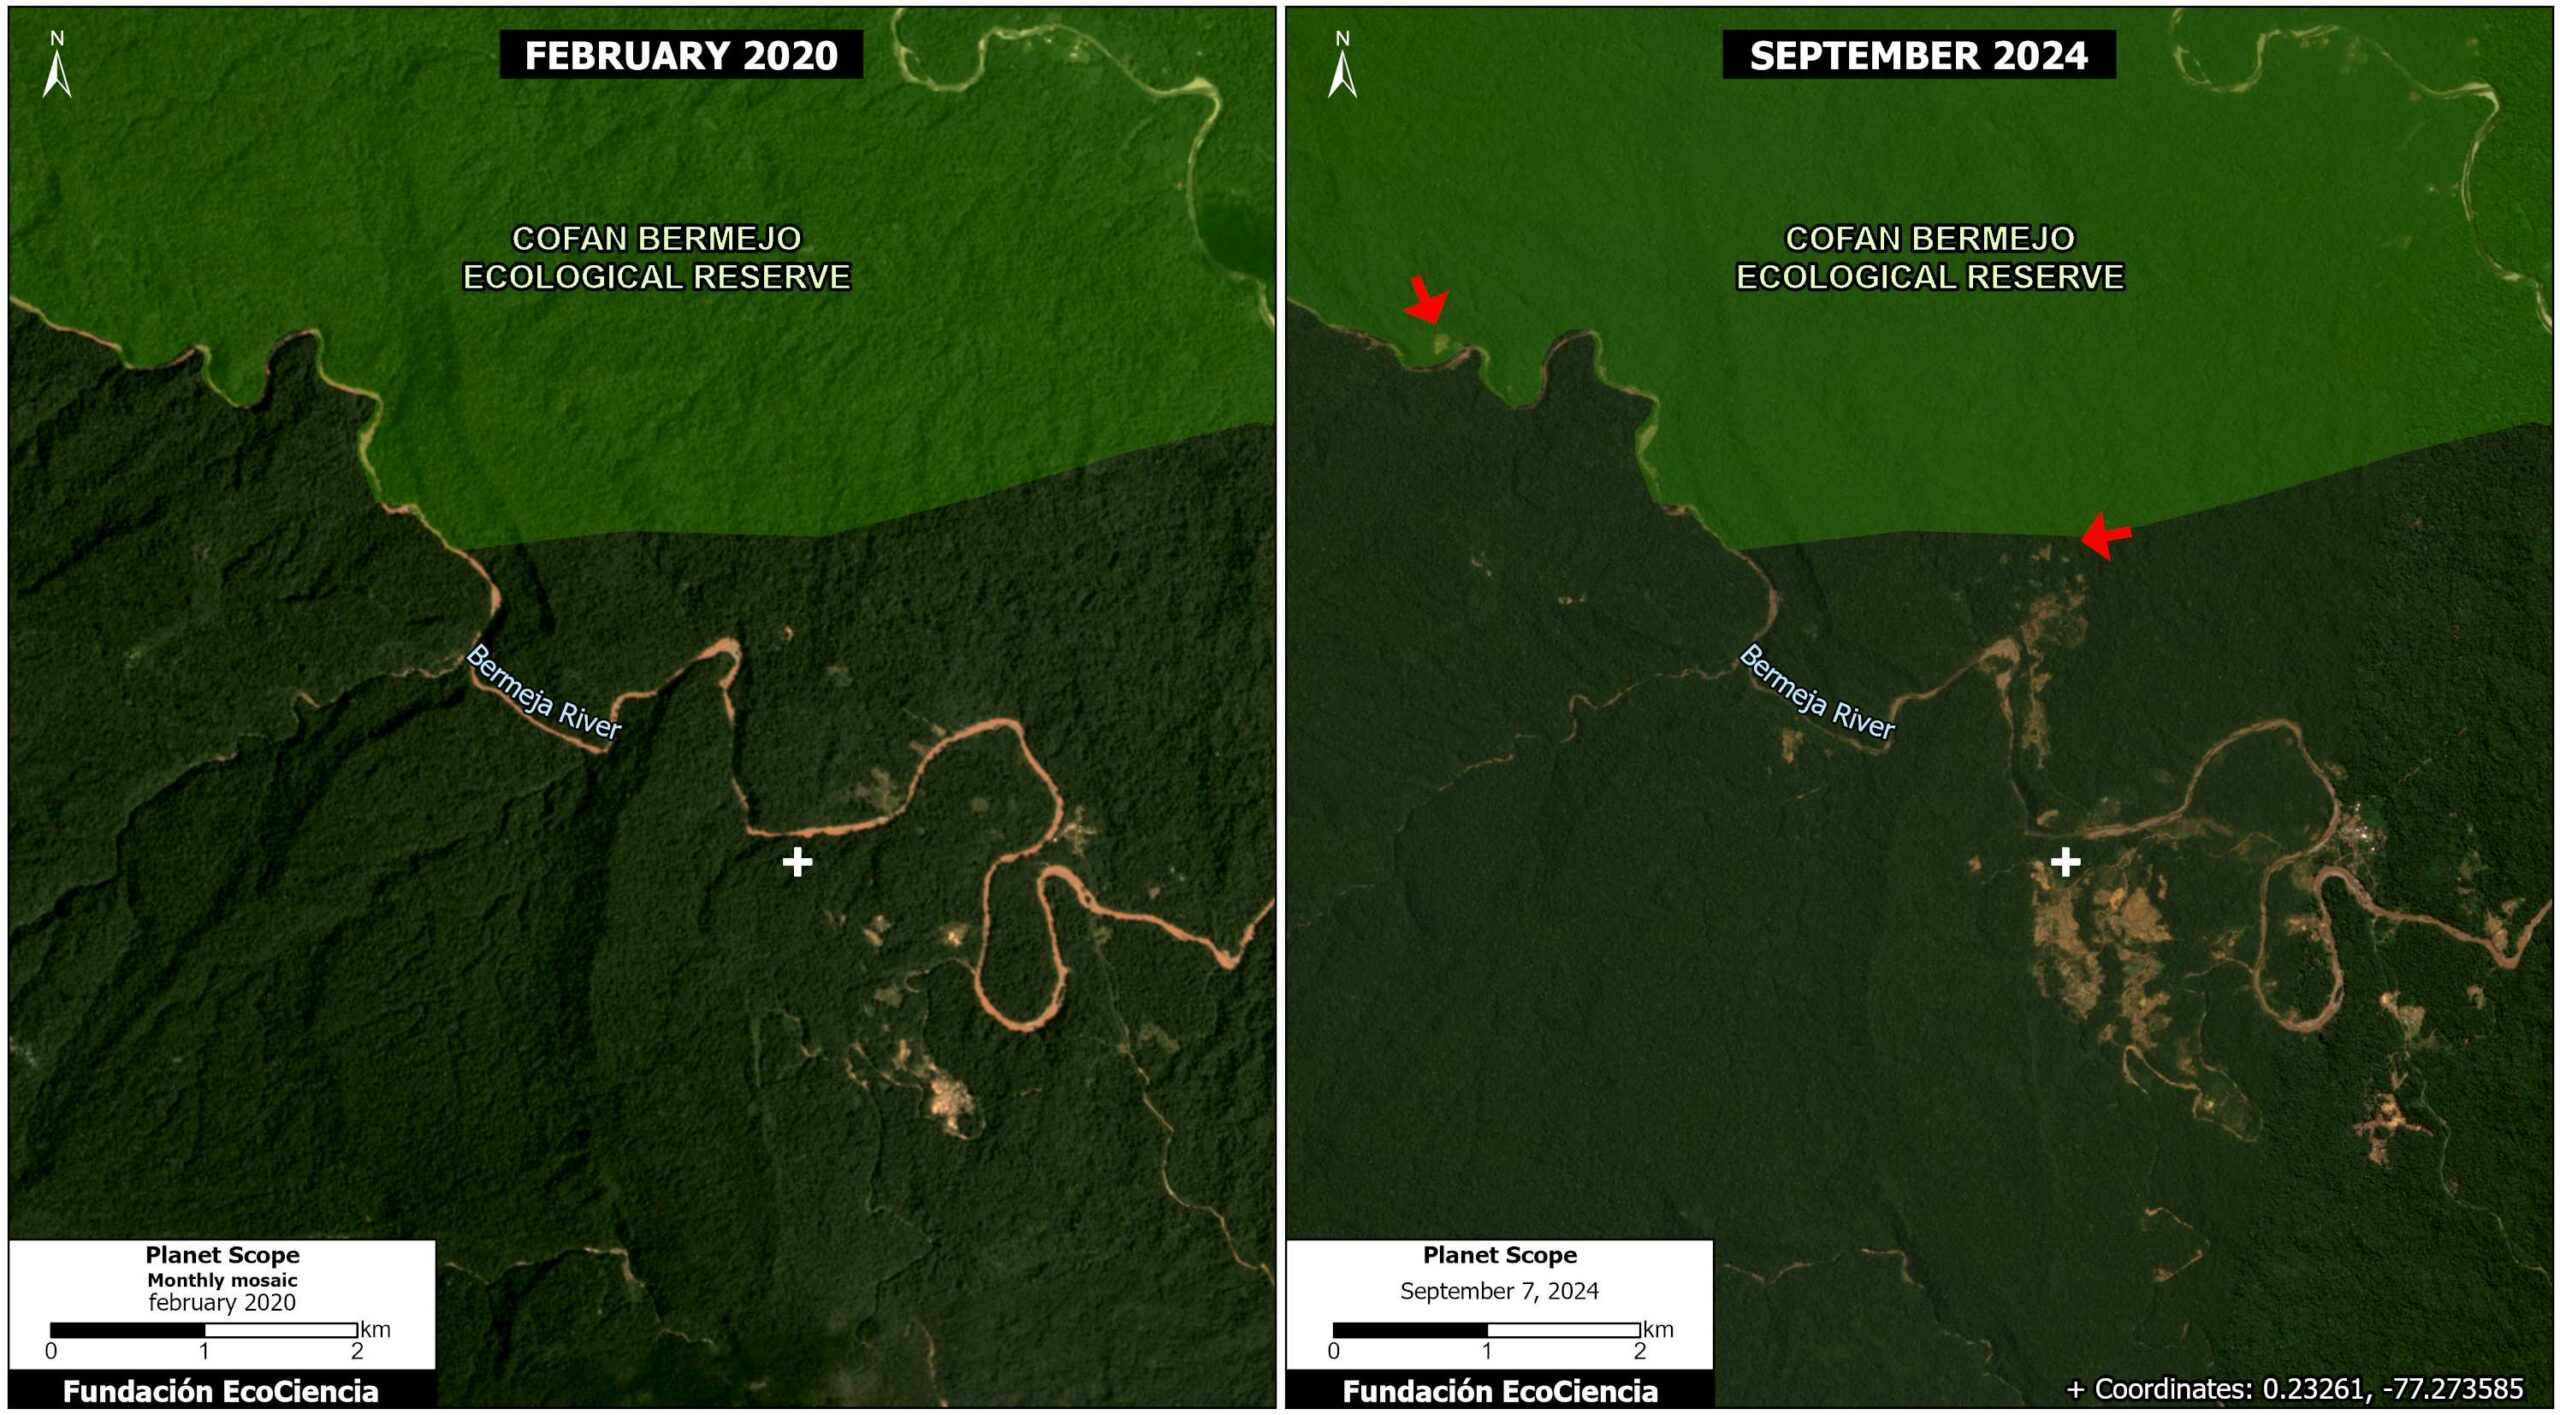
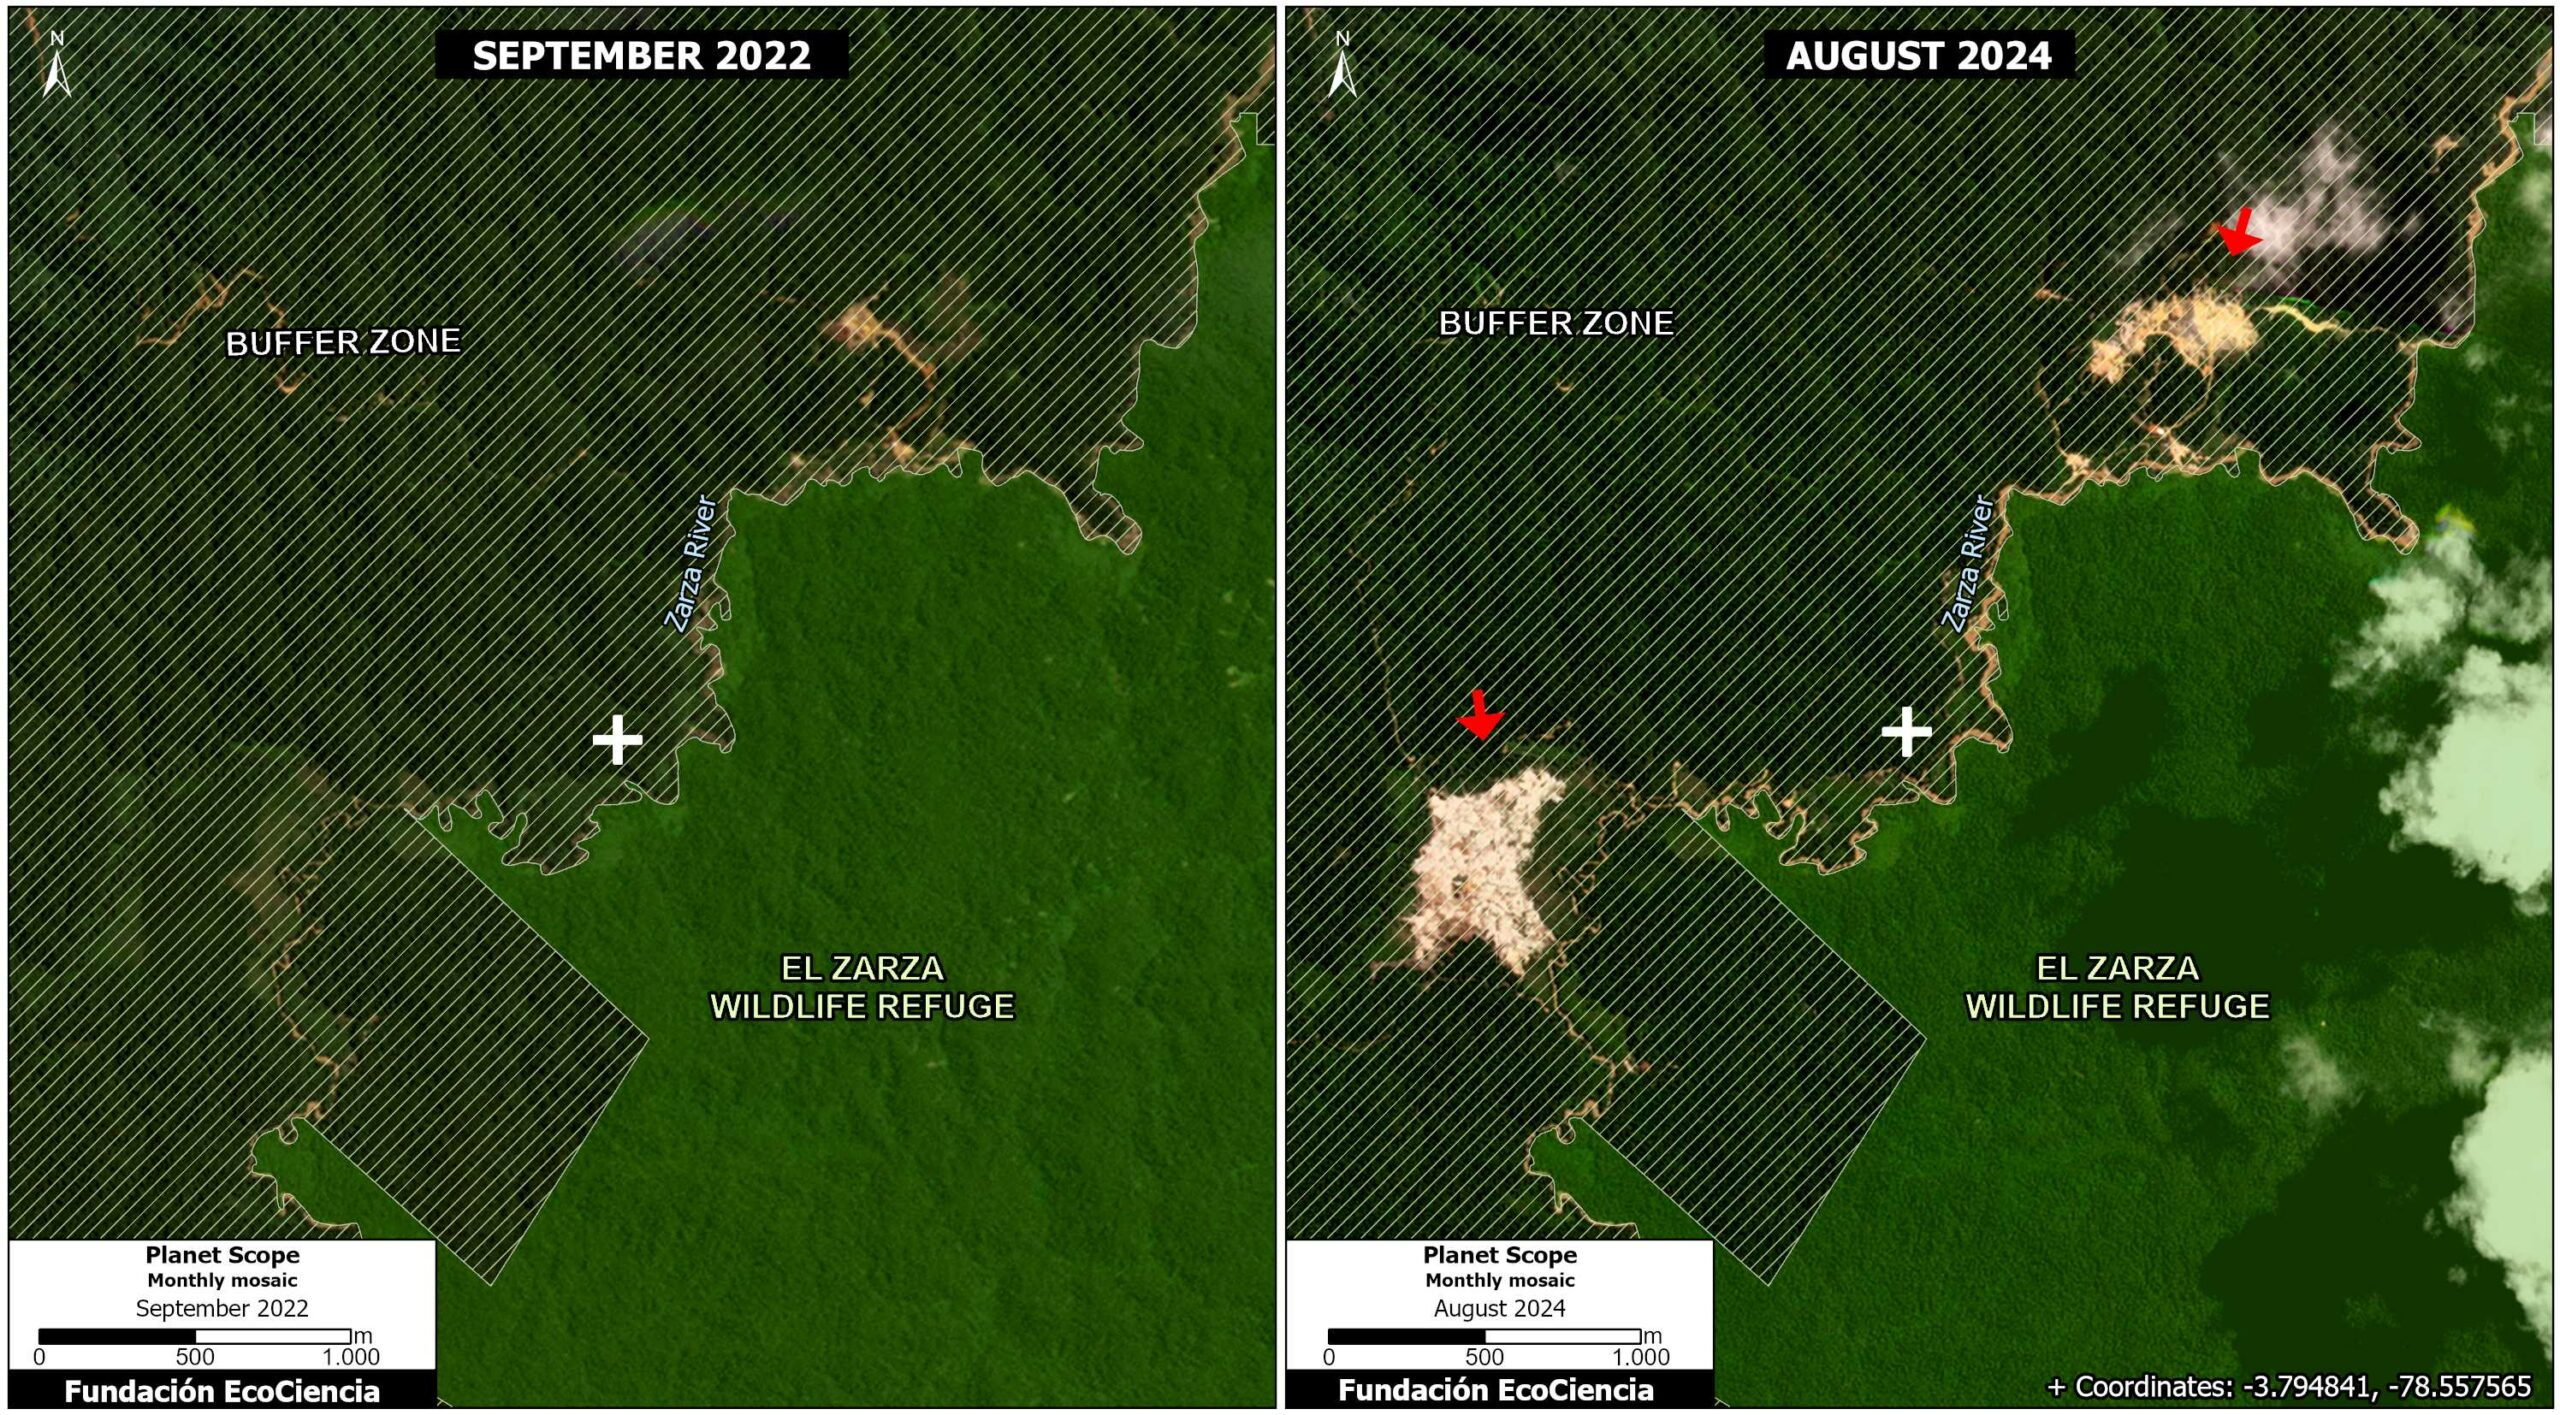
Deforestation in the Ecuadorian Amazon was the second highest on record (18,615 hectares), just behind 2022 (18,902 hectares). Deforestation hotspots were concentrated in the northern Amazon, areas characterized by high gold mining activity (MAAP #227, MAAP #221, MAAP #219). As in Colombia, major fires were less of an issue in the northwest Amazon overall, but did directly impact an additional 1,540 hectares (4th highest on record).
Fires were the highest on record in Suriname (7,926 ha) and French Guiana (635 ha).
Policy Implications
The dominant policy development of 2024 was the record-breaking fire season across the Amazon. These fire records were not only region-wide but also country-specific, occurring in Brazil, Bolivia, Peru, Guyana, Suriname, and French Guiana.
The 2024 records are particularly significant given that the Amazon has experienced several intense fire years over the past two decades. The most notable, and previous record-breaker, occurred in 2016, following the “Godzilla” El Niño event of 2015-16. However, the extreme drought conditions of 2023 and 2024, also associated with El Niño, exceeded those past benchmarks, creating extreme conditions for widespread fires across the Amazon.
As a result, fire policy is now emerging as a central pillar of Amazon conservation, alongside longstanding efforts to curb deforestation. This growing prominence is directly related to climate change, both in terms of intensifying dry seasons and the projected increase in the frequency, length, and severity of El Niño events.
These policies must be centered on how to avoid fires in the first place, and then how to effectively respond to major fires once they appear.
Previous research has revealed the tight link between deforestation and fires in the Brazilian Amazon (MAAP #189). That is, many major fires are burning recently deforested areas, and sometimes escape into surrounding forests, especially with extended dry conditions. Therefore, strengthening deforestation control remains one of the most effective fire mitigation strategies in Brazil and other Amazonian countries.
There is also a strong link between deforestation and fire in the Bolivian Amazon. While deforestation often precedes fires, as in Brazil, there is also a second round of deforestation following the fires
In both contexts, real-time fire monitoring, such as the MAAP Fire Tracker, should be integrated into national response protocols and field-level coordination.
Beyond fire, high rates of forest loss continue to be driven by deforestation across other parts of the Amazon. In Colombia’s arc of deforestation, we detected very high deforestation around Chiribiquete National Park, as well as high deforestation within Tinigua and Macarena National Parks. Although the national government is engaged on the issue of deforestation, these losses are closely tied to the presence and influence of armed groups in the country, which exert substantial control over land-use and deforestation dynamics (explaining shifts such as the dip in 2023 and the rise again in 2024). The major deforestation drivers in Colombia are roads, land grabbing (and associated cattle pastures), and coca cultivation.
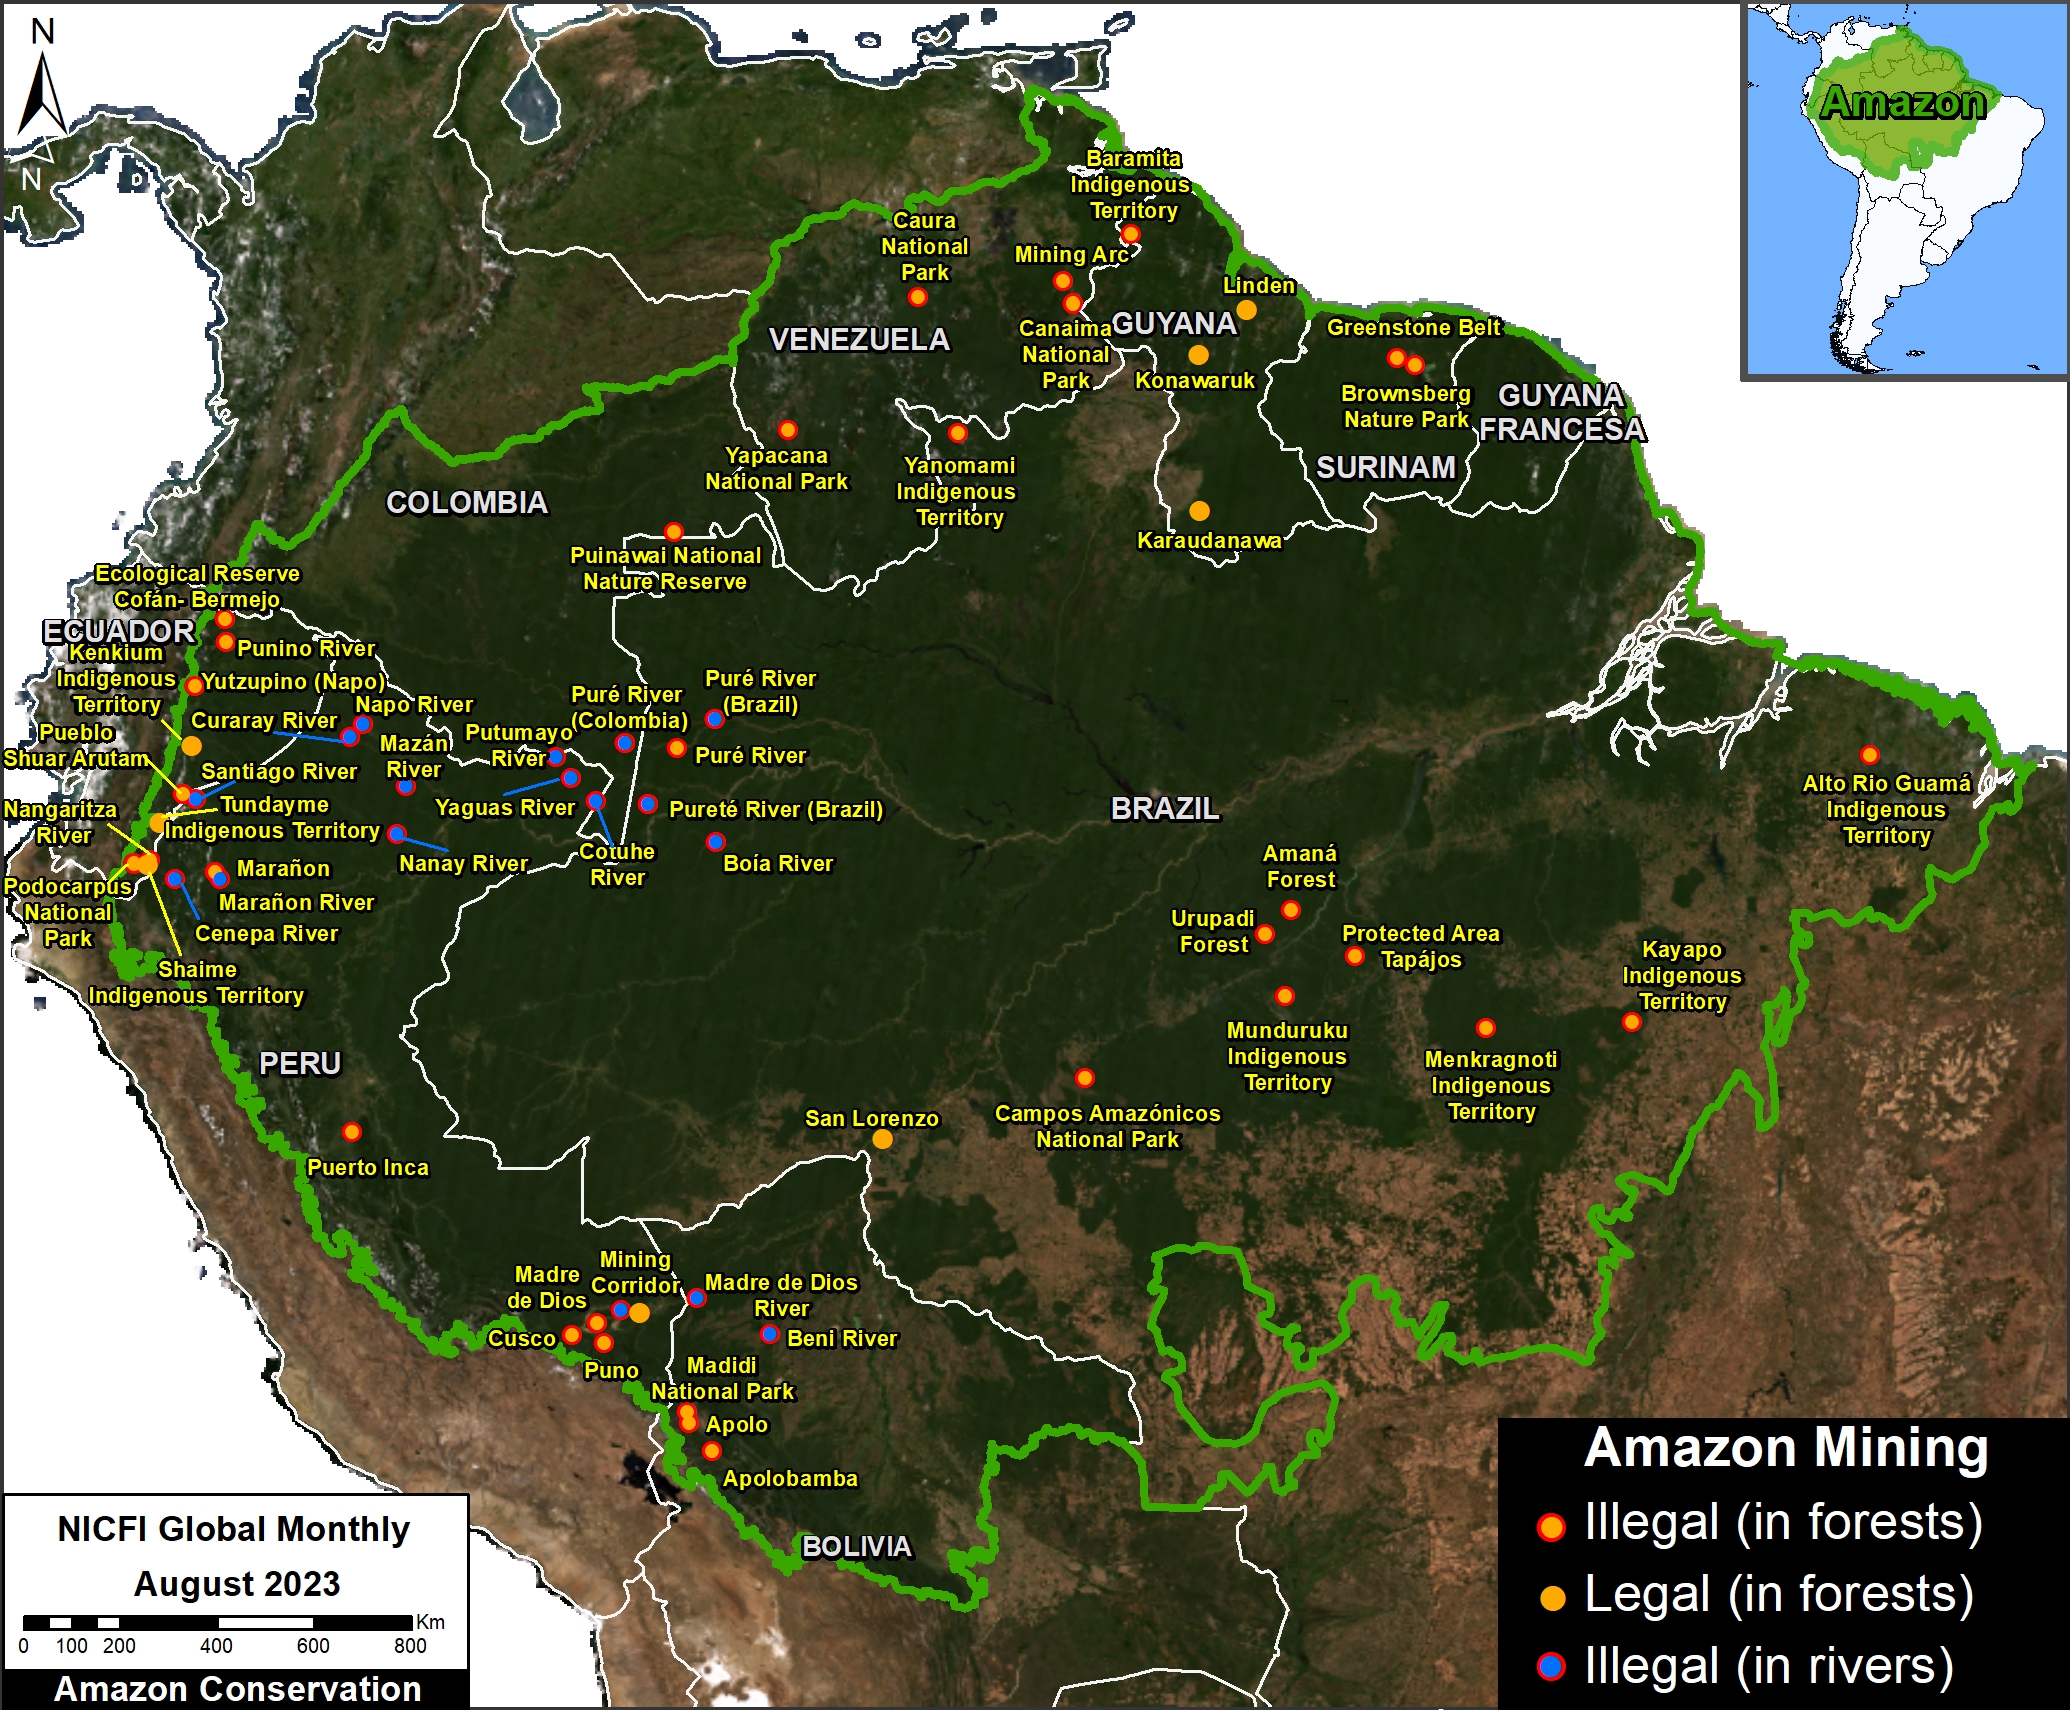
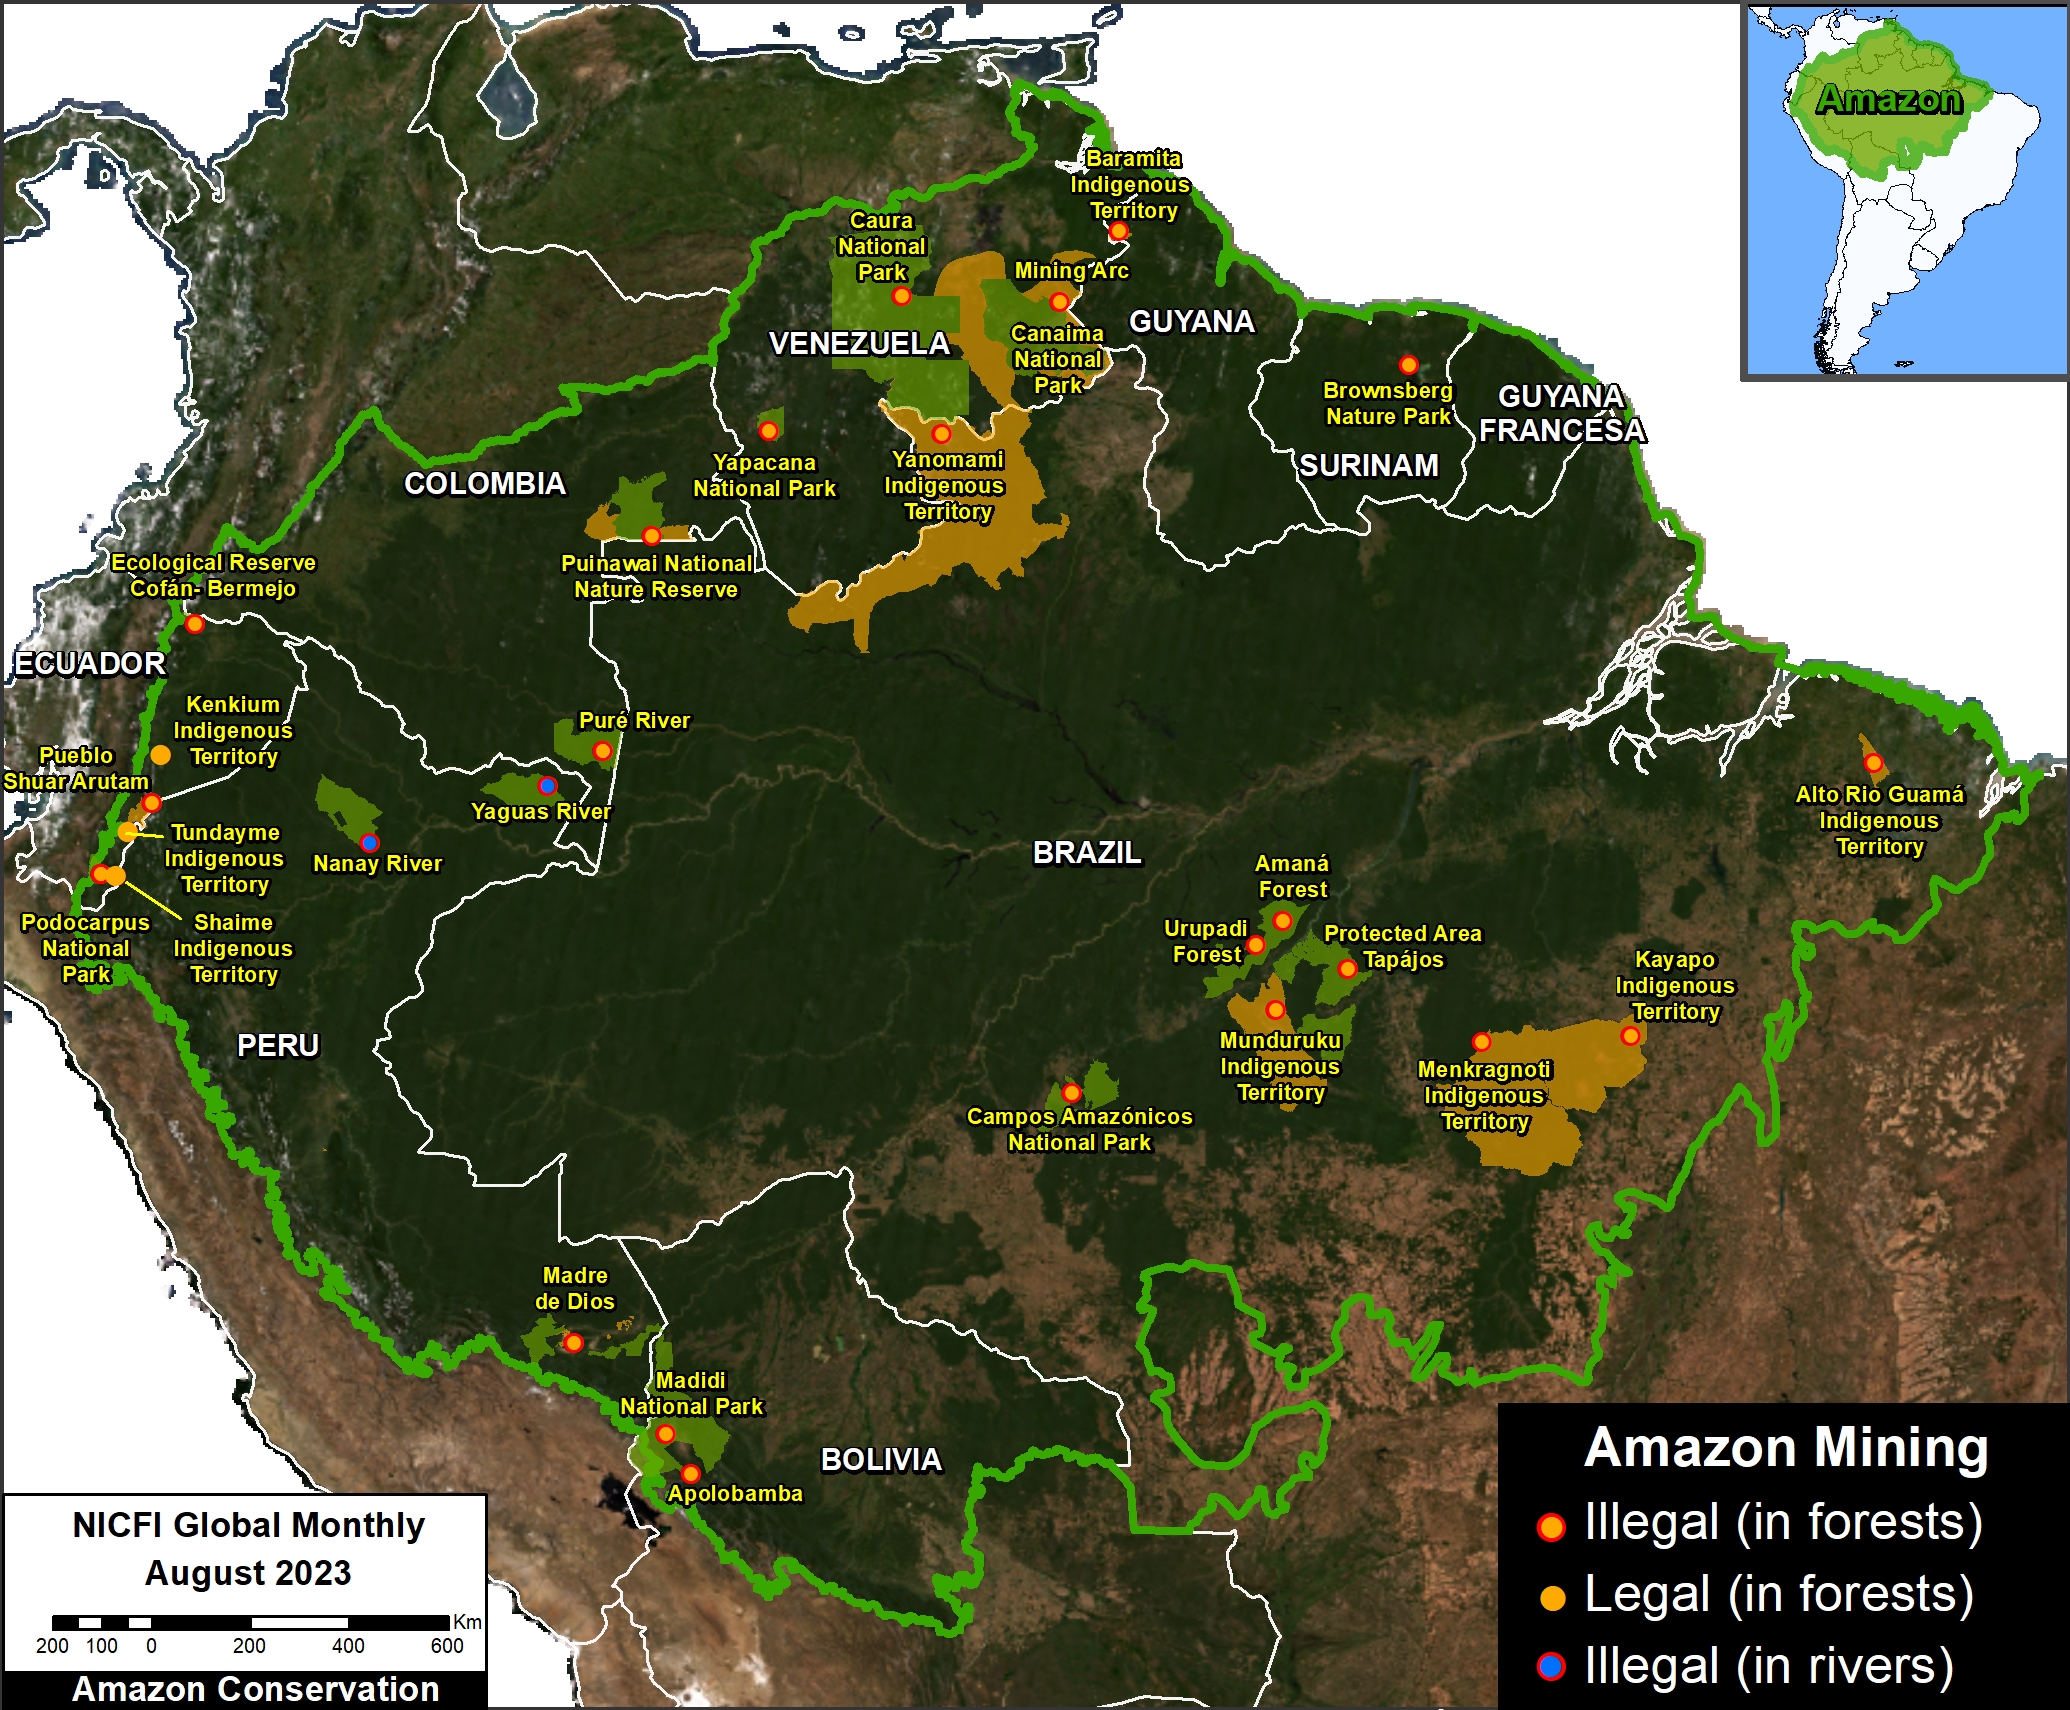
Other high forest loss areas include gold mining fronts in northern Ecuador and southern Peru, Mennonite colonies in central Peru, the soy frontier in southeast Bolivia, and along major existing roads in Brazil. Although there is gold mining in both Venezuela and Guyana, the most intense forest loss hotspots were associated with fires surrounding agricultural areas.
It is important to note that the data presented here may differ from national data presented by governments. This difference may be due to methodology (we focus on impact on primary forests), spatial resolution (30 meters in our case), and Amazon boundaries (we employ a hybrid boundary designed for maximum inclusion of both watershed and biogeography). Due to these potential differences among sources, it is best to focus on the convergence of overall trends and patterns, and not overly focus on absolute numerical differences.
Annex 1
Annex 2
Methodology
The analysis was based on 30-meter resolution annual forest loss data produced by the University of Maryland and also presented by Global Forest Watch.
This data was complemented with the Global Forest Loss due to fire dataset that is unique in terms of being consistent across the Amazon (in contrast to country specific estimates) and distinguishes forest loss caused directly by fire (note that virtually all Amazon fires are human-caused). The values included were ‘medium’ and ‘high’ confidence levels (code 3-4). This fire data may be interpreted as forest degradation, in contrast to the more permanent impacts of deforestation.
The remaining forest loss serves as a likely close proxy for deforestation, with the only remaining exception being natural events such as landslides, wind storms, and meandering rivers. The values used to estimate this category was ‘low’ certainty of forest loss due to fire (code 2), and forest loss due to other ‘non-fire’ drivers (code 1).
For the baseline, it was defined to establish areas with >30% tree canopy density in 2000. Importantly, we applied a filter to calculate only primary forest loss by intersecting the forest cover loss data with the additional dataset “primary humid tropical forests” as of 2001 (Turubanova et al 2018). For more details on this part of the methodology, see the Technical Blog from Global Forest Watch (Goldman and Weisse 2019).
Our geographic range for the Amazon is a hybrid designed for maximum inclusion: biogeographic boundary (as defined by RAISG) for all countries, except for Bolivia and Peru, where we use the watershed boundary, and Brazil, where we use the Legal Amazon boundary.
To identify the deforestation hotspots, we conducted a kernel density estimate. This type of analysis calculates the magnitude per unit area of a particular phenomenon, in this case, forest cover loss. We conducted this analysis using the Kernel Density tool from the Spatial Analyst Tool Box of ArcGIS. We used the following parameters:
Search Radius: 15000 layer units (meters)
Kernel Density Function: Quartic kernel function
Cell Size in the map: 50 x 50 meters (0.25 hectares)
Everything else was left to the default setting.
For the Base Map, we used the following concentration percentages: High: 3-14%; Very High: >14%. These percentages correspond to the concentration of forest loss pixels, with a pixel size of 50 x 50 meters (0.25 hectares).
Acknowledgements
We thank colleagues at Global Forest Watch (GFW), an initiative of the World Resources Institute (WRI) for early access to data.
We also thank colleagues from the following organizations for helpful comments on the report: Conservación Amazónica – ACEAA in Bolivia, Conservación Amazónica – ACCA in Peru, Fundación EcoCiencia in Ecuador, and Instituto Centro de Vida (ICV) in Brazil.
This work was supported by Norad (Norwegian Agency for Development Cooperation).
![]()
Citation
Finer M, Ariñez A, Mamani N, Cohen M, Santana A (2025) Amazon Deforestation & Fire Hotspots 2024. MAAP: 229.