MAAP #217: Carbon across the Amazon (part 2): Peak Carbon Areas

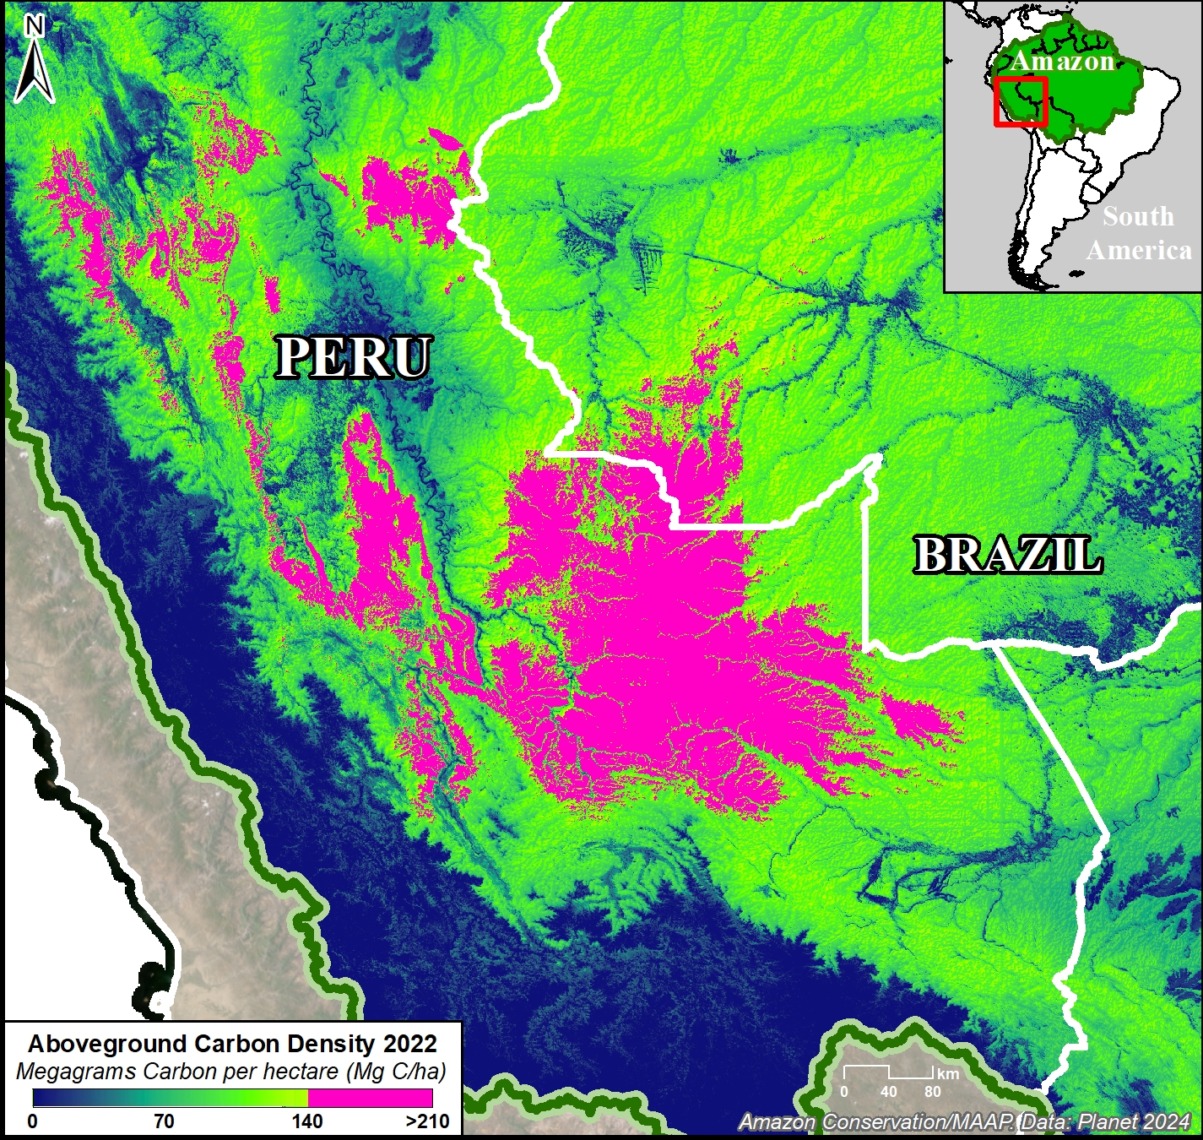
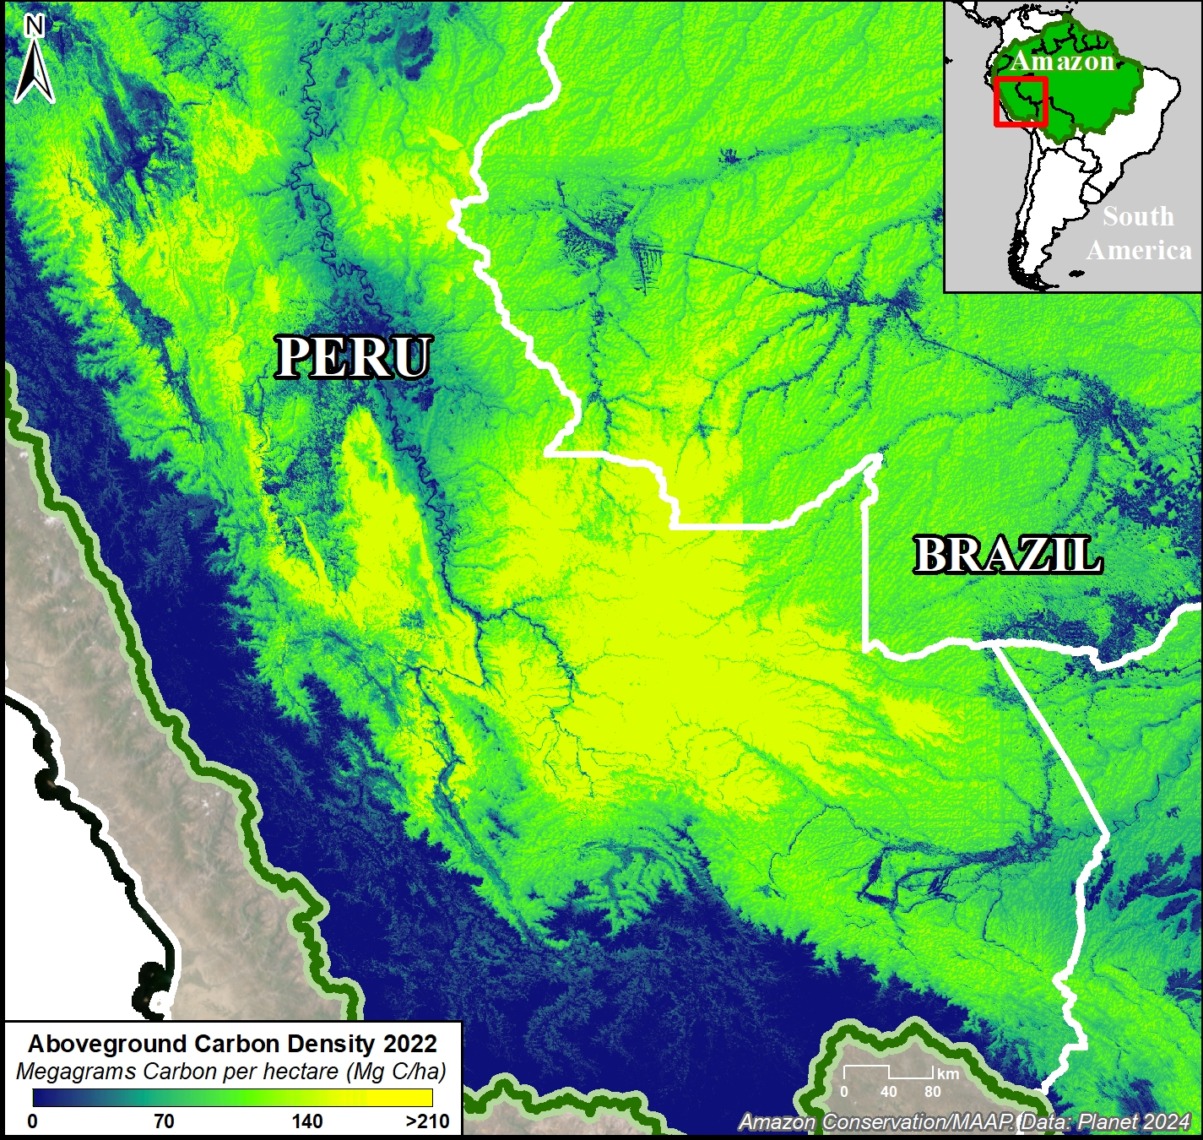
Figure 1. Example of peak carbon areas in southern Peru and adjacent western Brazil. Data: Planet.

In part 1 of this series (MAAP #215), we introduced a critical new resource (Planet Forest Carbon Diligence) that provides wall-to-wall estimates for aboveground carbon density at an unprecedented 30-meter resolution. This data uniquely merges machine learning, satellite imagery, airborne lasers, and a global biomass dataset from GEDI, a NASA mission.4

In that report, we showed that the Amazon contains 56.8 billion metric tons of aboveground carbon (as of 2022), and described key patterns across all nine countries of the Amazon biome over the past decade.

Here, in part 2, we focus on the peak carbon areas of the Amazon that are home to the highest aboveground carbon levels.

These peak carbon areas correspond to the upper one-third of aboveground carbon density levels (>140 metric tons per hectare).1

They likely have experienced minimal degradation (such as selective logging, fire, and edge/fragmentation effects)2 and are thus a good proxy for high-integrity forests.

Figure 1 shows an important example of peak carbon areas in southern Peru and adjacent western Brazil.

The peak carbon areas are often found in the remote primary forests of protected areas and Indigenous territories, but some are located in forestry concessions (specifically, logging concessions) or undesignated lands (also referred to as undesignated public forests).

Our goal in this report is to leverage unprecedented aboveground carbon data to reinforce the importance of these designated areas and draw attention to the remaining undesignated lands.

For example, peak carbon areas would be excellent candidates for the High Integrity Forest (HIFOR) initiative, a new financing instrument that uniquely focuses on maintaining intact tropical forests.3 HIFOR rewards the climate services that intact tropical forests provide, including ongoing net carbon removal from the atmosphere, and complements existing instruments to reduce emissions from deforestation and degradation (REDD+) by focusing on tropical forests that are largely undegraded.

Below, we detail the major findings and then zoom in on the peak carbon areas in the northeast and southwest Amazon.

Peak Carbon Areas in the Amazon   

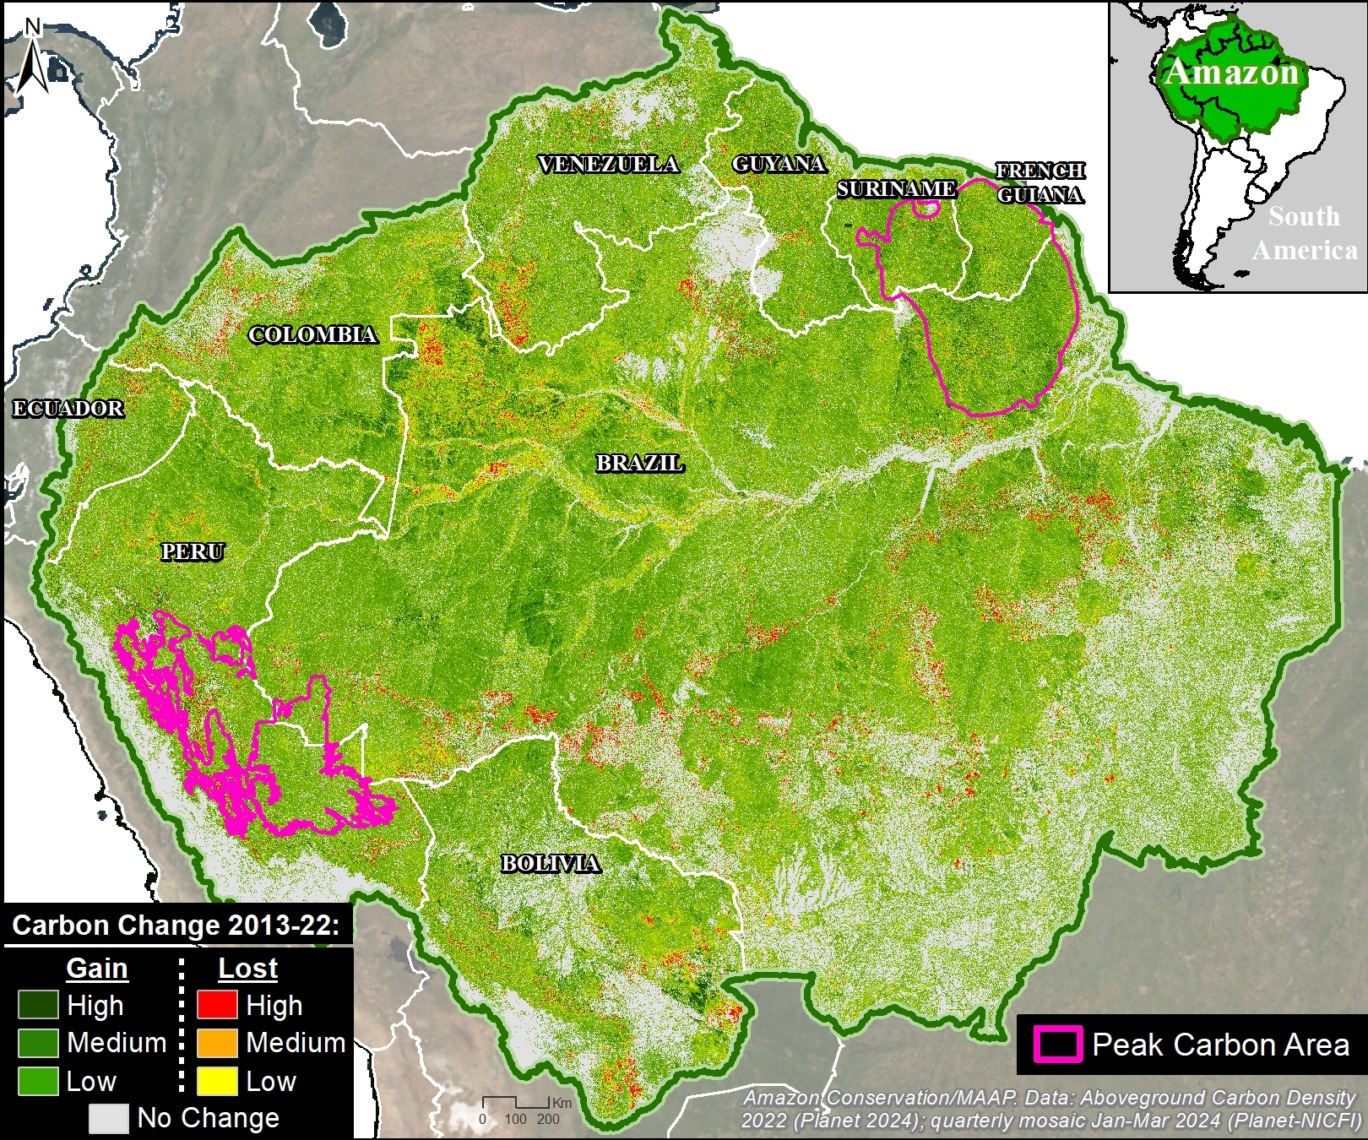
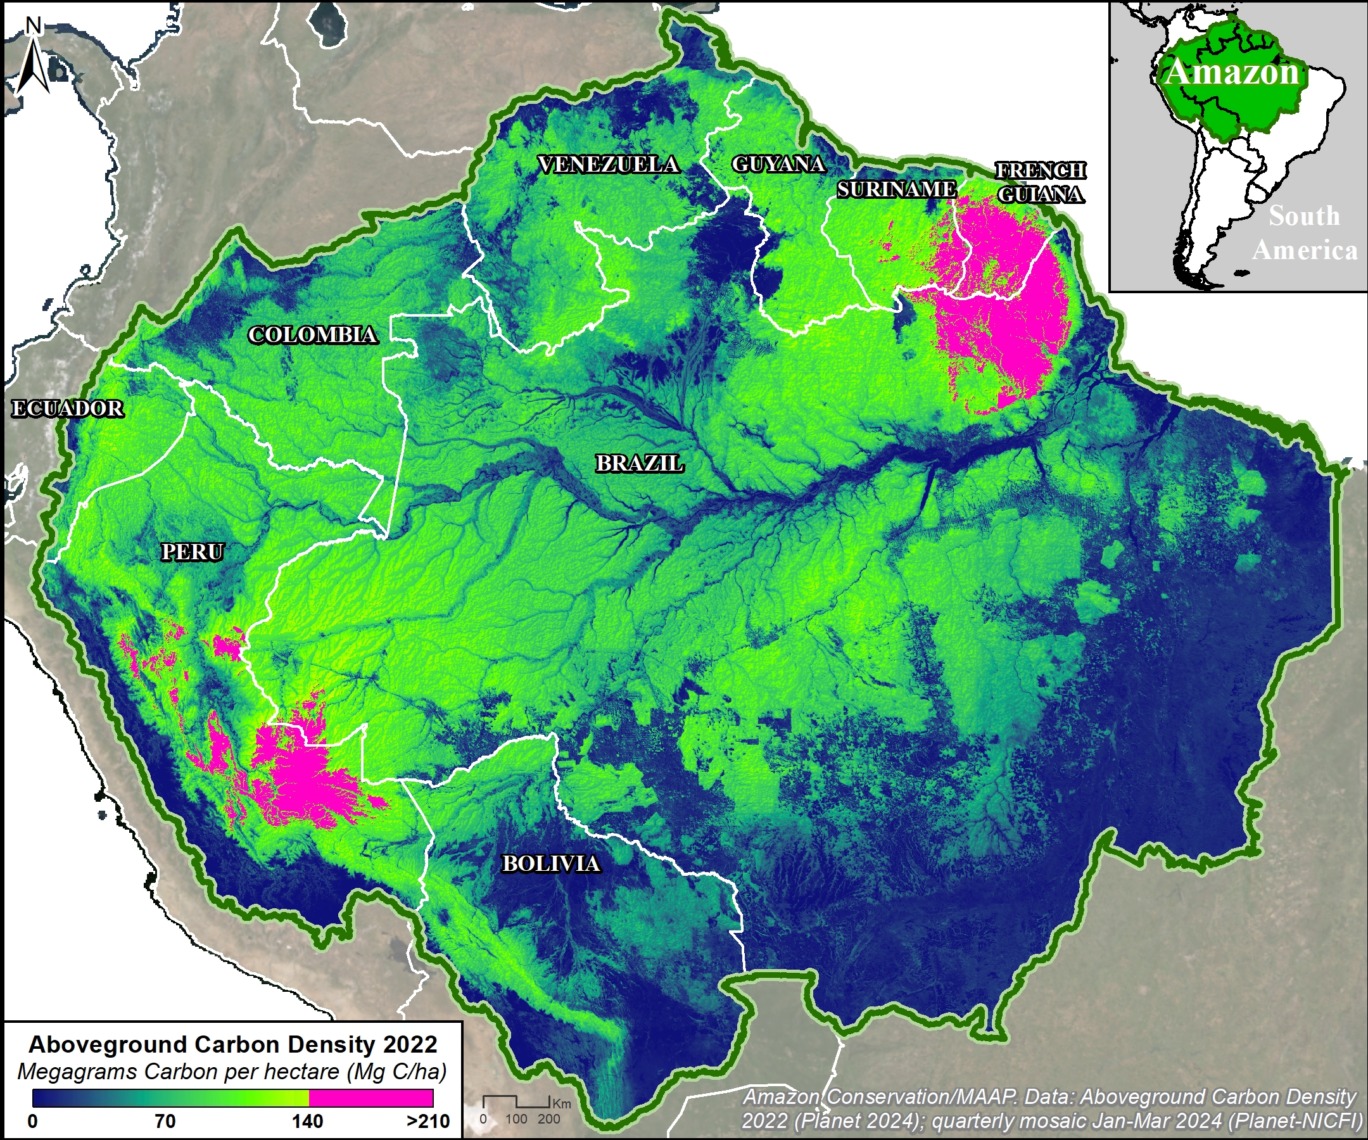
The Base Map below illustrates our major findings.

The peak carbon areas (>140 metric tons per hectare; indicated in pink) are concentrated in the southwest and northeast Amazon, covering 27.8 million hectares (11 million ha in the southwest and 16.8 million ha in the northeast).
k

Base Map. Planet Forest Carbon Diligence across the Amazon biome for the year 2022. Data: Planet.

In the southwest Amazon, peak carbon levels are found in southern & central Peru, and adjacent western Brazil.

In the northeast Amazon, peak carbon levels are found in northeast Brazil, much of French Guiana, and parts of Suriname.

By country, Brazil and Peru have the largest area of peak carbon (10.9 million and 10.1 million hectares respectively), followed by French Guiana (4.7 million ha), and Suriname (2.1 million ha).

Protected areas and Indigenous territories cover much (61%) of the peak carbon area (16.9 million hectares).

The remaining 39% remains unprotected, and arguably threatened, in undesignated lands (9.4 million hectares) and forestry concessions (1.5 million ha), respectively.

In addition, high carbon areas (>70 metric tons per hectare; indicated by the greenish-yellow coloration in the Base Map) are found in all nine countries of the Amazon biome, notably Colombia, Ecuador, Bolivia, Venezuela, and Guyana.

Southwest Amazon

­Southern Peru

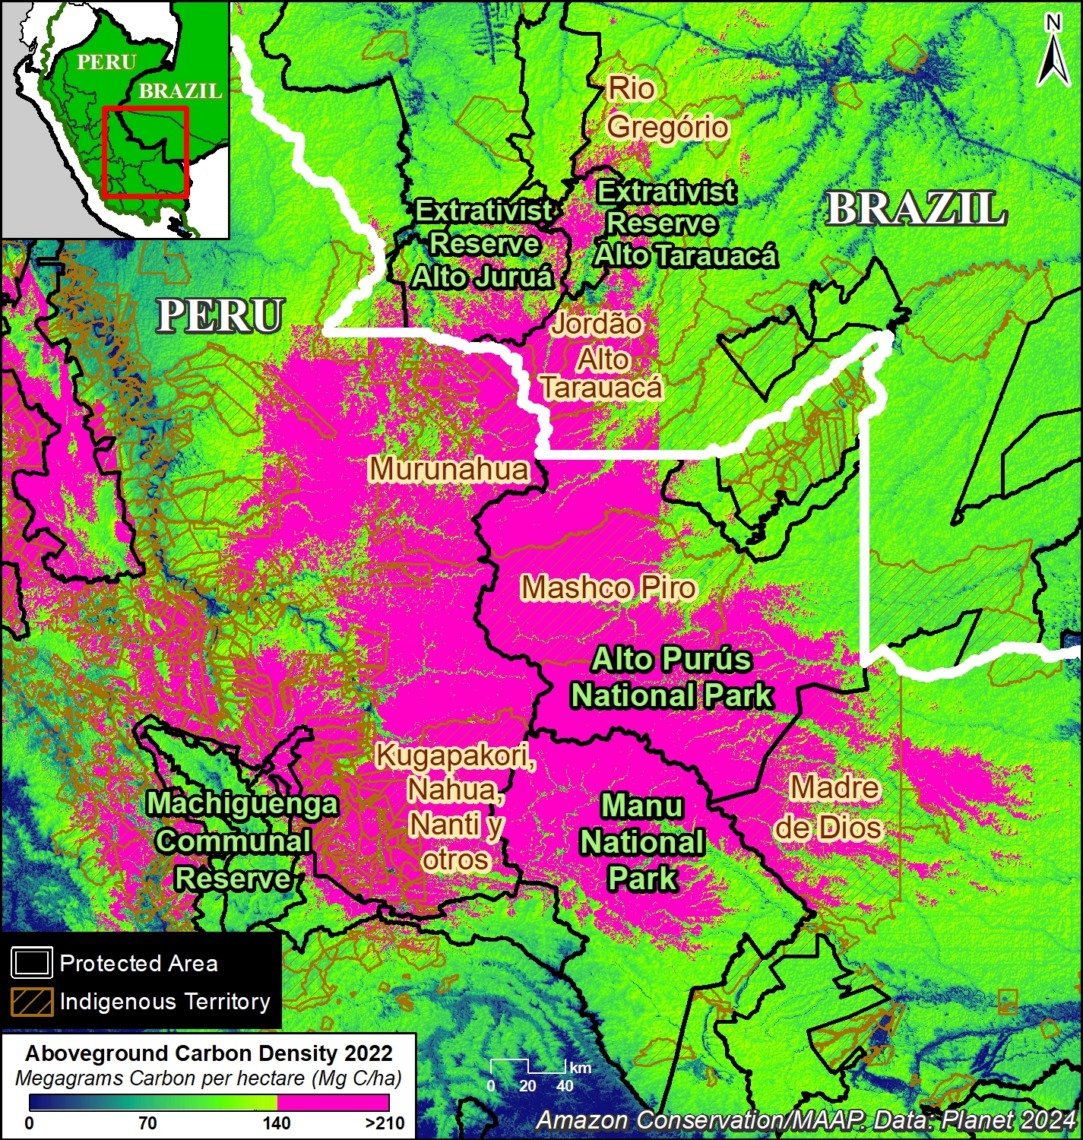
Figure 2a. Peak carbon area in the southern Peruvian Amazon. Data: Planet, SERNANP, RAISG.

Figure 2a zooms in on the peak carbon area covering 7.9 million hectares in southern Peru (regions of Madre de Dios, Cusco, and Ucayali) and adjacent southwest Brazil (Acre).

Several protected areas (such as Manu and Alto Purús National Parks, and Machiguenga Communal Reserve) anchor this area.

It is also home to numerous Indigenous territories (such as Mashco Piro, Madre de Dios, and Kugapakori, Nahua, Nanti & Others Indigenous Reserves).


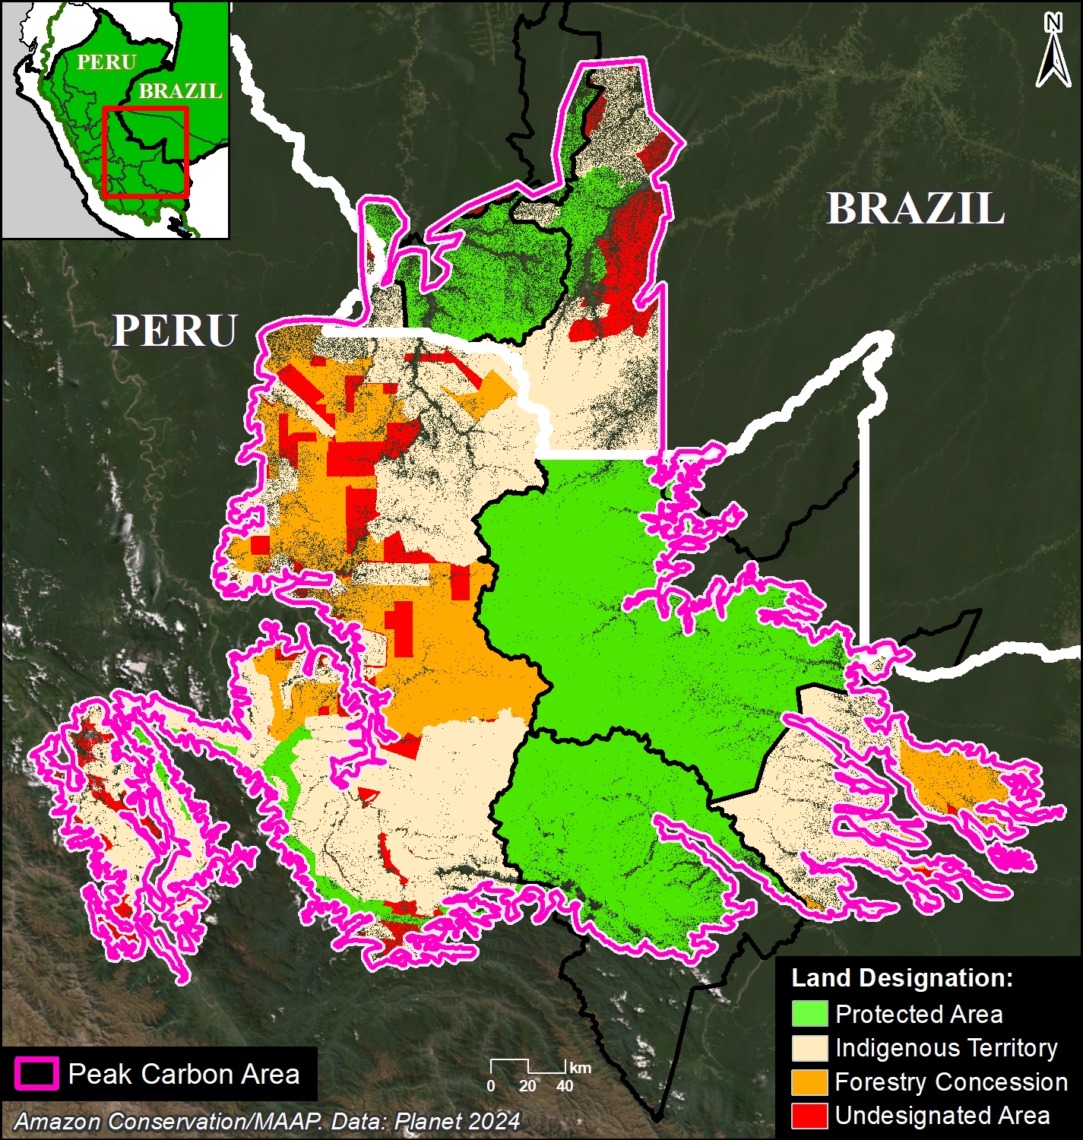
Figure 2b highlights the major land designations within the peak carbon area of southern Peru.

Figure 2b. Peak carbon areas (outlined in pink), categorized by land designation in southern Peru and adjacent western Brazil. Data: Planet, NICFI, SERNANP, SERFOR, RAISG.

Protected areas and Indigenous territories cover 77% of this area (green and brown, respectively).

The remaining 23% could be considered threatened, as they are located in forestry concessions or undesignated lands (orange and red, respectively). Thus, these areas are ideal candidates for increased protection to maintain their peak carbon levels.


Central Peru

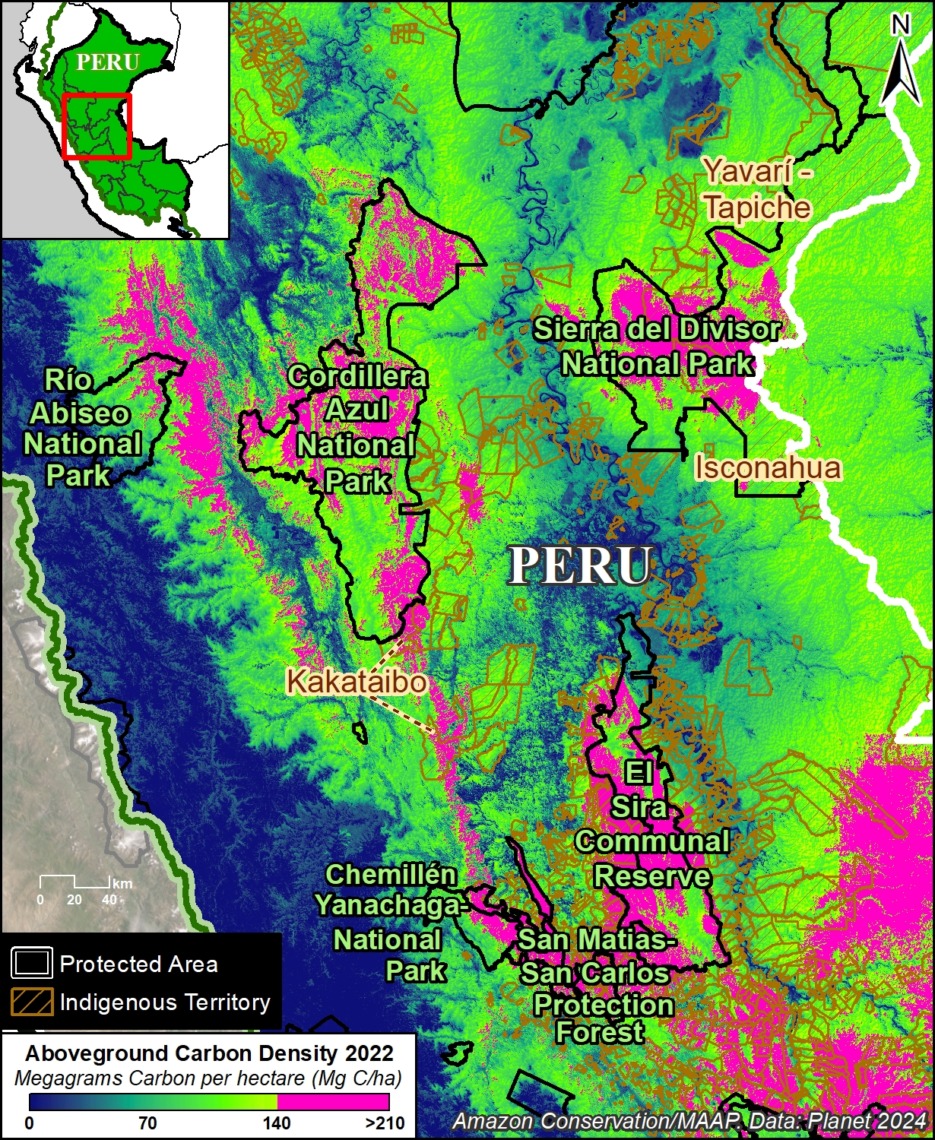
Figure 3a. Peak carbon area in the central Peruvian Amazon. Data: Planet, SERNANP, RAISG.

Figure 3a zooms in on the peak carbon area in the central Peruvian Amazon, which covers 3.1 million hectares in the regions of Ucayali, Loreto, Huánuco, Pasco, and San Martin.

Several protected areas (including Sierra del Divisor, Cordillera Azul, Rio Abiseo, and Yanachaga–Chemillén National Parks, and El Sira Communal Reserve) anchor this area.

It is also home to numerous Indigenous territories (such as Kakataibo, Isconahua, and Yavarí Tapiche Indigenous Reserves).


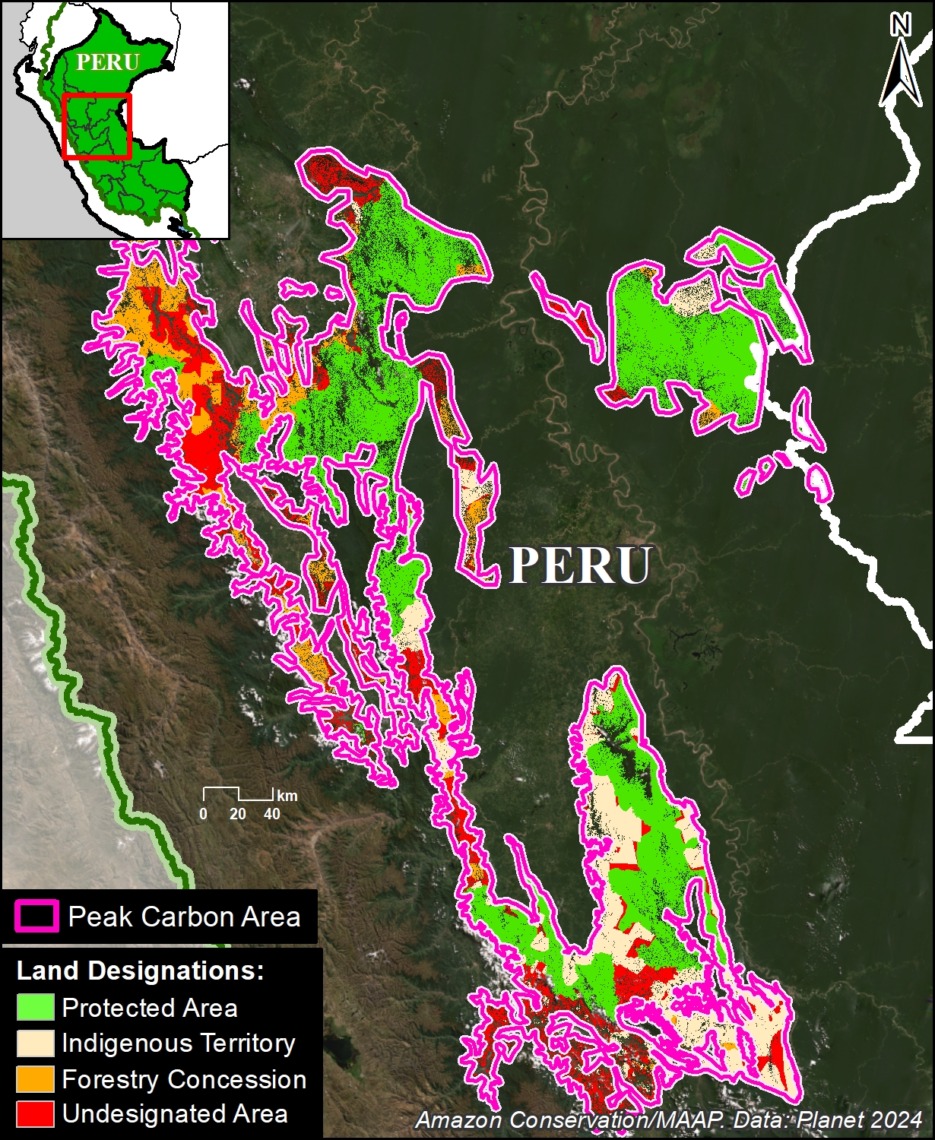
Figure 3b. Peak carbon areas (outlined in pink), categorized by land designation in central Peru. Data: Planet, NICFI, SERNANP, SERFOR, RAISG.

Figure 3b highlights the major land designations within the peak carbon area of central Peru.

Protected areas and Indigenous territories cover 69% of this area (green and brown, respectively).

The remaining 31% could be considered threatened, as they are located in forestry concessions or undesignated lands (orange and red, respectively), and are ideal candidates for increased protection.


Northeast Amazon

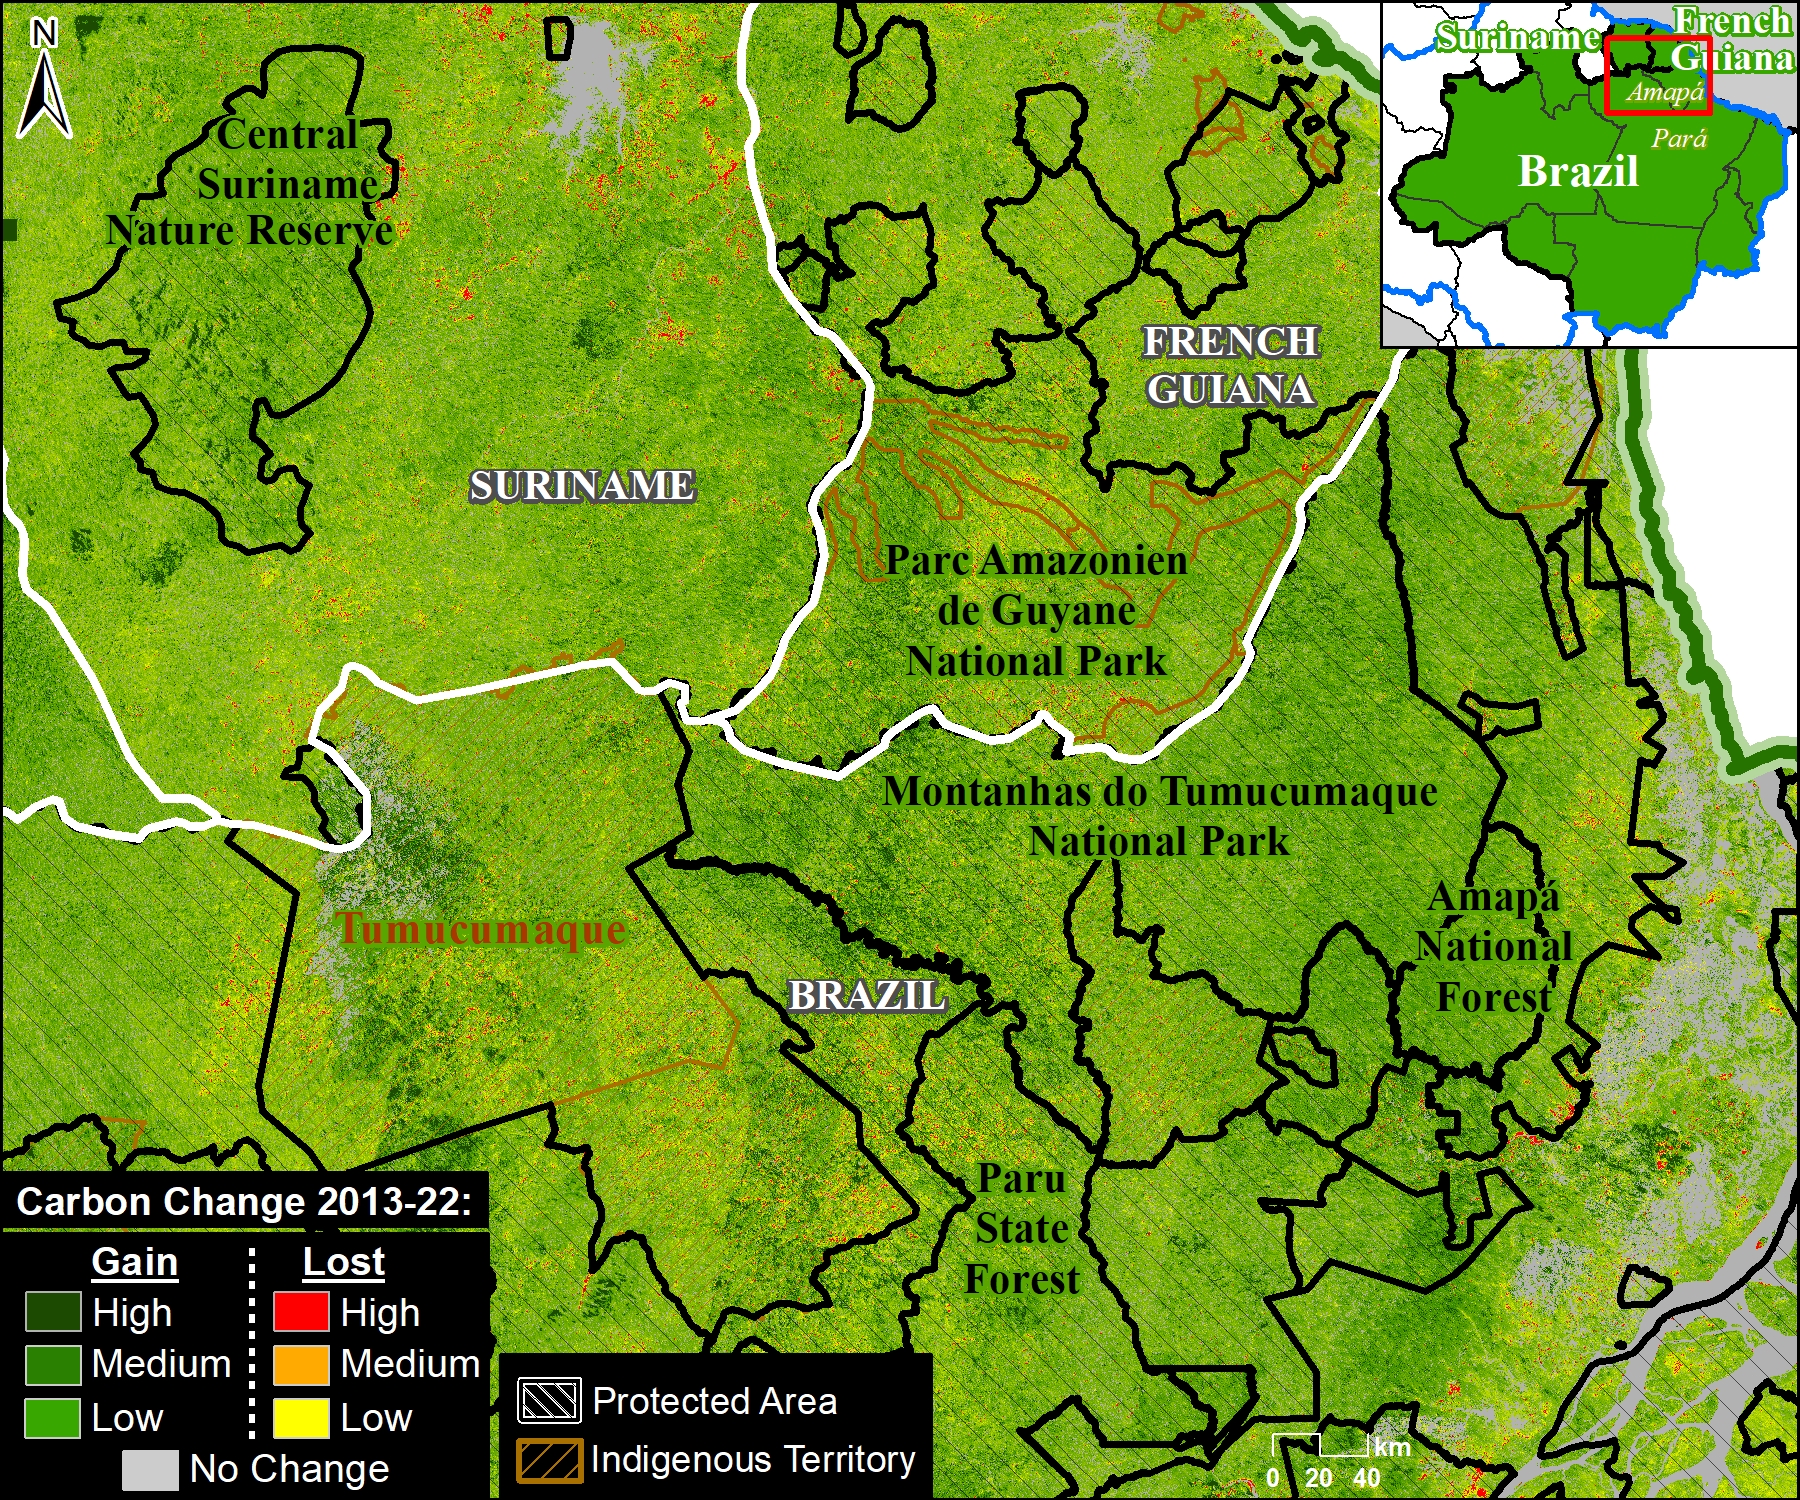
Figure 4a. Peak carbon area in the tri-border region of the northeast Amazon. Data: Planet, RAISG.

Figure 4a zooms in on the peak carbon area in the tri-border region of the northeast Amazon, which covers 16.8 million hectares in northern Brazil, French Guiana, and Suriname.

Several protected areas (including Montanhas do Tumucumaque National Park in northeast Brazil, Amazonien de Guyane National Park in French Guiana, and Central Suriname Nature Reserve) anchor this area.

It is also home to numerous Indigenous territories (such as Tumucumaque, Rio Paru de Este, and Wayãpi in northeast Brazil).


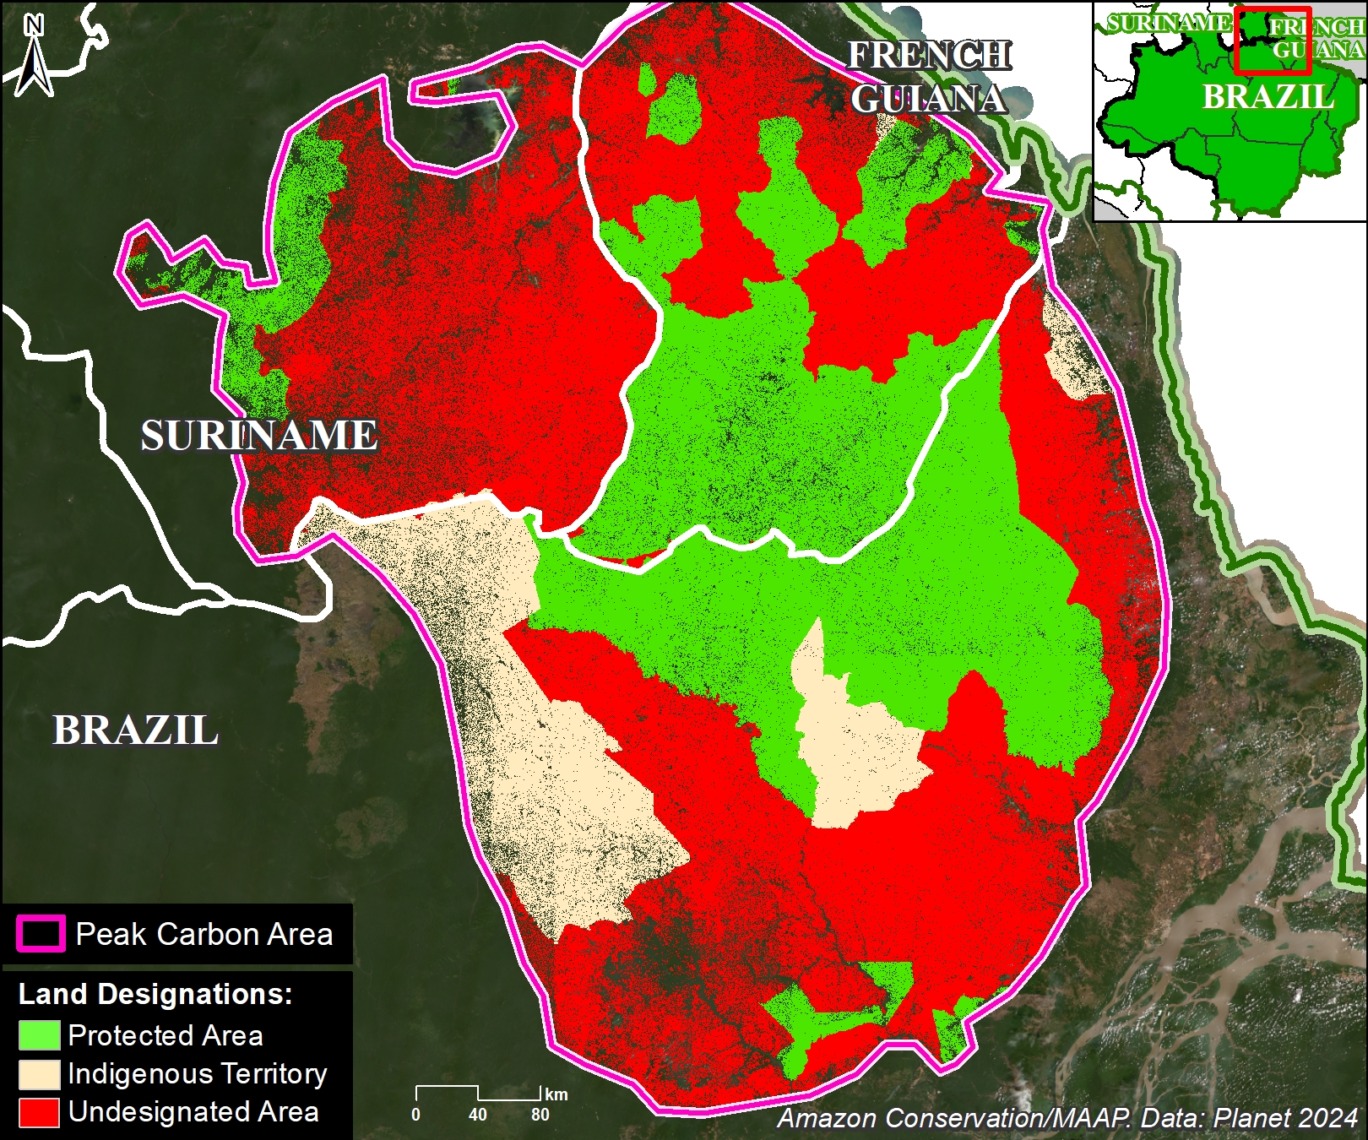
Figure 4b. Peak carbon areas (outlined in pink), categorized by land designation in northeast Amazon. Data: Planet, NICFI, RAISG.

Figure 4b highlights the major land designations within the peak carbon area of the northeast Amazon.

Protected areas and Indigenous territories cover just over half (51%) of this area (green and brown, respectively).

The remaining 49% could be considered threatened, as they are located in undesignated lands, and are ideal candidates for increased protection.


Notes

1 We selected this value (upper 33%) to capture the highest aboveground carbon areas and include a range of high carbon areas. Additional analyses could target different values, such as the highest 10% or 20% of aboveground carbon.

2  A recent paper documented a strong relationship between selective logging and aboveground carbon loss (Csillik et al. 2024, PNAS). The link between forest edges and carbon is presented in Silva Junior et al, Science Advances.

3 High Integrity Forest (HIFOR) units are a new tradable asset that recognizes and rewards the essential climate services and biodiversity conservation that intact tropical forests provide, including ongoing net removal of CO2 from the atmosphere. For more information see https://www.wcs.org/our-work/climate-change/forests-and-climate-change/hifor

4 For more information, see the “What is Forest Carbon Diligence?” section in this recent blog from Planet.

Citation

Finer M, Mamani N, Anderson C, Rosenthal A (2024) Carbon across the Amazon (part 2): Peak Carbon Areas. MAAP #217.

MAAP #215: Unprecedented Look at Carbon across the Amazon (part 1)

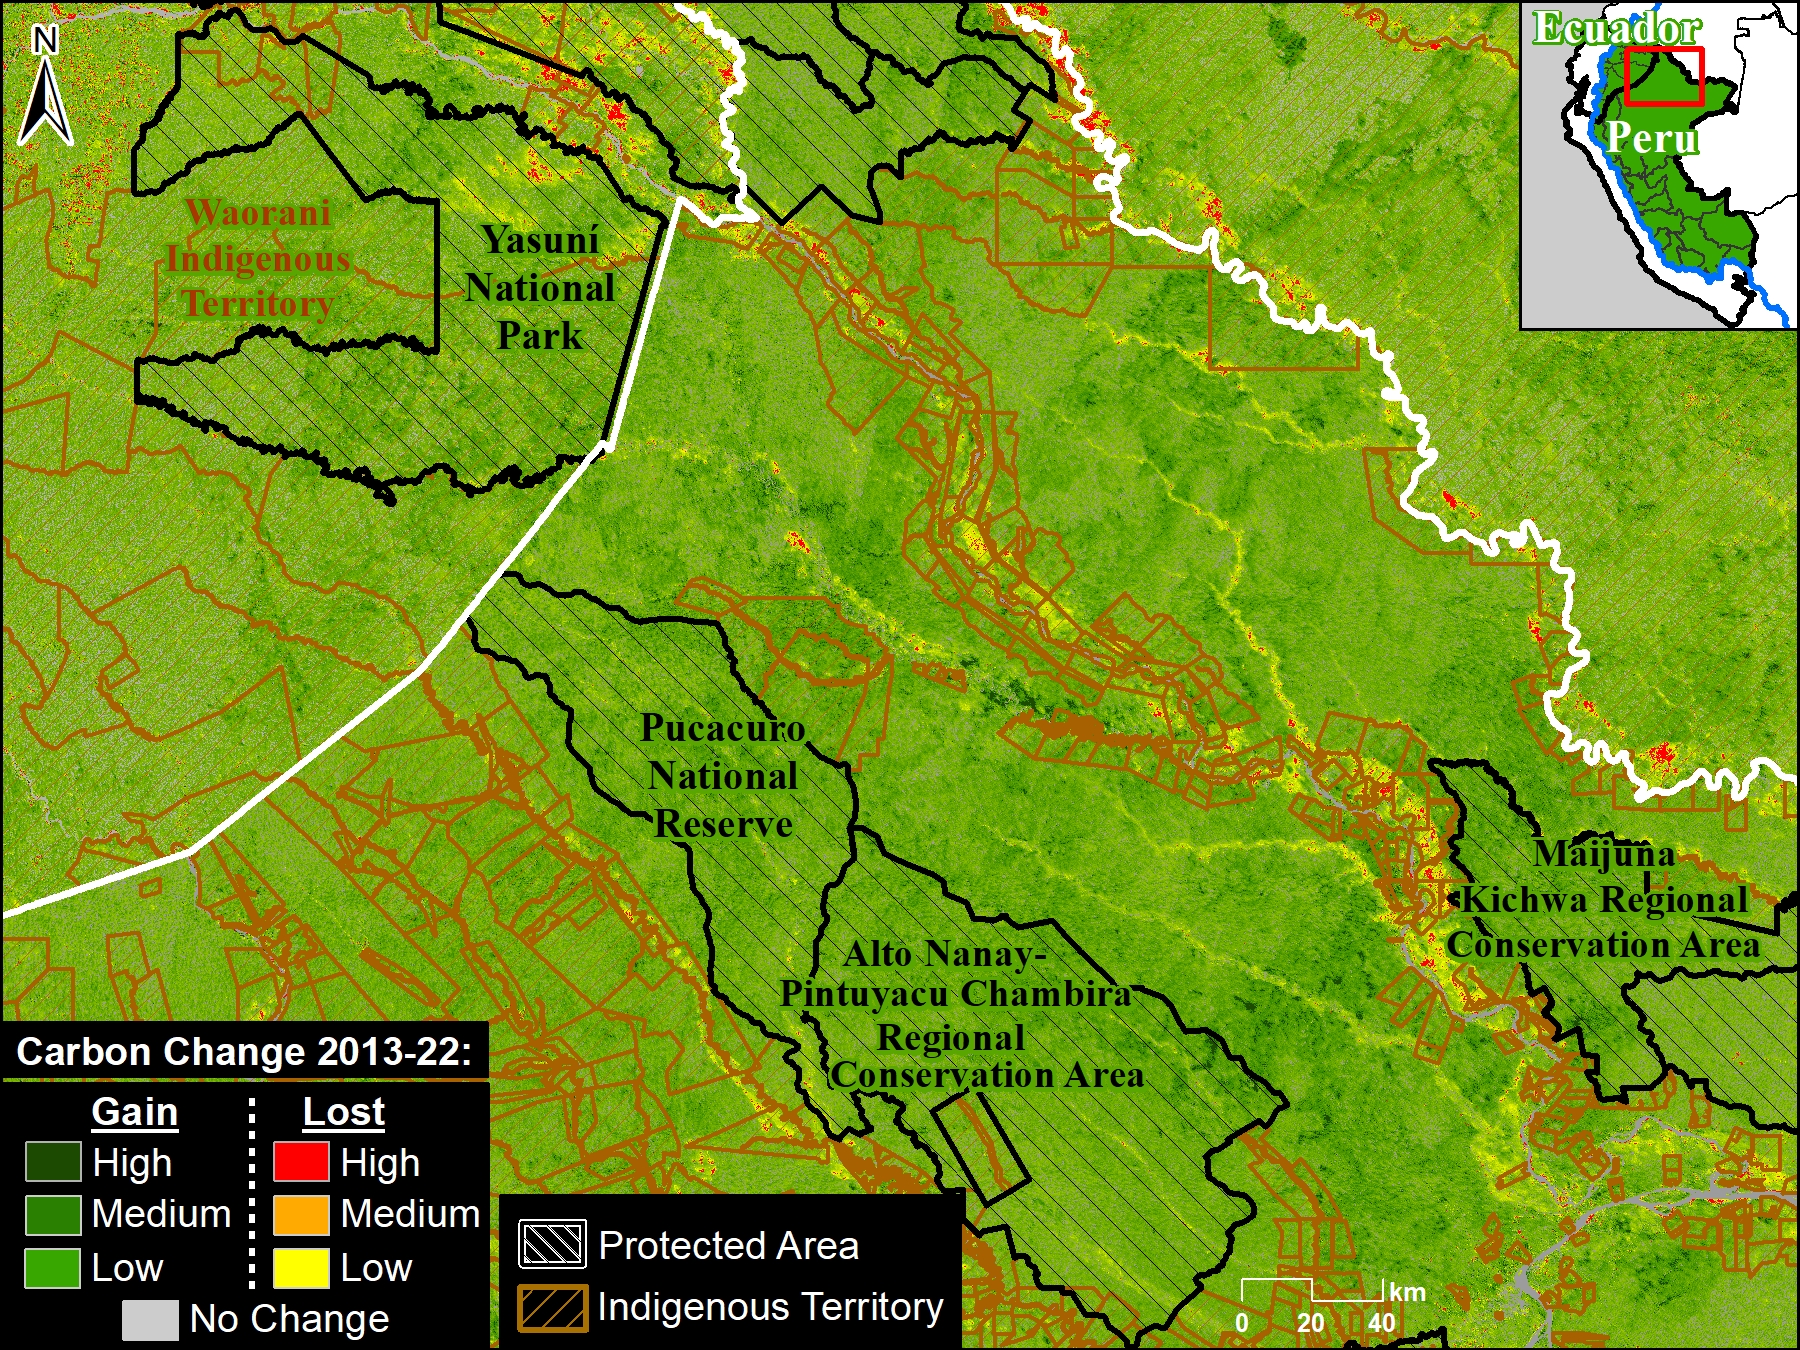
Figure 1. Example of Planet Forest Carbon Diligence, focused on southern Peru and adjacent western Brazil.

The Amazon biome has long been one of the world’s largest carbon sinks, helping stabilize the global climate.

Precisely estimating this carbon, however, has been a challenge. Fortunately, new satellite-based technologies are providing major advances, most notably NASA’s GEDI mission (see MAAP #213) and, most recently, Planet Forest Carbon Diligence.1

Here, we focus on the latter, analyzing Planet’s cutting-edge new dataset, featuring a 10-year historical time series (2013 – 2022) with wall-to-wall estimates for aboveground carbon density at 30-meter resolution.

As a result, we can produce high-resolution aboveground carbon maps and estimates for anywhere and everywhere across the vast Amazon (see Figure 1).

Through a generous sharing agreement with Planet, we have been granted access to this data across the entire Amazon biome for the analysis presented in the following three-part series:

  1. Estimate and illustrate total aboveground forest carbon across the Amazon biome in unprecedented detail (see results of this first report, below).
    j
  2. Highlight which parts of the Amazon are home to the highest aboveground carbon levels, including protected areas and Indigenous territories (see second report, MAAP #217).
    l
  3. Present emblematic deforestation cases that have resulted in the highest aboveground carbon emissions across the Amazon (see third report, MAAP #220).

Major Results

Carbon across the Amazon

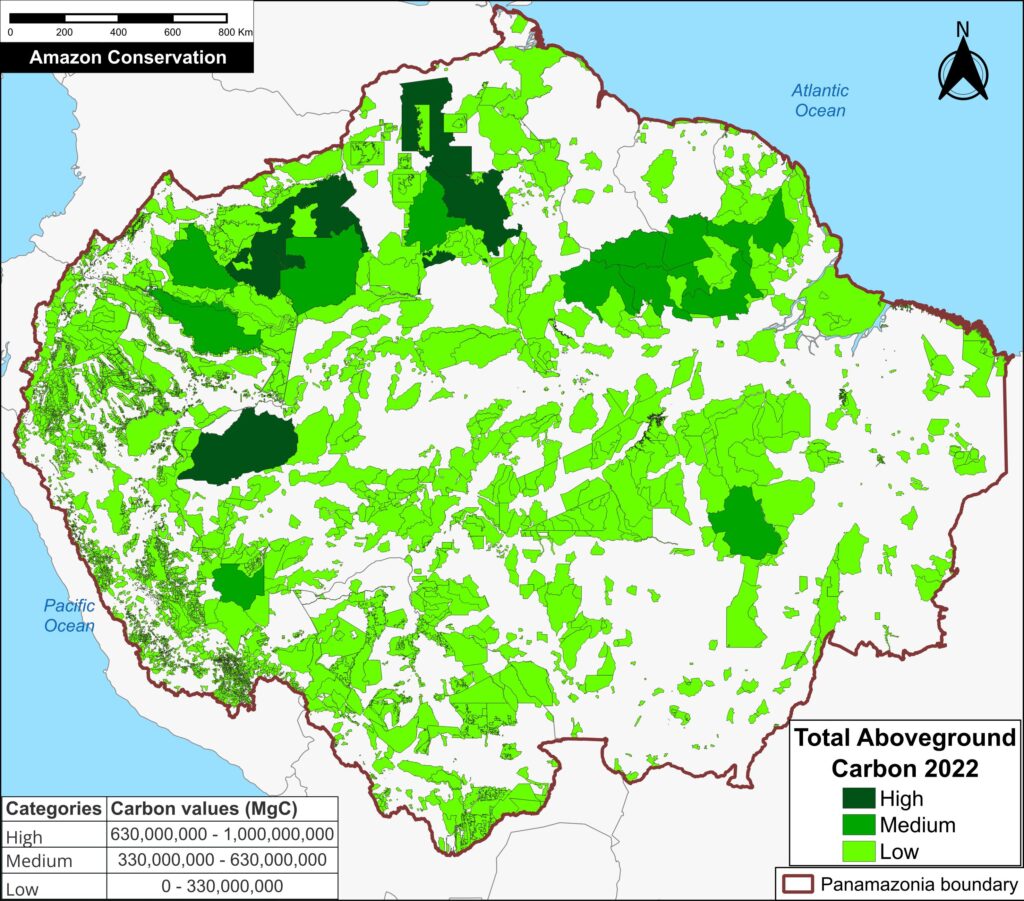
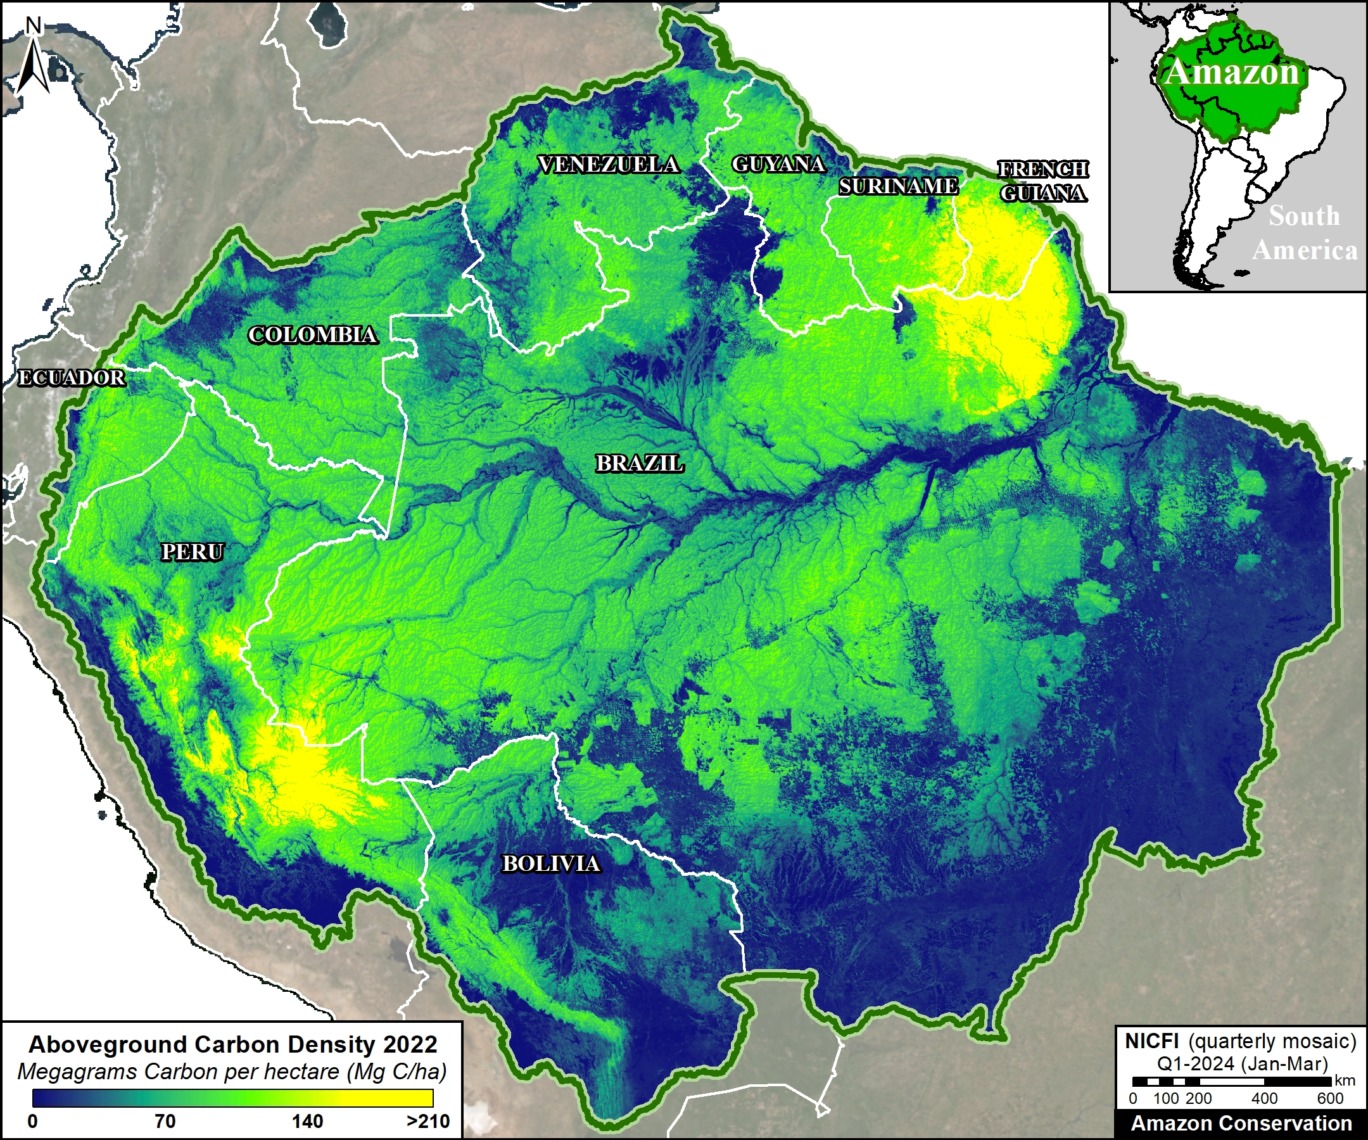
Based on our analysis of Planet Forest Carbon Diligence, we estimate that the Amazon contained 56.8 billion metric tons of aboveground carbon, as of 2022 (see Base Map). Applying a standard root-to-shoot ratio conversion (26%), this estimate increases to 71.5 billion metric tons of above and belowground carbon. This total is equivalent to nearly two years of global carbon dioxide emissions at the peak 2022 level (37.15 billion metric tons).5

The peak carbon levels are largely concentrated in the southwest Amazon (southern Peru and adjacent western Brazil) and northeast Amazon (northeast Brazil, French Guiana, and Suriname).

Base Map. Planet Forest Carbon Diligence across the Amazon biome.

Total Carbon by Country

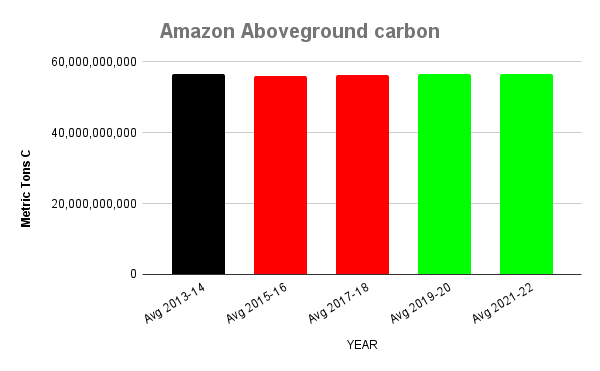
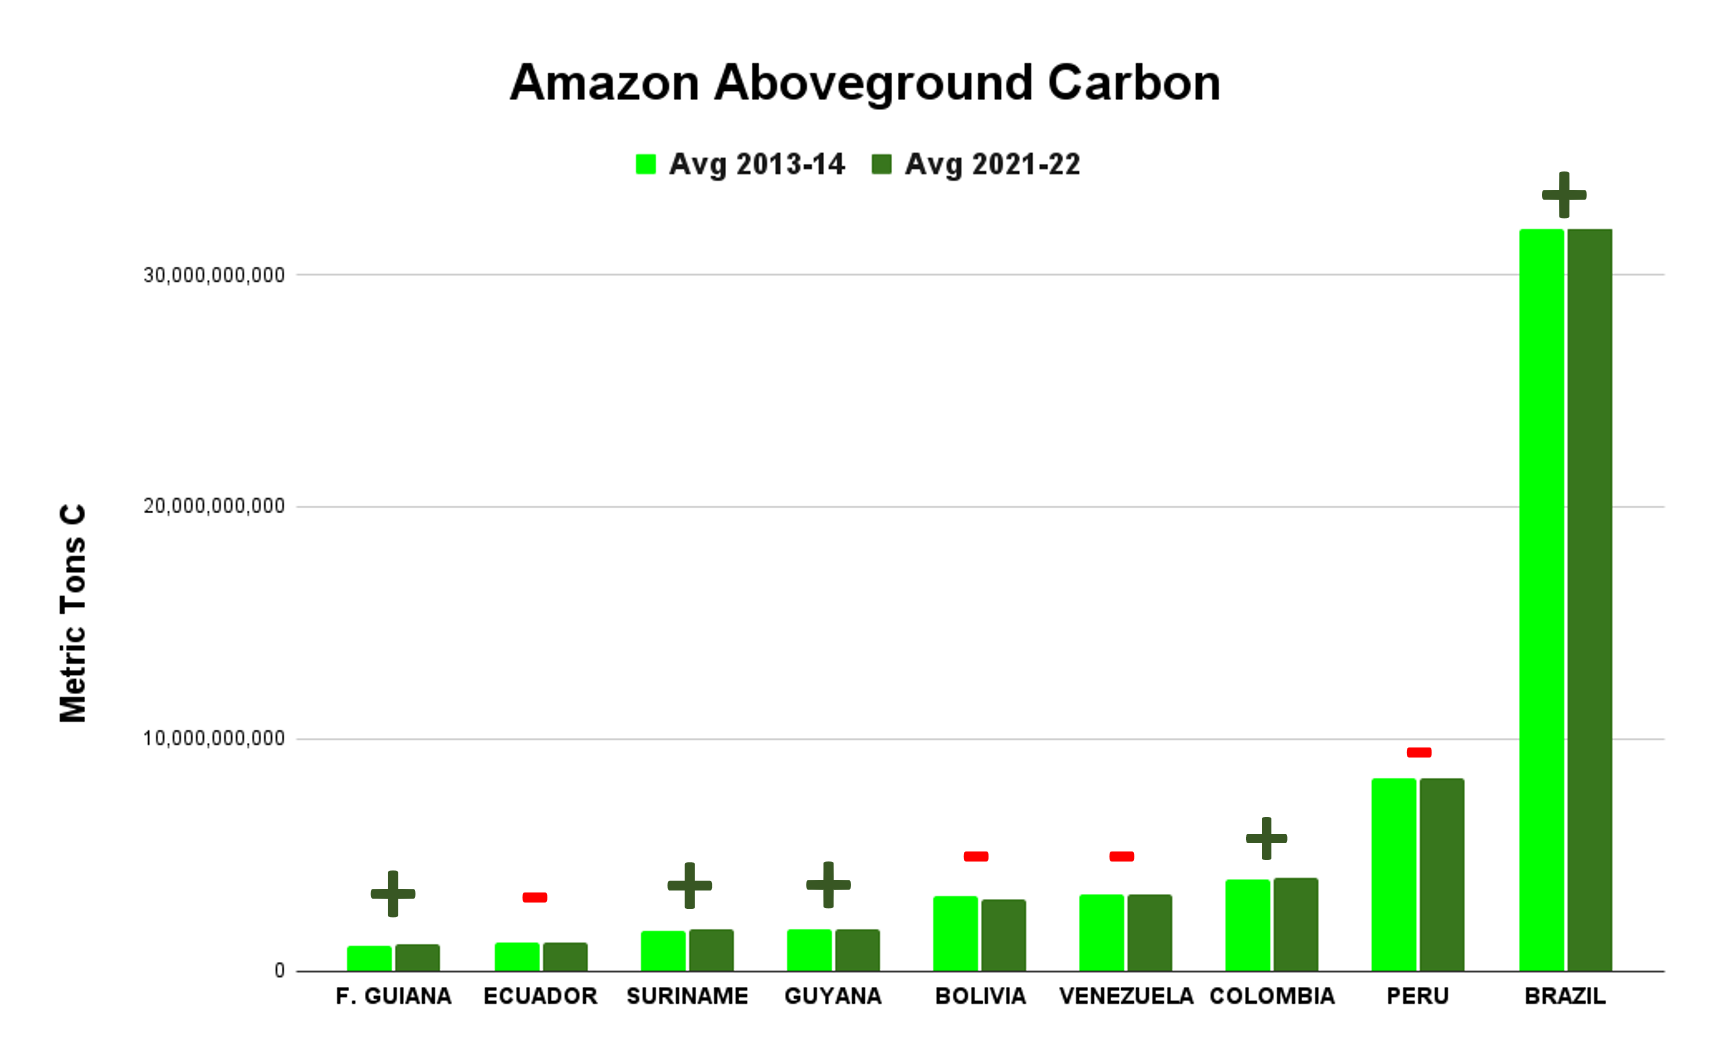
As shown in Graph 1, countries with the most aboveground carbon are 1) Brazil (57%; 32.1 billion metric tons), 2) Peru (15%; 8.3 billion metric tons), 3) Colombia (7%; 4 billion metric tons), 4) Venezuela (6%; 3.3 billion metric tons), and 5) Bolivia (6%; 3.2 billion metric tons). These countries are followed by Guyana (3%; 2 billion metric tons), Suriname (3%; 1.6 billion metric tons), Ecuador (2%; 1.2 billion metric tons), and French Guiana (2%; 1.1 billion metric tons).

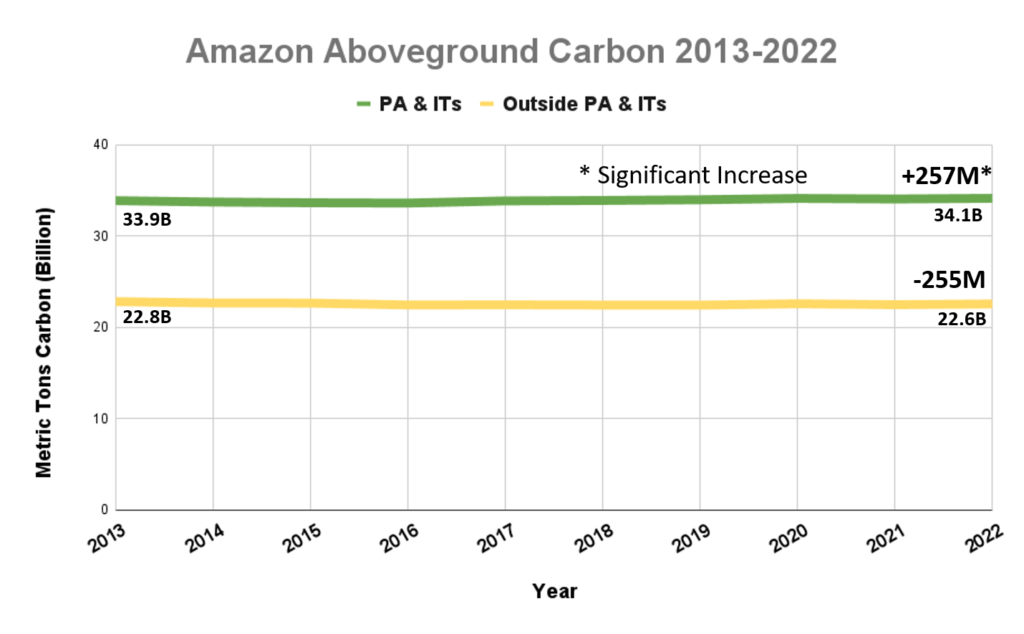
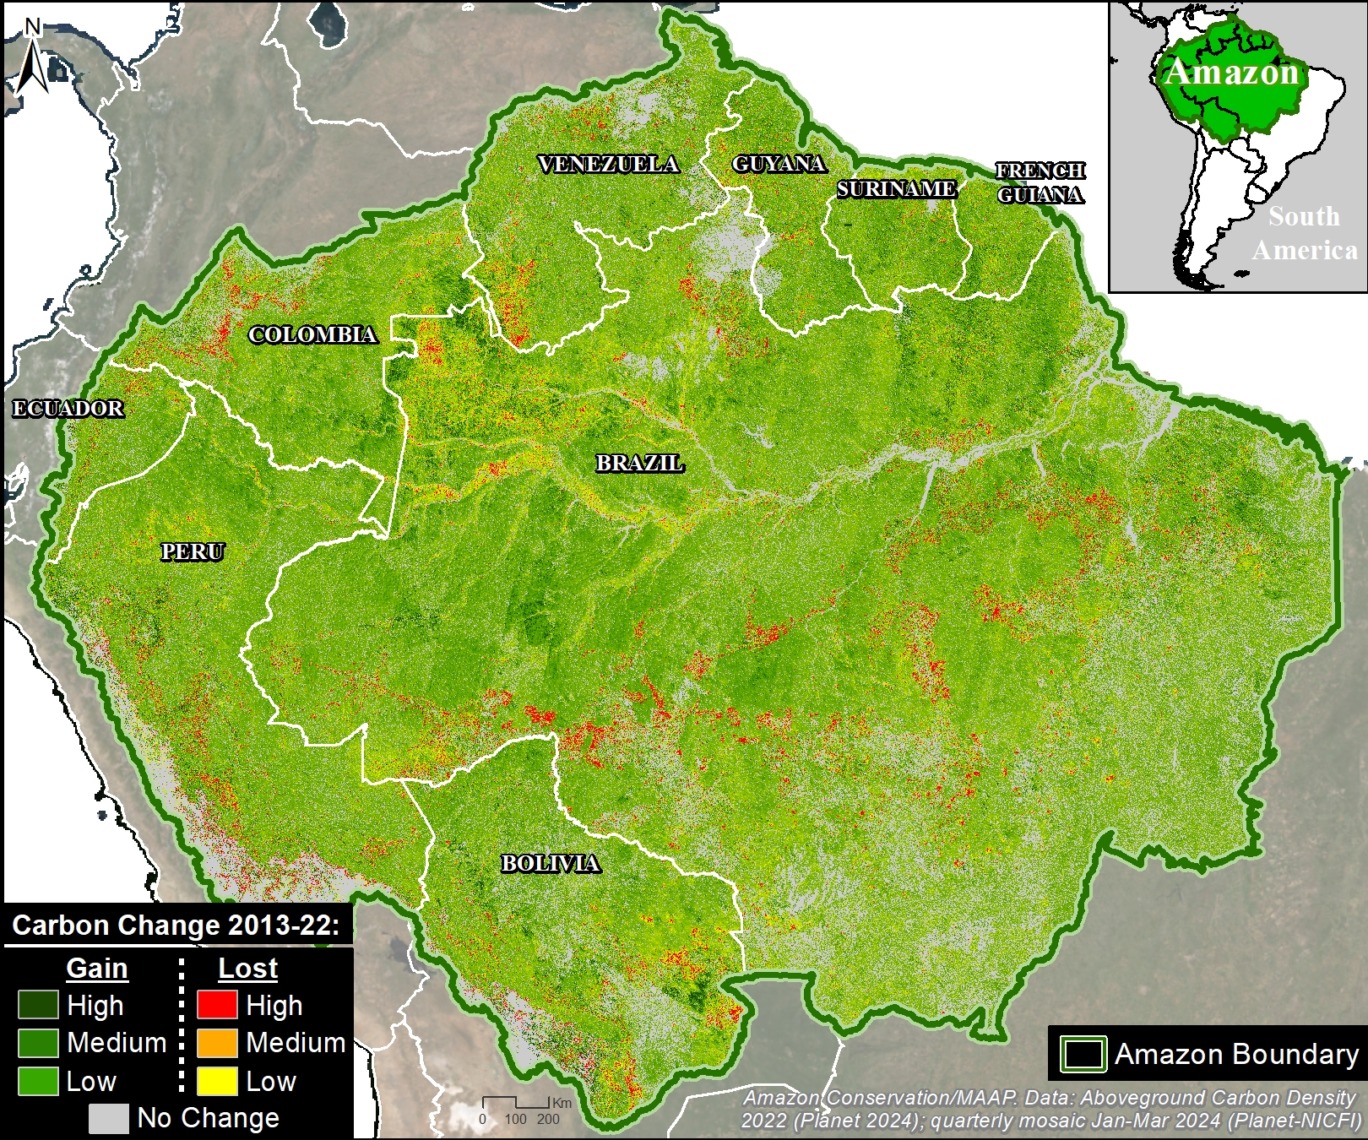
Overall, we documented the total gain of 64.7 million metric tons of aboveground carbon across the Amazon during the ten years between 2013 and 2022.2 In other words, the Amazon is still functioning as a critical carbon sink.

The countries with the most aboveground carbon gain over the past ten years are 1) Brazil, 2) Colombia, 3) Suriname, 4) Guyana, and 5) French Guiana. Note that we show Brazil as a carbon sink (gain of 102.8 million metric tons), despite other recent studies showing it as a carbon source.3 Also note the important gains in aboveground carbon across several key High Forest cover, Low Deforestation (HFLD) countries, namely Colombia, Suriname, Guyana, and French Guiana.4

In contrast, the countries with the most aboveground carbon loss over the past ten years are 1) Bolivia, 2) Venezuela, 3) Peru, and 4) Ecuador.

Graph 1. Planet Forest Carbon Diligence data across the Amazon biome, comparing 2013-14 with 2021-22. Note that a “+” symbol indicates that the country gained aboveground carbon, while a “-“ symbol indicates that the country lost aboveground carbon.

Carbon Density by Country

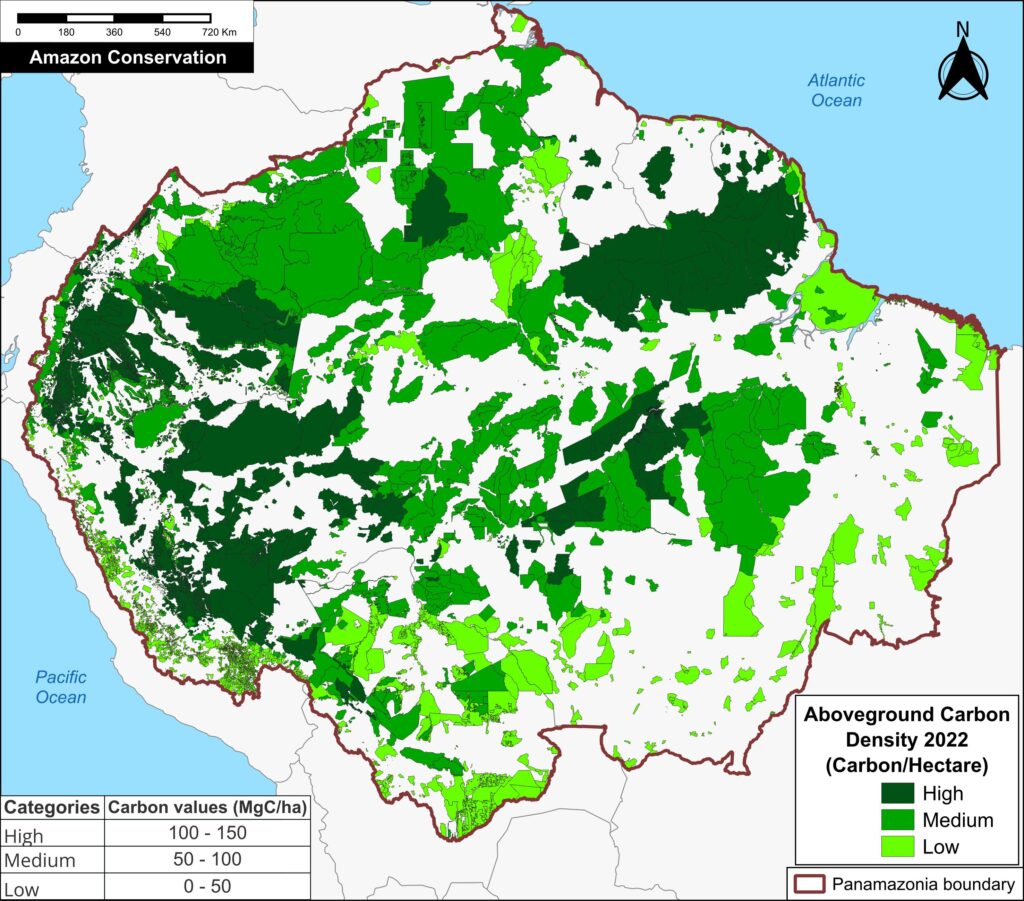
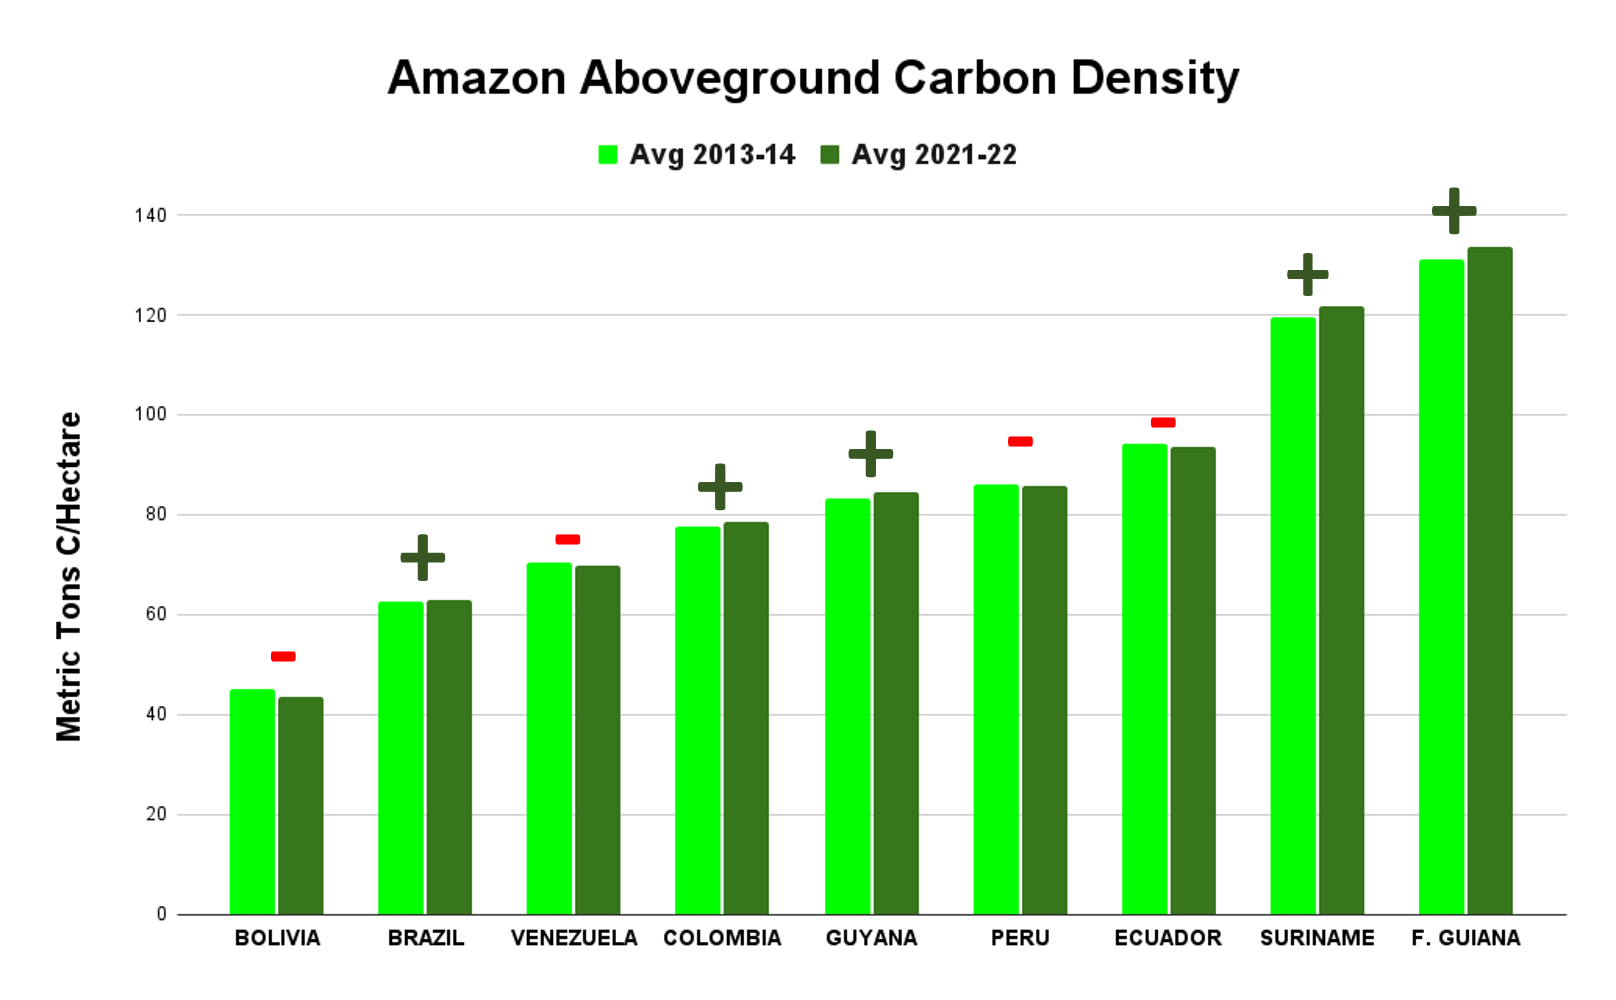
Standardizing for area, Graph 2 shows that countries with the highest aboveground carbon density (that is, aboveground carbon per hectare as of 2021-22) are located in the northeast Amazon: French Guiana (134 metric tons/hectare), Suriname (122 metric tons/hectare), and Guyana (85 metric tons/hectare). Ecuador is also high (94 metric tons/hectare).

Note that countries in the northeast Amazon (French Guiana, Suriname, and Guyana) have lower total aboveground carbon due to their smaller size (Graph 1), but high aboveground carbon density per hectare (Graph 2). This also applies to Ecuador.

Graph 2. Planet Forest Carbon Diligence data for aboveground carbon density by country across the Amazon, comparing 2013-14 with 2021-22. Note that a “+” symbol indicates that the country gained aboveground carbon, while a “-“ symbol indicates that the country lost aboveground carbon.

Notes & Citations

1 Anderson C (2024) Forest Carbon Diligence: Breaking Down The Validation And Intercomparison Report. https://www.planet.com/pulse/forest-carbon-diligence-breaking-down-the-validation-and-intercomparison-report/

2 In terms of uncertainty, the data contains pixel-level estimates, but not yet at national levels. To minimize annual uncertainty at the country level, we averaged 2013 and 2014 for the baseline and 2021 and 2022 for the current state.

3 Recently, in MAAP #144, we showed Brazil as a carbon source, based on data from 2001 to 2020. In contrast, Planet Forest Carbon Diligence is based on data from 2013 to 2022. Thus, one interpretation of the difference is that most carbon loss occurred in the first decade of the 2000s, which is consistent with historical deforestation data showing peaks in the early 2000s. It also highlights the likely importance of the interplay between forest loss/degradation (carbon loss) and forest regeneration (carbon gain) in terms of whether a country is a carbon source or sink during a given timeframe.

4 HFDL, or “High Forest cover, Low Deforestation” describes countries with both a) high forest cover (>50%) and low deforestation rates (<0.22% per year). For more information on HFDL, see https://www.conservation.org/blog/what-on-earth-is-hfld-hint-its-about-forests

5 Annual carbon dioxide (CO₂) emissions worldwide from 1940 to 2023

Citation

Finer M, Mamani N, Anderson C, Rosenthal A (2024) Unprecedented Look at Carbon across the Amazon. MAAP  #215.


MAAP #213: Estimating Carbon in Amazon Protected Areas & Indigenous Territories

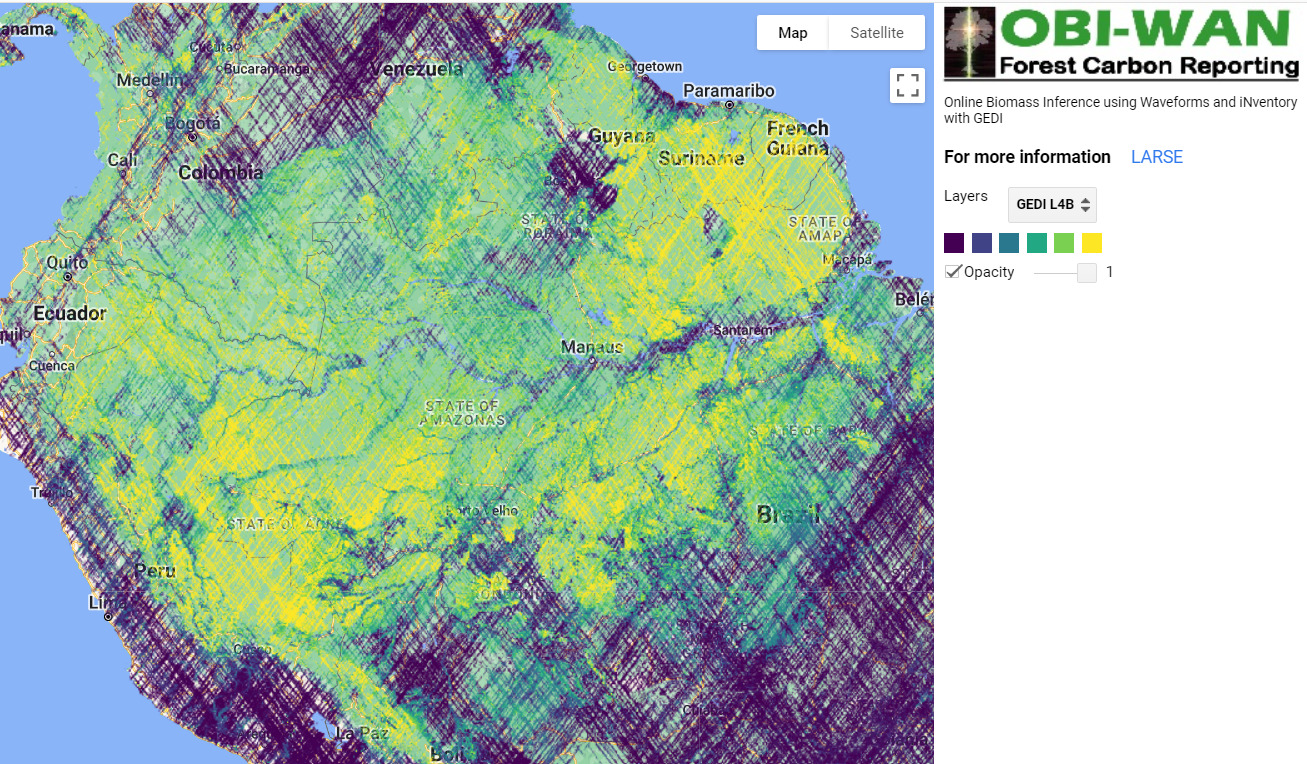
Intro Image. Screenshot of OBI-WAN forest carbon reporting app.
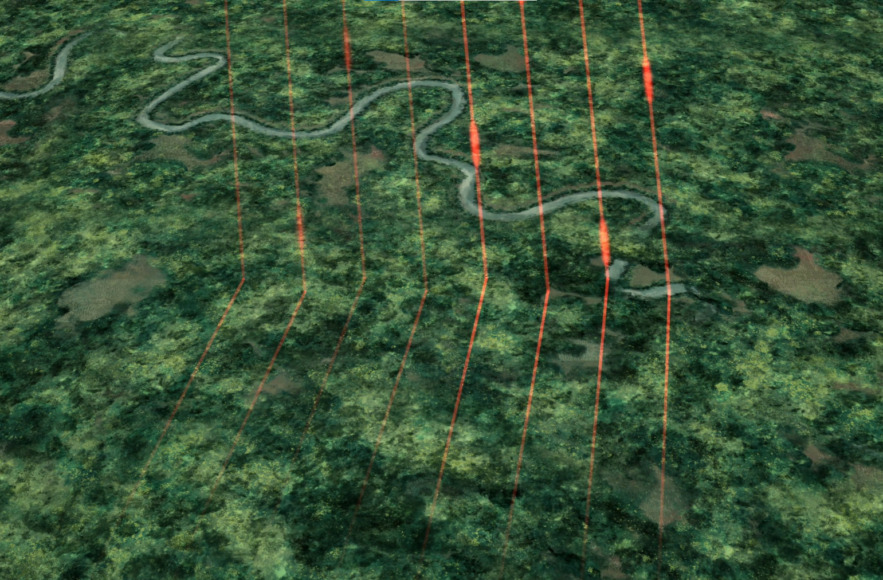
In a recent report (MAAP #199), we presented the updated version of NASA’s GEDI data,1 which uses lasers aboard the International Space Station to provide cutting-edge estimates of aboveground carbon globally, including our focal area, the Amazon.

These lasers, however, have not yet achieved full coverage, leaving considerable gaps in the data and resulting maps.

Here, we feature two new tools that allow us to fill in these gaps and provide detailed wall-to-wall estimates of aboveground biomass for specific areas, which can then be converted to aboveground carbon estimates.

The first is the OBI-WAN forest carbon reporting app (see Intro Image), which uses statistical inference to produce mean, total, and uncertainty estimates for biomass baselines at any given scale (from local to worldwide).2

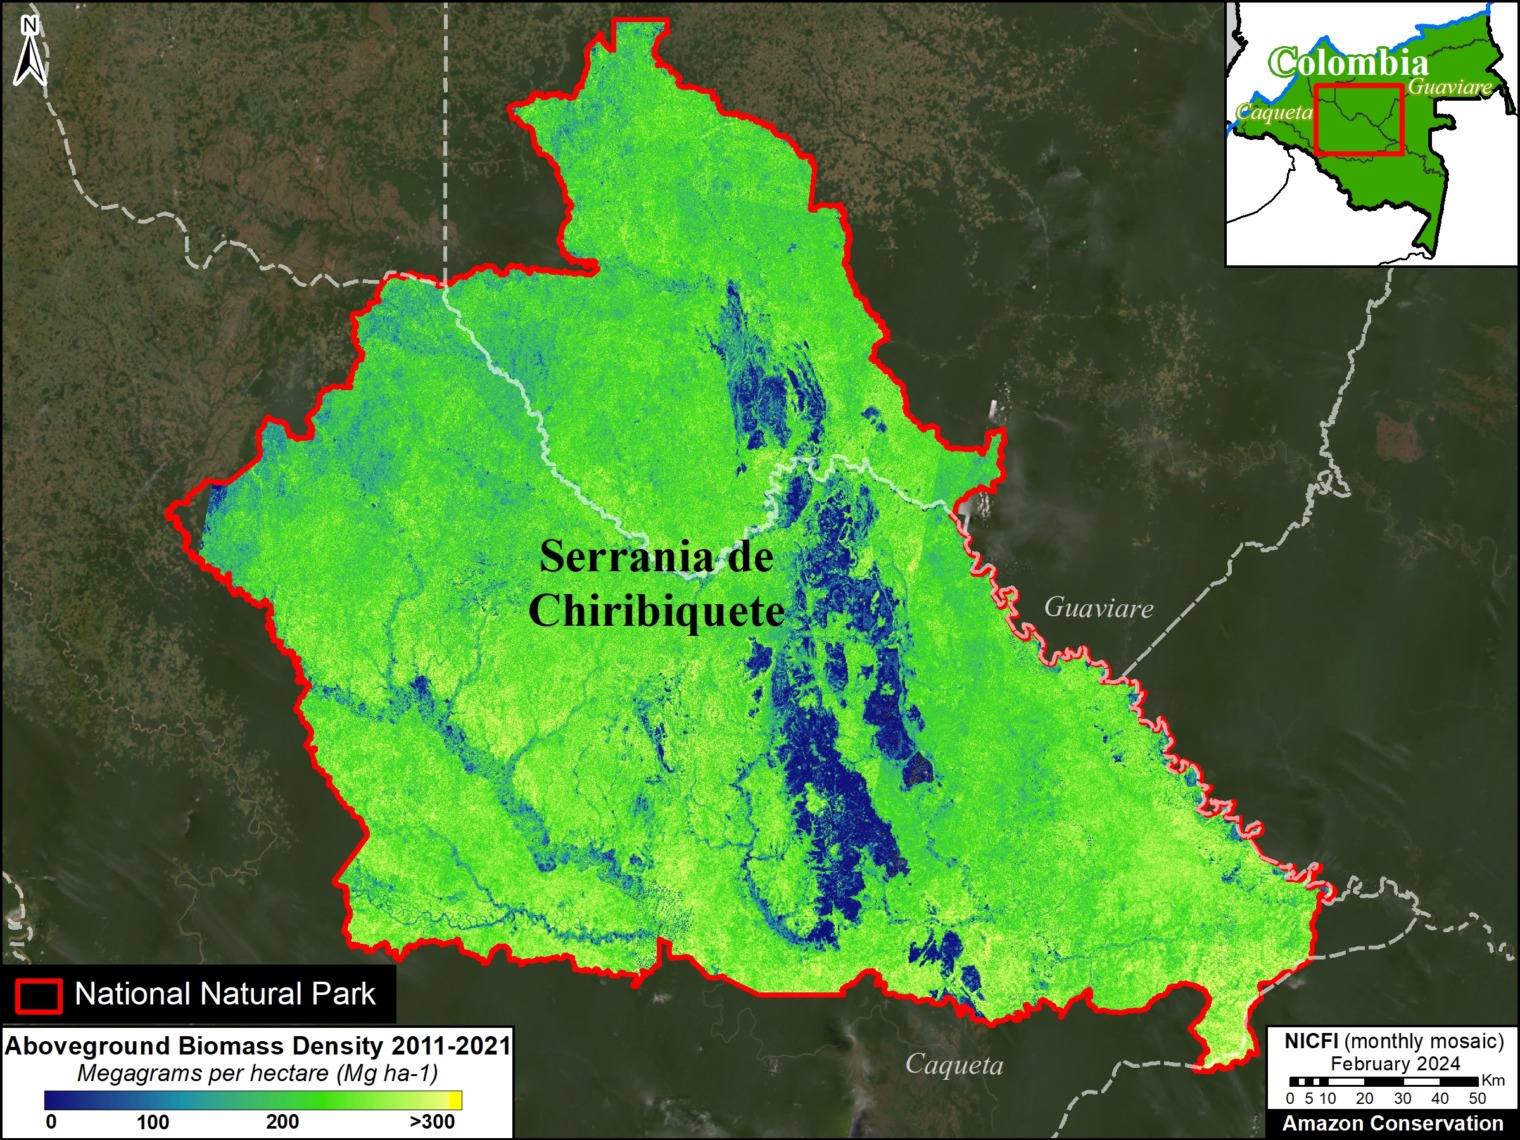
The second is a fused product from GEDI and TanDEM-X missions.3 The combination of lidar (GEDI) and radar (TanDEM-X) has started to produce unmatched maps that combine the ability of lidar to retrieve forest structure and the ability of radar to offer wall-to-wall coverage at multiple resolutions (see Figures 1-5 below for examples at 25m resolution).

Employing these two tools, we focus on estimating aboveground carbon for select examples of two critical land designations in the Amazon: protected areas and indigenous territories. Both are critical to the long-term conservation of the core Amazon (MAAP #183). We hope that providing precise carbon data will provide additional incentives for their long-term conservation.

We select 5 focal areas (3 National Parks and 2 Indigenous Territories; see list below) across the Amazon to demonstrate the power of these datasets. Together, these five areas are currently home to over 1.4 billion metric tons of aboveground carbon.

  • Protected Areas (National Parks)
    Chirbiquete National Park (Colombian Amazon)
    Manu National Park (Peruvian Amazon)
    Madidi National Park (Bolivian Amazon)
    k
  • Indigenous Territories
    Kayapó Indigenous Territory (Brazilian Amazon)
    Barranco Chico Indigenous Territory (Peruvian Amazon)

Focal Areas

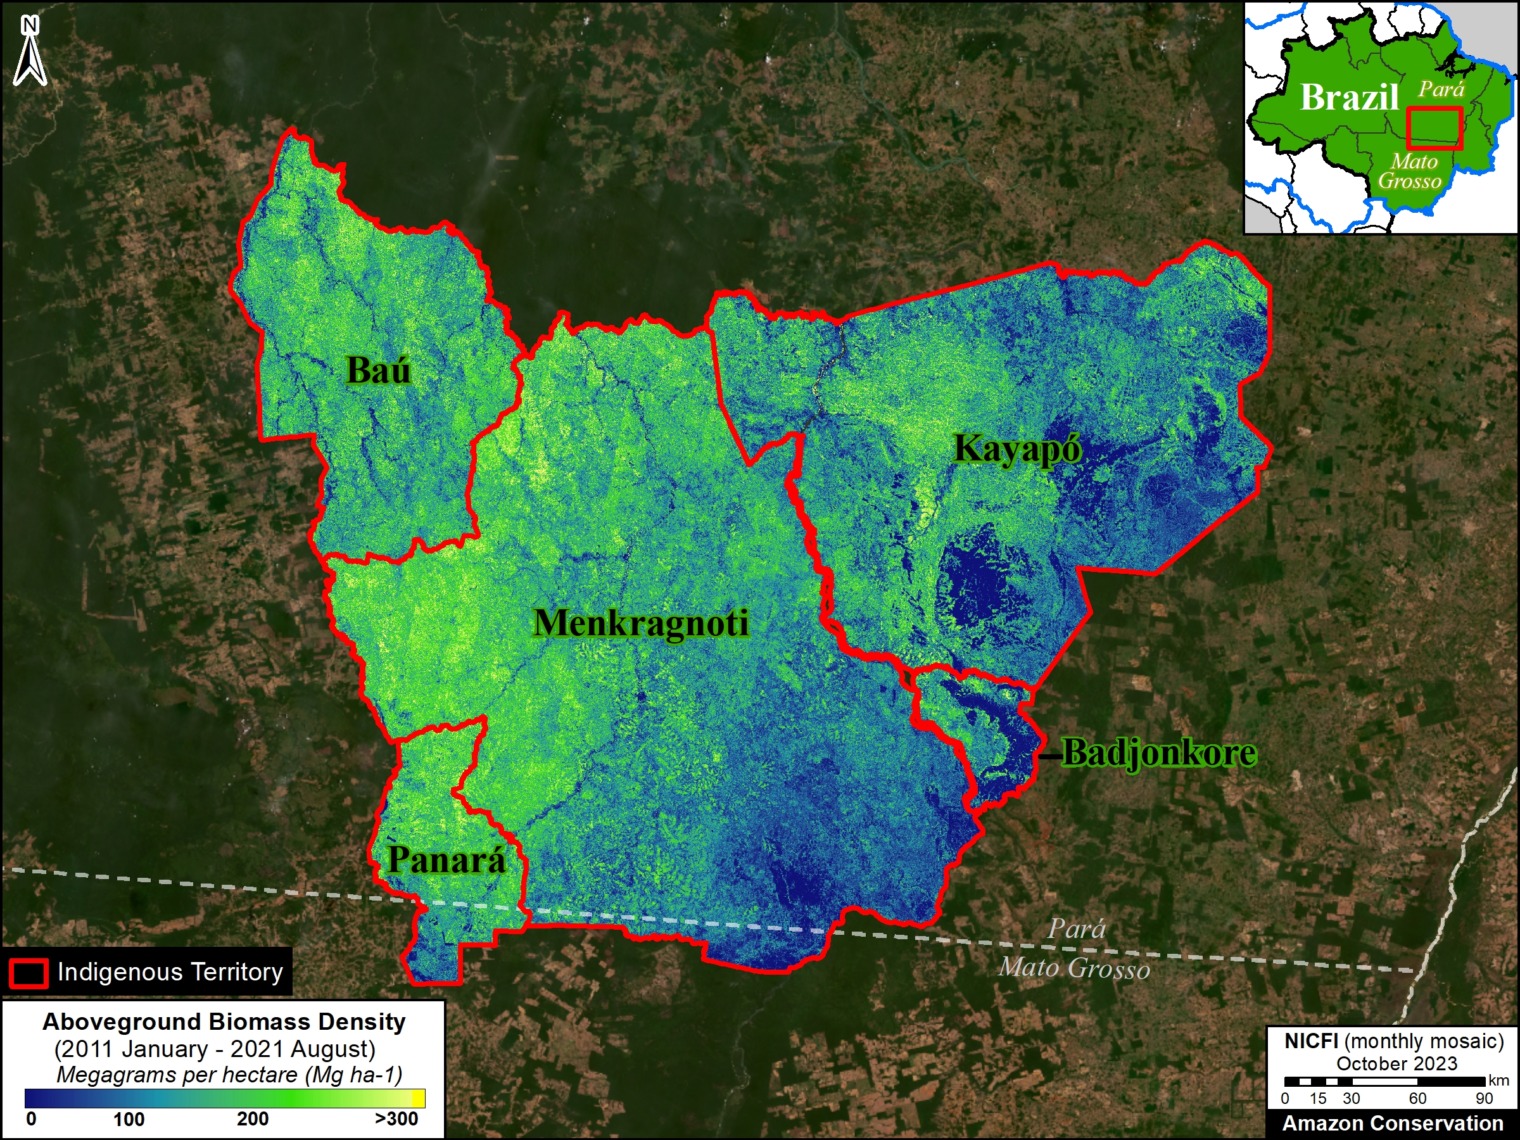
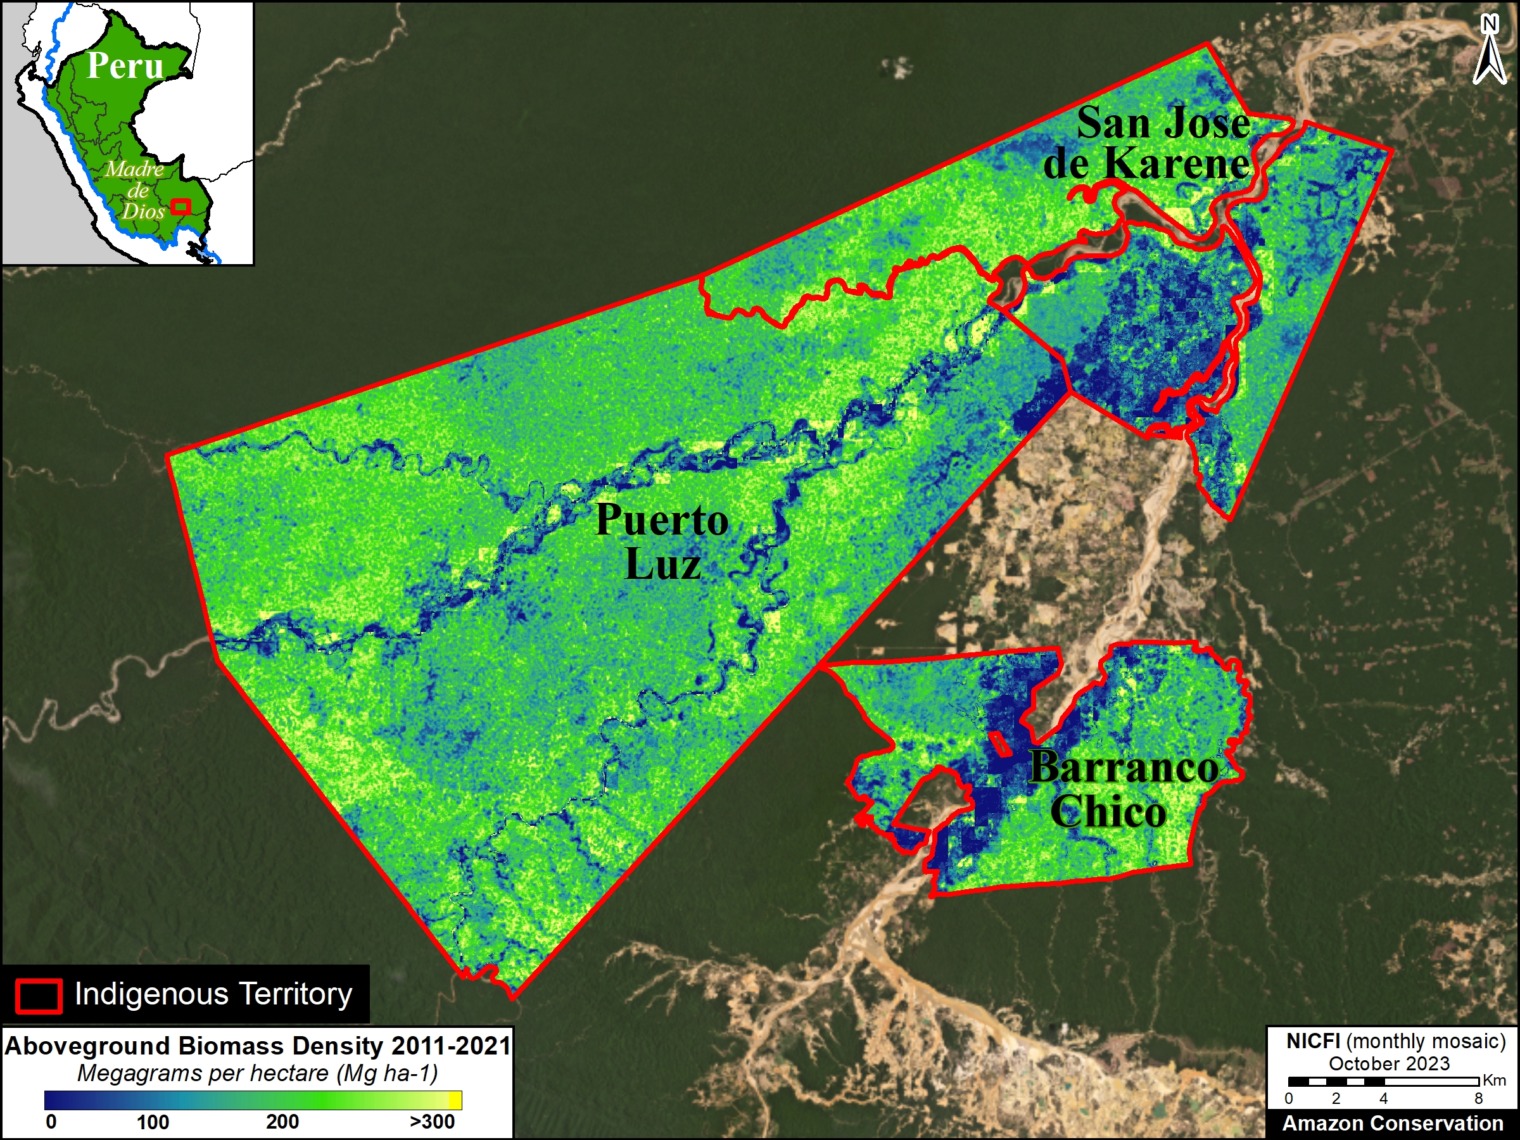
As noted above, the aboveground carbon estimates below are based on the aboveground biomass estimates from the OBI-WAN forest carbon reporting app and GEDI-TanDEM-X data. Figures 1 – 5 are based on GEDI-TanDEM-X, at 25 meter resolution.

National Parks

Chirbiquete National Park (Colombian Amazon)

Chirbiquete National Park covers over 4.2 million hectares in the heart of the Colombian Amazon (Guaviare and Caqueta departments). Both datasets converge in the estimate of around 600 metric tons of aboveground biomass, equating to over 300 million metric tons of aboveground carbon across the park (80.5 tons of carbon per hectare). Figure 1 shows the detailed spatial distribution of this biomass across Chirbiquete National Park. Note that the GEDI-TanDEM-X data misses the western tip of the park.

Figure 1. Aboveground biomass across Chiribiquete National Park (Colombian Amazon). Data: GEDI-TanDEM-X


Manu National Park (Peruvian Amazon)

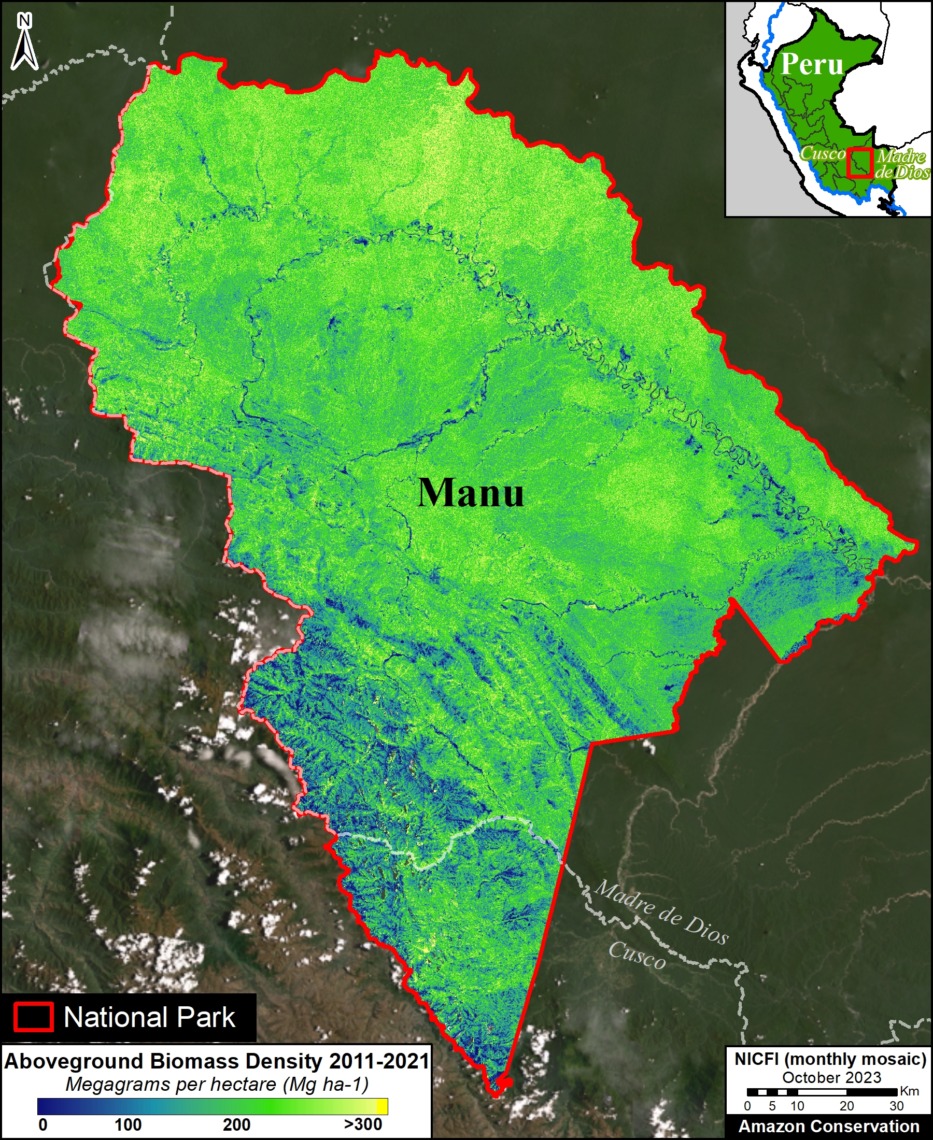
Figure 2. Aboveground biomass across Manu National Park (Peruvian Amazon). Data: GEDI-TanDEM-X

Manu National Park covers over 1.7 million hectares in the southern Peruvian Amazon (Madre de Dios and Cusco regions).

Both datasets converge in the estimate of over 450 metric tons of aboveground biomass, equating to over 215 million metric tons of aboveground carbon across the territory (126.8 tons of carbon per hectare).

Figure 2 shows the detailed spatial distribution of this biomass across Manu National Park.


Madidi National Park (Bolivian Amazon)

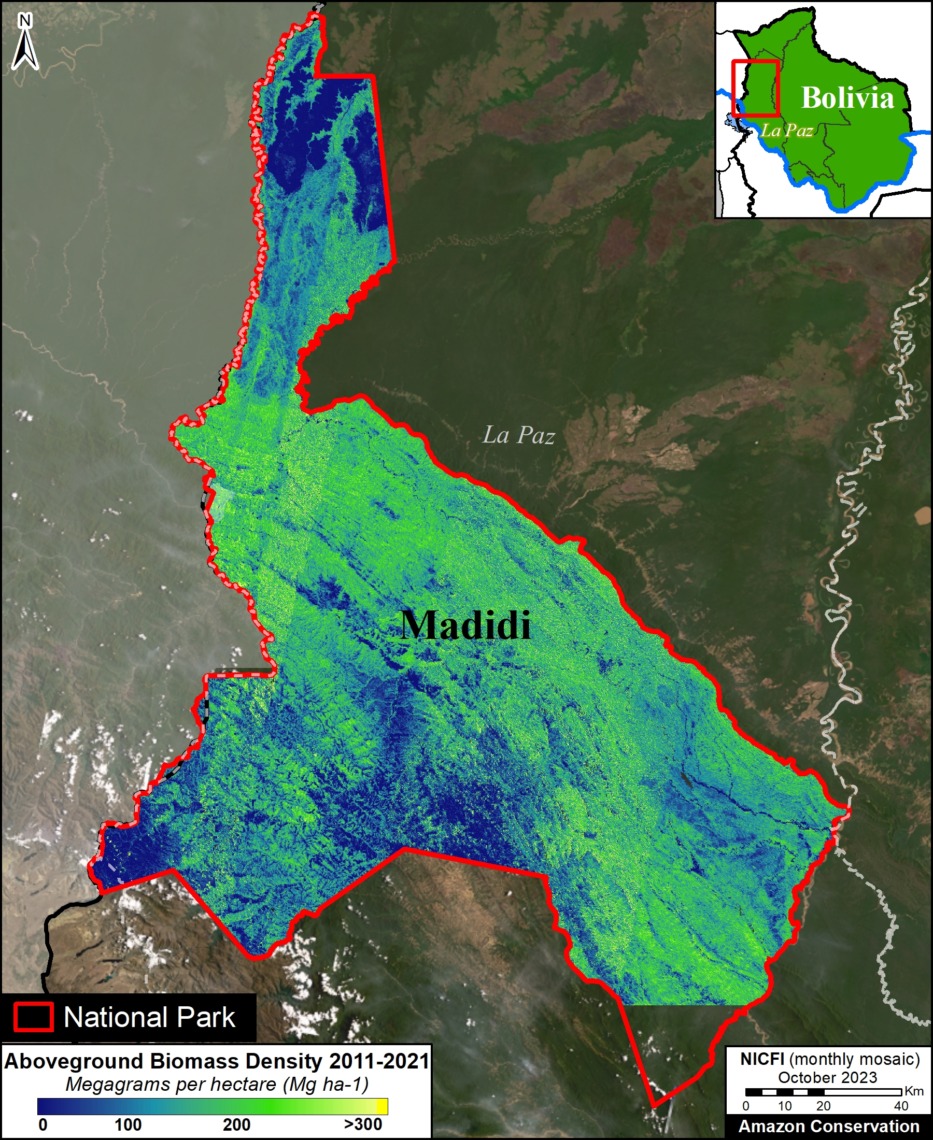
Figure 3. Aboveground biomass across Madidi National Park (Bolivian Amazon). Data: GEDI-TanDEM-X

Madidi National Park and Integrated Management Area covers over 1.8 million hectares in the western Bolivian Amazon (La Paz department).

Both datasets converge in the estimate of over 350 metric tons of aboveground biomass, equating to over 160 million metric tons of aboveground carbon across the park (85.3 tons of carbon per hectare).

Figure 3 shows the detailed spatial distribution of this biomass across Madidi National Park. Note that the GEDI-TanDEM-X data misses the southern tip of the park.


Indigenous Territories

Kayapó Indigenous Territory (Brazilian Amazon)

Kayapó Indigenous Territory covers over 3.2 million hectares in the eastern Brazilian Amazon (Pará state). Both datasets converge in the estimate of over 413,000 metric tons of aboveground biomass, equating to over 198 million metric tons of aboveground carbon across the territory. Figure 4 shows the detailed spatial distribution of this biomass across Kayapó and four neighboring Indigenous Territories. Totaling across these five territories (10.4 million hectares), the data sets converge on over 1.5 billion metric tons of aboveground biomass, and 730 million metric tons of aboveground carbon (70 tons per hectare).

Figure 4. Aboveground biomass across Kayapó and neighboring Indigenous Territories (Brazilian Amazon). Data: GEDI-TanDEM-X

Barranco Chico Indigenous Territory (Peruvian Amazon)

Barranco Chico Indigenous Territory covers over 12,600 hectares in the southern Peruvian Amazon (Madre de Dios region). Both datasets converge in the estimate of over 2 million metric tons of aboveground biomass, equating to over 1 million metric tons of aboveground carbon. Figure 5 shows the detailed spatial distribution of this biomass across Barranco Chico and two neighboring Indigenous Territories (Puerto Luz and San Jose de Karene). Totaling across these three territories (nearly 90,000 hectares), the data sets converge on over 19 million metric tons of aboveground biomass, and over 9 million metric tons of aboveground carbon (102 tons per hectare).

Figure 5. Aboveground biomass across Barranco Chico and neighboring Indigenous Territories (Peruvian Amazon). Data: GEDI-TanDEM-X

Notes

1 GEDI L4B Gridded Aboveground Biomass Density, Version 2.1. This data is measured in megagrams of aboveground biomass per hectare (Mg/ha) at a 1-kilometer resolution, with the period of April 2019 – March 2023. This serves as our estimate for aboveground carbon reserves, with the science-based assumption that 48% of recorded biomass is carbon.

The approach relies on the foundational paper from Patterson et al., (2019) and it is used by the GEDI mission to estimate mean and total biomass worldwide (Dubayh et al., 2022, Armston et al., 2023). The method considers the spatial distribution of GEDI tracks within a given user-specify boundary to infer the sampling error component of the total uncertainty that also includes the error from the GEDI L4A models used to predict biomass from canopy height estimates (Keller et al., 2022). For more information on the OBI-WAN app, see Healey and Yang 2022.

3 GEDI-TanDEM-X (GTDX) is a fusion of GEDI Version 2 and TanDEM-X (TDX) Interferometric Synthetic Aperture Radar (InSAR) images (from Jan 2011 to December 2020). It also incorporates annual forest loss data to account for deforestation during this time. The GTDX aboveground biomass maps were produced based on a generalized hierarchical model-based (GHMB) framework that utilizes GEDI biomass as training data to establish models for estimating biomass based on the GTDX canopy height. The combination of lidar (GEDI) and radar (TanDEM-X) has started to produce unmatched maps that combine the ability of lidar to retrieve forest structure and the ability of radar to offer wall-to-wall coverage (Qi et al.,2023, Dubayah et a;., 2023). This fused product is a wall-to-wall gap-free map that was produced at multiple resolutions: 25m, 100m and 1ha. Ongoing processing over the Pantropic region will be made available over the next months but some geographies have been already mapped such as most of the Amazon Basin (Dubayah et al., 2023). The data we used is publicly available.

References

Armston, J., Dubayah, R. O., Healey, S. P., Yang, Z., Patterson, P. L., Saarela, S., Stahl, G., Duncanson, L., Kellner, J. R., Pascual, A., & Bruening, J. (2023). Global Ecosystem Dynamics Investigation (GEDI)GEDI L4B Country-level Summaries of Aboveground Biomass [CSV]. 0 MB. https://doi.org/10.3334/ORNLDAAC/2321

Dubayah, R. O., Armston, J., Healey, S. P., Yang, Z., Patterson, P. L., Saarela, S., Stahl, G., Duncanson, L., Kellner, J. R., Bruening, J., & Pascual, A. (2023). Global Ecosystem Dynamics Investigation (GEDI)GEDI L4B Gridded Aboveground Biomass Density, Version 2.1 [COG]. 0 MB. https://doi.org/10.3334/ORNLDAAC/2299

Dubayah, R., Armston, J., Healey, S. P., Bruening, J. M., Patterson, P. L., Kellner, J. R., Duncanson, L., Saarela, S., Ståhl, G., Yang, Z., Tang, H., Blair, J. B., Fatoyinbo, L., Goetz, S., Hancock, S., Hansen, M., Hofton, M., Hurtt, G., & Luthcke, S. (2022). GEDI launches a new era of biomass inference from space. Environmental Research Letters, 17(9), 095001. https://doi.org/10.1088/1748-9326/ac8694

Dubayah, R., Blair, J. B., Goetz, S., Fatoyinbo, L., Hansen, M., Healey, S., Hofton, M., Hurtt, G., Kellner, J., Luthcke, S., Armston, J., Tang, H., Duncanson, L., Hancock, S., Jantz, P., Marselis, S., Patterson, P. L., Qi, W., & Silva, C. (2020). The Global Ecosystem Dynamics Investigation: High-resolution laser ranging of the Earth’s forests and topography. Science of Remote Sensing, 1, 100002. https://doi.org/10.1016/j.srs.2020.100002

Healey S, Yang Z (2022) The OBIWAN App: Estimating Property-Level Carbon Storage Using NASA’s GEDI Lidar. https://www.fs.usda.gov/research/rmrs/understory/obiwan-app-estimating-property-level-carbon-storage-using-nasas-gedi-lidar

Kellner, J. R., Armston, J., & Duncanson, L. (2022). Algorithm Theoretical Basis Document for GEDI Footprint Aboveground Biomass Density. Earth and Space Science, 10(4), e2022EA002516. https://doi.org/10.1029/2022EA002516

Dubayah, R.O., W. Qi, J. Armston, T. Fatoyinbo, K. Papathanassiou, M. Pardini, A. Stovall, C. Choi, and V. Cazcarra-Bes. 2023. Pantropical Forest Height and Biomass from GEDI and TanDEM-X Data Fusion. ORNL DAAC, Oak Ridge, Tennessee, USA. https://doi.org/10.3334/ORNLDAAC/2298

Qi, W., J. Armston, C. Choi, A. Stovall, S. Saarela, M. Pardini, L. Fatoyinbo, K. Papathanasiou, and R. Dubayah. 2023. Mapping large-scale pantropical forest canopy height by integrating GEDI lidar and TanDEM-X InSAR data. Research Square. https://doi.org/10.21203/rs.3.rs-3306982/v1

Krieger, G., M. Zink, M. Bachmann, B. Bräutigam, D. Schulze, M. Martone, P. Rizzoli, U. Steinbrecher, J. Walter Antony, F. De Zan, I. Hajnsek, K. Papathanassiou, F. Kugler, M. Rodriguez Cassola, M. Younis, S. Baumgartner, P. López-Dekker, P. Prats, and A. Moreira. 2013. TanDEM-X: A radar interferometer with two formation-flying satellites. Acta Astronautica 89:83–98. https://doi.org/10.1016/j.actaastro.2013.03.008

Acknowledgments

We greatly thank the University of Maryland’s GEDI team for data access and reviewing this report. In particular, we thank Ralph Dubayah, Matheus Nunes, and Sean Healey.

Citation

Mamani N, Pascual A, Finer M (2024) Estimating Carbon in Amazon Protected Areas & Indigenous Territories. MAAP: 213

MAAP #199: Amazon Carbon Update, based on NASA’s GEDI Mission

As we approach the COP28 climate summit, starting in Dubai in late November, we provide here a concise update on the current state of remaining Amazon carbon reserves.

We present the newly updated version of NASA’s GEDI data1, which uses lasers aboard the International Space Station to provide cutting-edge estimates of aboveground biomass density on a global scale.

Here, we zoom in on the Amazon and take a first look at the newly updated data, which covers the time period of April 2019 – March 2023.2

This data, which is measured in megagrams of aboveground biomass per hectare (Mg/ha) at a 1-kilometer resolution, serves as our estimate for aboveground carbon reserves.

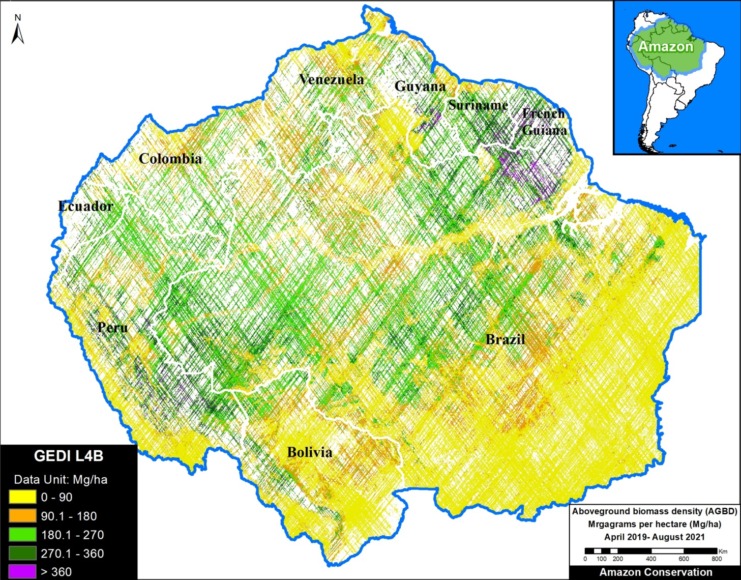
Figure 1 displays aboveground biomass across the Amazon biome. Note the highest carbon densities (indicated in bright yellow) are located in both the northeast Amazon and southwest Amazon.

Aboveground Biomass across the Amazon

Figure 2 also displays aboveground biomass across the Amazon biome, but this time with country boundaries and labels added.

Note that the peak biomass concentrations in the northeast Amazon include Suriname, French Guiana, and the northeast corner of Brazil. The peak biomass concentrations in the southwest Amazon are centered in southern Peru. Also note that many parts of Ecuador, Colombia, Venezuela, Guyana, Bolivia, Brazil, and northern Peru have high carbon densities as well.

Figure 2. Aboveground biomass density (carbon estimate) across the Amazon biome, with country boundaries. Data: NASA/GEDI, NICFI.

Carbon Estimates

We calculated over 78 billion metric tons of aboveground biomass across the Amazon biome (78,184,161,090 metric tons to be exact). Using a general assumption that 48% of this biomass is carbon3, we estimate over 37 billion metric tons of carbon across the Amazon (37,528,397,323 metric tons).

Note that these totals are likely underestimates given that the laser-based data has not yet achieved full coverage across the Amazon (that is, there are many areas where the lasers have not yet recorded data, leaving visible blanks in the maps above).

This is consistent with a previous study based on another independent dataset, where we estimated 6.7 billion metric tons of carbon in the Peruvian Amazon as of 2013 (MAAP #148). The current GEDI data estimates at least 5.3 billion metric tons in the Peruvian Amazon.

Carbon Sink

In a previous report, we showed that the Brazilian Amazon has become a net carbon source, whereas the total Amazon is still a net carbon sink (MAAP #144). Our current report goes one step further in terms of showing just how much carbon is left in that sink.

Notes

1GEDI L4B Gridded Aboveground Biomass Density, Version 2.1. https://daac.ornl.gov/cgi-bin/dsviewer.pl?ds_id=2299

2Note that we previously reported on the initial data release, which covered the time period of April 2019 – August 2021 (see MAAP #160).

3Domke et al (2022) How Much Carbon is in Tree Biomass?. USDA/Forest Service.

Acknowledgements

This work was supported by NORAD (Norwegian Agency for Development Cooperation) and ICFC (International Conservation Fund of Canada).

Citation

Mamani N, Finer M, Ariñez A (2022) Amazon Carbon Update, based on NASA’s GEDI Mission. MAAP: 199.

MAAP #160: Lasers Estimate Carbon in the Amazon – NASA’s GEDI Mission

Simulation of GEDI lasers collecting data. Source: UMD.

NASA’s GEDI mission uses lasers to provide cutting-edge estimates of aboveground biomass and related carbon on a global scale.

Launched in late 2018 and installed on the International Space Station, GEDI’s lasers return an estimate of aboveground biomass density at greater accuracy and resolution than previously available.

Here, we zoom in on the Amazon and take a first look at the recently available Level 4B data: Gridded Aboveground Biomass Density measured in megagrams per hectare (Mg/ha) at a 1-kilometer resolution.

See the GEDI homepage for more background information on the mission, which extends until January 2023. Be sure to check out this illustrative video.


Base Map – Aboveground Biomass in the Amazon

The Base Map displays the GEDI data for the nine countries of the Amazon biome, displaying aboveground biomass for the time period April 2019 to August 2021.

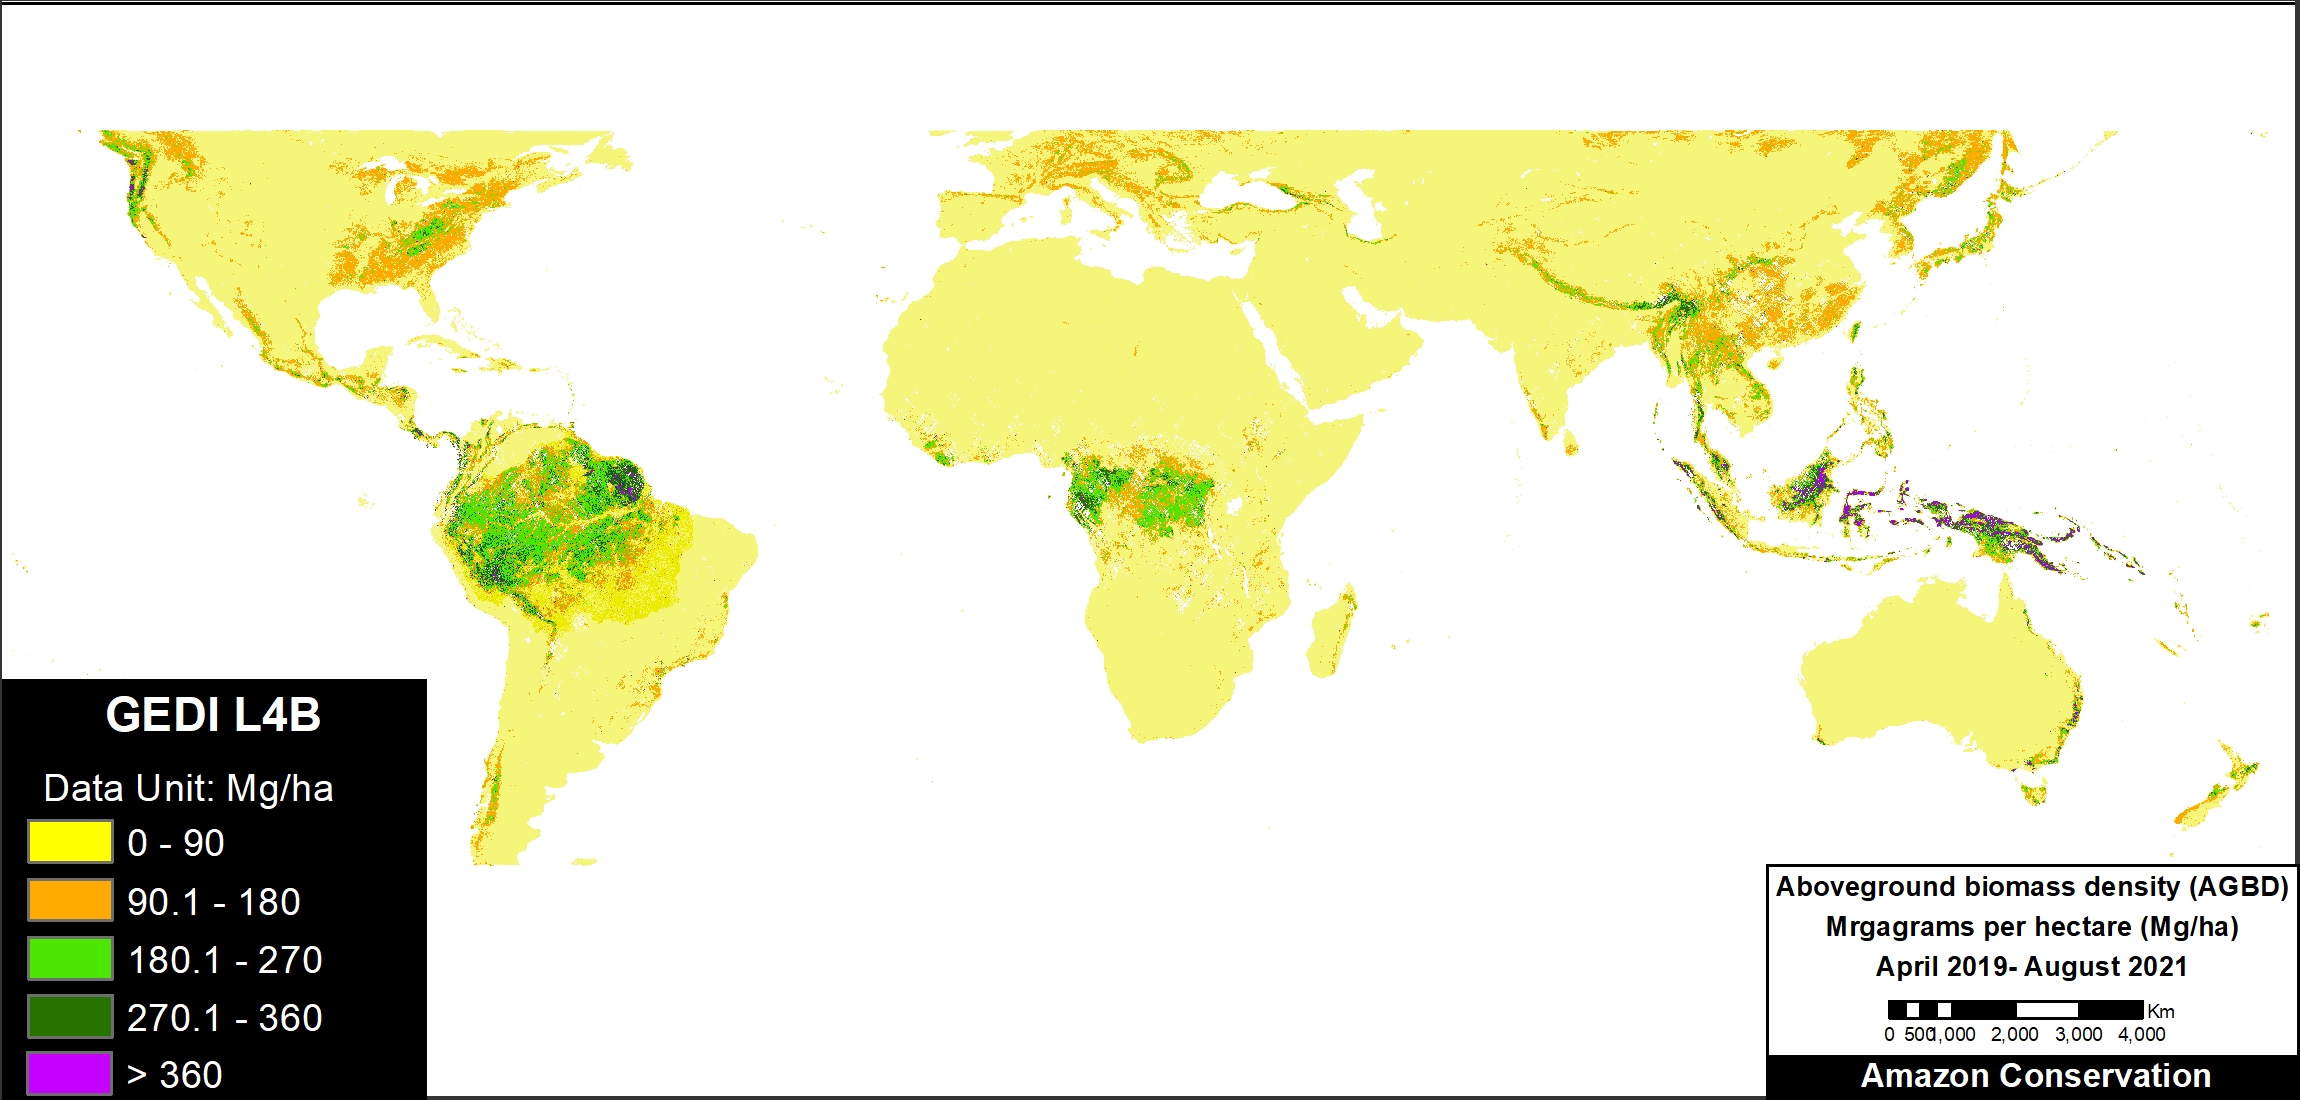
Base Map. Aboveground Biomass Density in the Amazon. Data: NASA/UMD GEDI L4B. Click twice to enlarge.


We highlight the following initial major findings:

  • The data is not yet comprehensive as there are some areas the lasers have not yet recorded data (indicated in white).
    h
  • The areas with the highest aboveground biomass and related carbon (indicated in dark green and purple) include:
    • Northeast Amazon: Corner of Brazil, Suriname, & French Guiana.
    • Southwest Amazon: Southwest Brazil and adjacent Peru (see zoom below).
    • Northwest Amazon: Northern Peru, Ecuador, and southeast Colombia.

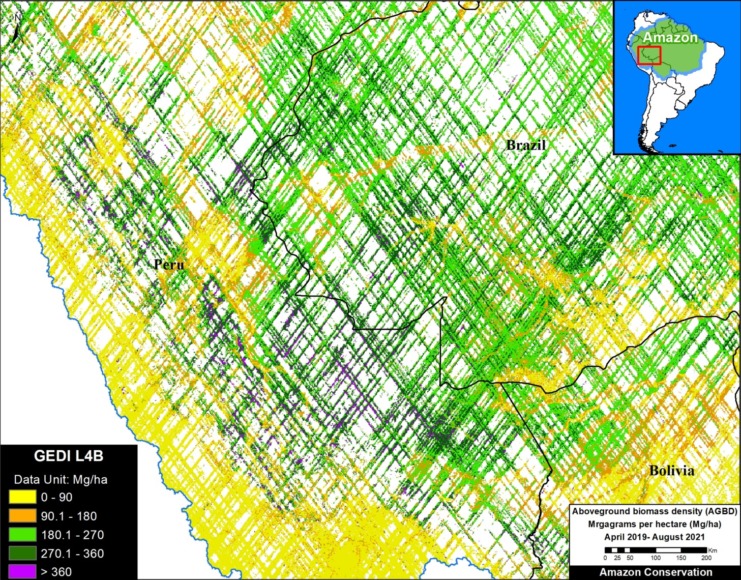
Zoom In – Southwest Amazon

To better visualize the GEDI laser data, we also present a zoom of the Southwest Amazon. Although deforested areas (and natural savannahs) are illustrated in yellow and orange, note the surrounding presence of high carbon forest (green and purple).

Zoom In – Southwest Amazon. Aboveground Biomass Density. Data: NASA/UMD GEDI L4B. Click twice to enlarge.

Zoom Out – Global Scale

Note that tropical forests, including the Amazon, have the highest levels of aboveground biomass globally.

Zoom Out – Glocal scale. Aboveground Biomass Density. Data: NASA/UMD GEDI L4B. Click twice to enlarge.

Acknowledgements

This work was supported by NORAD (Norwegian Agency for Development Cooperation) and ICFC (International Conservation Fund of Canada).

Citation

Finer M, Ariñez A (2022) Lasers Estimate Carbon in the Amazon – NASA’s GEDI Mission. MAAP: 160.

MAAP #148: Carbon loss & protection in the Peruvian Amazon

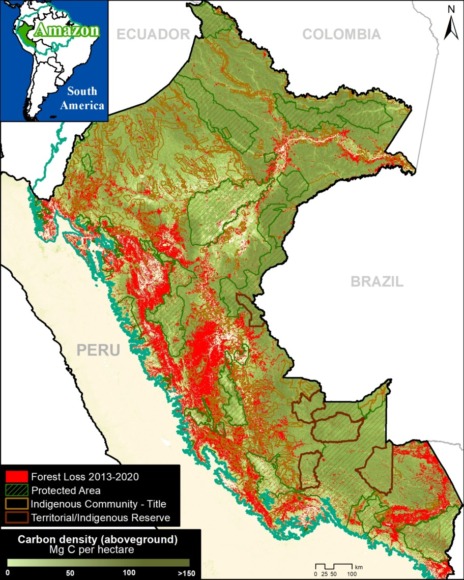
Base Map. Data: MINAM/PNCB, Asner et al 2014. Forest loss data exaggerated for visual display.

Tropical forests store massive amounts of carbon. However, when these forests are cleared (and often subsequently burned), the stored carbon is released into the atmosphere, further driving global climate change.

The Amazon is the world’s largest tropical forest, with Peru forming the second-largest piece, directly to the west of Brazil (the largest).

The Peruvian Amazon is unique in having a high-resolution estimate of aboveground carbon dating back to 2013 (Asner et al 2014).

Here, we analyze this dataset in relation to recent deforestation data (see Base Map), seeking to identify the major carbon-related trends between 2013 and 2020.

Our key findings include:

  • We estimate the loss of over 100 million metric tons of carbon (101,498,000 MgC) in the Peruvian Amazon between 2013 and 2020, mostly due to deforestation from agriculture and mining. 
    k
  • In contrast, we estimate that protected areas and indigenous lands have safeguarded 3.2 billion metric tons of carbon (56% and 44%, respectively) in the Peruvian Amazon between 2013 and 2020.

The carbon loss noted above is equivalent to greenhouse gas emissions from nearly 80 million passenger vehicles driven for one year, or CO2 emissions from 92 coal-fired power plants in one year (EPA).

The carbon protection noted above is equivalent to greenhouse gas emissions from 2.5 billion passenger vehicles driven for one year, or CO2 emissions from nearly 3,000 coal-fired power plants in one year (EPA).

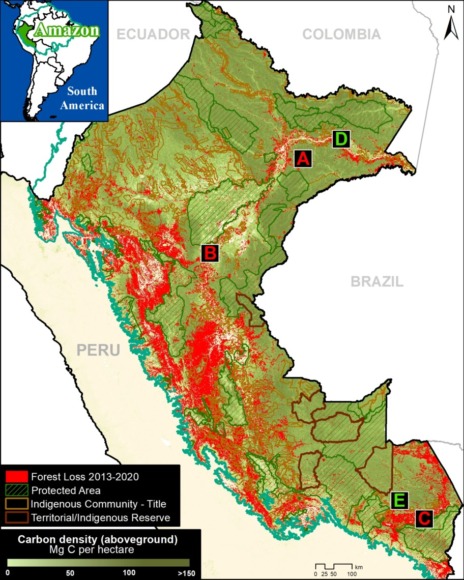
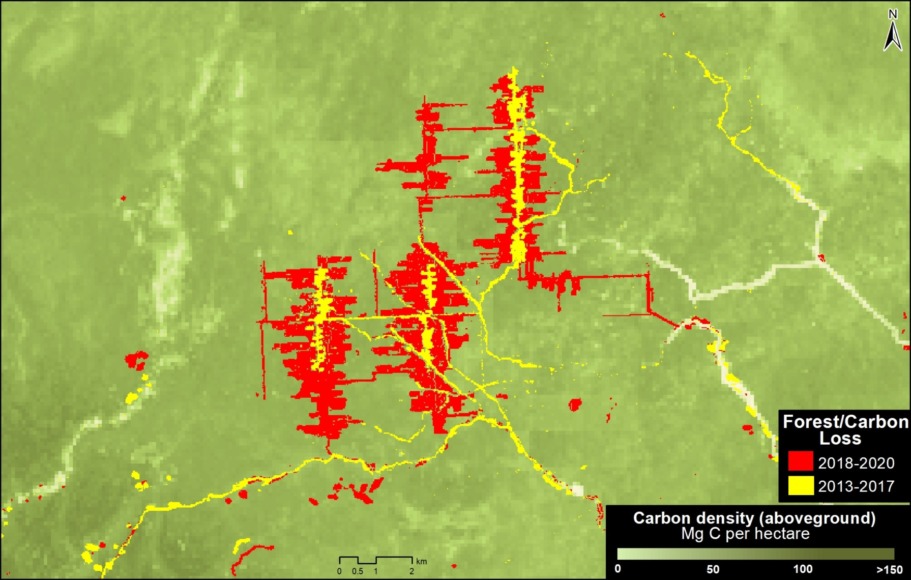
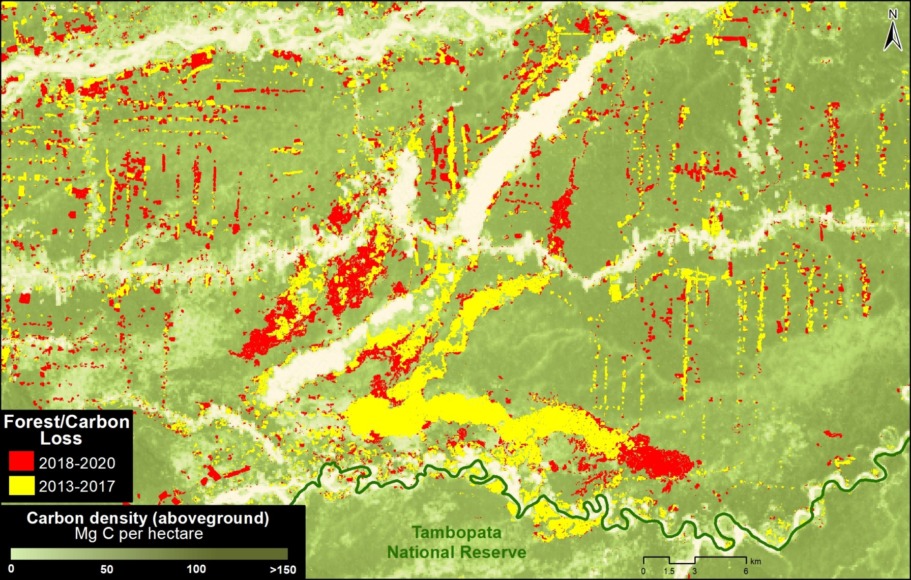
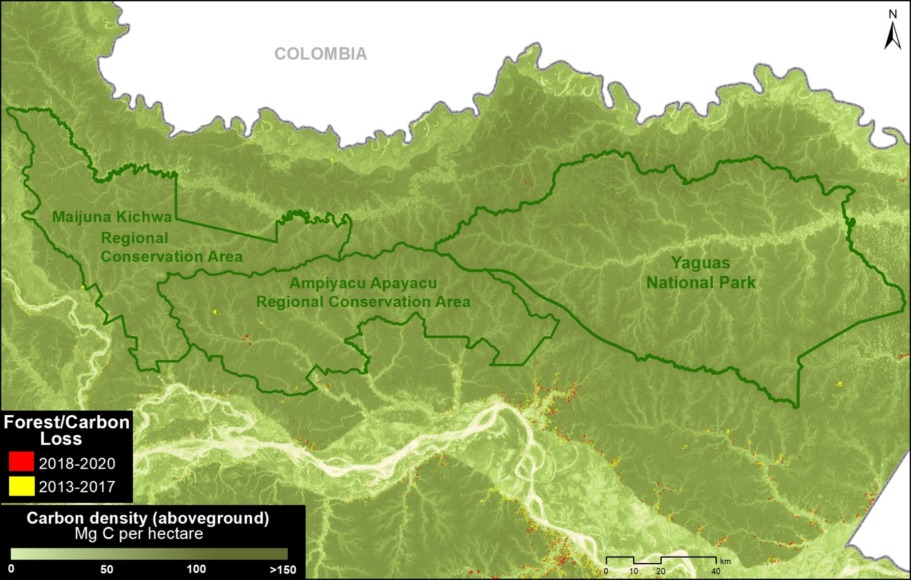
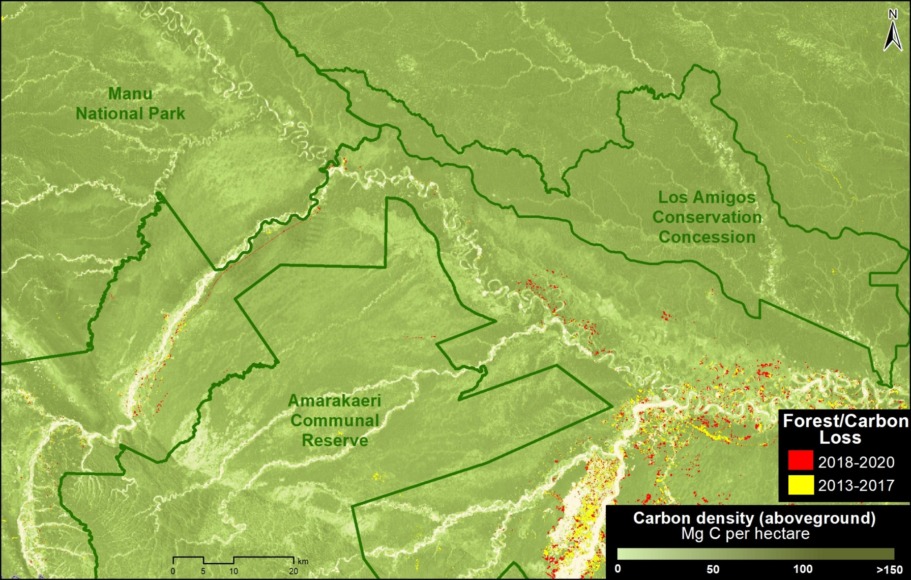
Reference Map. Location of zooms A-E.

Reference Map

Below, we present a series of zoom images of several key areas.

Zooms A-C highlight recent carbon loss due to deforestation (agriculture and mining) in high carbon density Amazon moist forests.

In contrast, Zooms D-E show how protected areas and indigenous lands are protecting massive amounts of carbon.

These letters (A-E) correspond to the reference map here.

Areas of Recent Carbon Loss

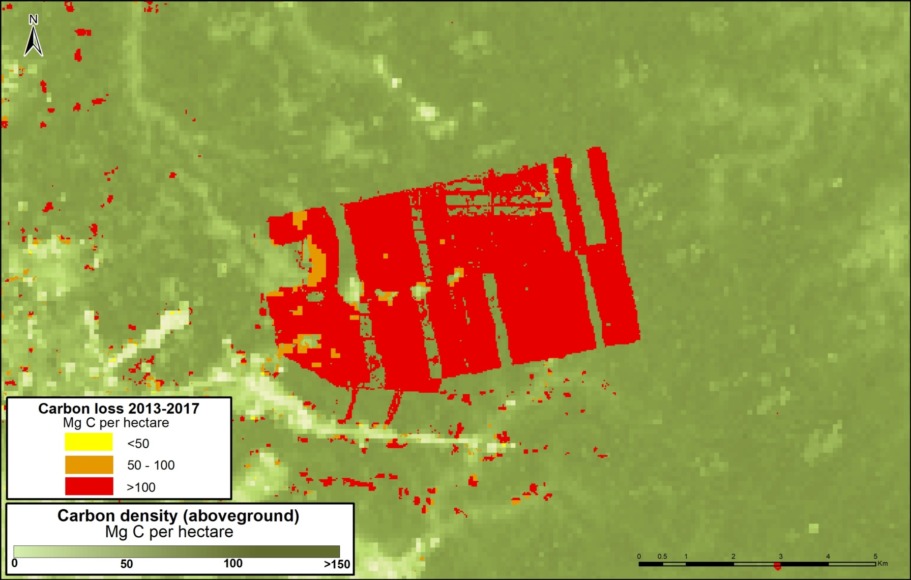
A. United Cacao

Zoom A shows the loss of nearly 300,000 metric tons of carbon for a large-scale cacao project (United Cacao) in the northern Peruvian Amazon (Loreto region).

Zoom A. United Cacao. Data: Asner et al 2014.

B. Mennonite Colony

Zoom B shows the recent deforestation and associated carbon loss for a new Mennonite colony in the central Peruvian Amazon (near the town of Tierra Blanca).

Zoom B. Mennonite Colony – Tierra Blanca. Data: MINAM/PNCB, Asner et al 2014.

C. Gold mining

Zoom C shows the loss of over 800,000 metric tons of carbon due to gold mining in the southern Peruvian Amazon (Madre de Dios region).

Zoom C. Gold mining in Madre de Dios region. Data: Asner et al 2014, MINAM/PNCB

Areas of Carbon Protection

D. Yaguas National Park

Zoom D shows how three protected areas, including the new Yaguas National Park, are effectively safeguarding over 200 million metric tons of carbon in the northeastern Peruvian Amazon.

Zoom D. Protected Areas in northeast Peru. Data: Asner et al 2014, MINAM/PNCB

E. Manu National Park

Zoom E shows how a group of protected areas (Manu National Park and Amarakaeri Communal Reserve) and the country’s first Conservation Concession (Los Amigos), is effectively safeguarding over 210 million metric tons of carbon in the southern Peruvian Amazon.

Zoom E. Protected Areas in southeast Peru. Data: Asner et al 2014, MINAM/PNCB

Methodology

This report combined two major datasets: 1) aboveground carbon from Asner et al 2014 and 2) annual forest loss identified by the Peruvian Environment Ministry’s National Forest Conservation Program (Geobosques) from the years 2013 to 2020.

The aboveground carbon data served as a baseline for 2013, and then we subsequently extracted the carbon data from the areas of forest loss from 2013-2020.

This process allowed us to obtain the carbon density (per hectare) in relation to the area of forest loss and then to estimate the total aboveground carbon stocks lost between 2013 and 2020.

The forest loss data values include some natural forest loss. Overall, however, they should be considered underestimates because they do not include forest degradation (for example, selective logging).

References

Asner GP et al (2014). The High-Resolution Carbon Geography of Perú. Carnegie Institution for Science.

EPA. Greenhouse Gas Equivalencies Calculator. https://www.epa.gov/energy/greenhouse-gas-equivalencies-calculator

Acknowledgements

We thank A. Folhadella, M. Hyde, ME Gutierrez, and G. Palacios for their helpful comments on this report.

This work was supported by NORAD (Norwegian Agency for Development Cooperation) and ICFC (International Conservation Fund of Canada).

Citation

Finer M, Mamani N (2021). Carbon loss & protection in the Peruvian Amazon. MAAP: 148.


MAAP #144: The Amazon & Climate Change: Carbon Sink vs Carbon Source

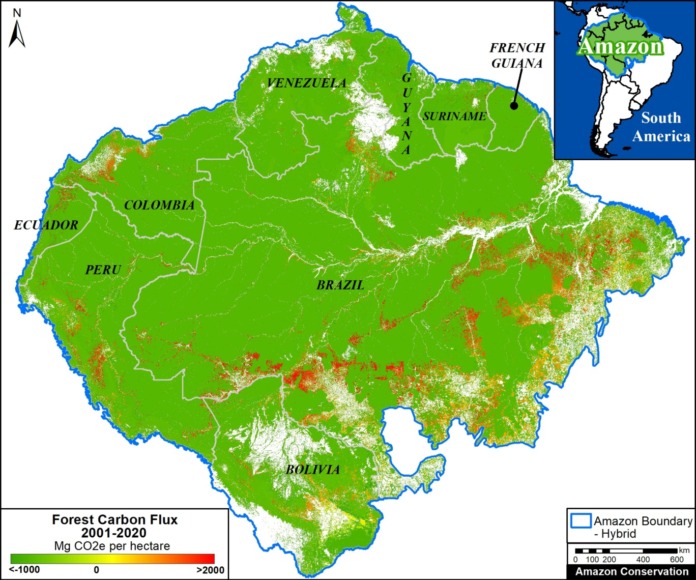
Base Map. Forest Carbon Flux across the Amazon, 2001-2020. Data: Harris et al 2021. Analysis: Amazon Conservation/MAAP.

A pair of recent scientific studies revealed that parts of the Amazon now emit more carbon into the atmosphere than they absorb (Gatti et al 2021, Harris et al 2021).

Here, we dig deeper and highlight the key finding: the Brazilian Amazon has become a net carbon source over the past 20 years, whereas the total Amazon is still a net carbon sink.

We also show that protected areas and indigenous territories are crucial carbon sinks, showing once again their importance and effectiveness for overall conservation across the Amazon (MAAP #141).

One of the noted studies (Harris et al 2021) presented a new global monitoring system for forest carbon flux based on satellite data.

Here, we independently analyze this data with a focus on the Amazon.*

The flux is the crucial difference between forest carbon emissions (such as deforestation) and removals from the atmosphere (such as intact forests and regrowth).

A negative flux indicates that removals exceed emissions and the area is a carbon sink, thus buffering climate change. The Base Map illustrates these sinks in green.

A positive flux indicates that emissions exceed removals and the area has become a carbon source, thus exacerbating climate change. The Base Map illustrates these sources in red.

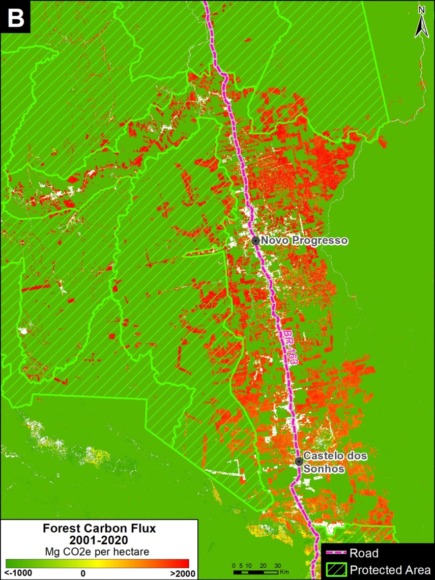
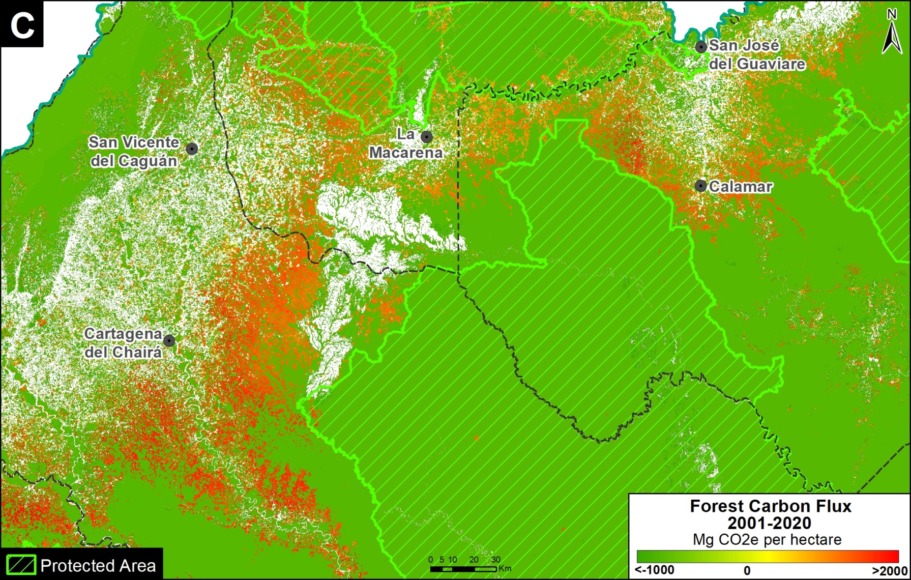
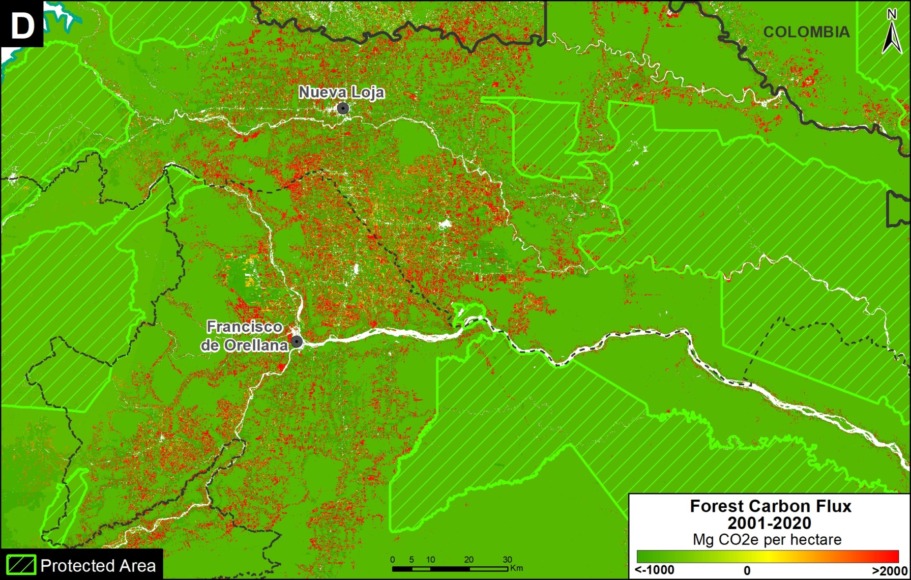
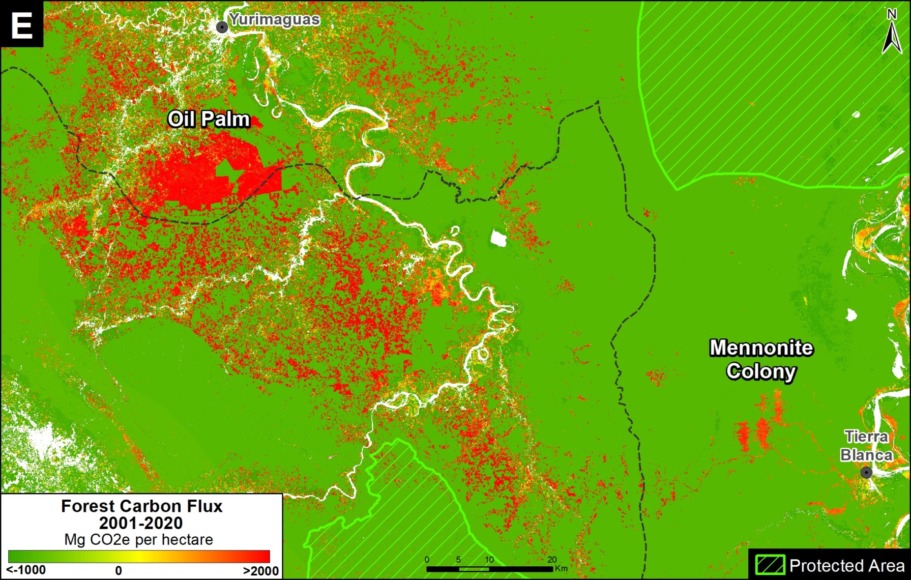
Below, we illustrate the carbon flux results and then zoom in on some of the key carbon sinks (such as protected areas and indigenous territories) and carbon sources (high deforestation areas) across the Amazon.

Amazon Carbon Flux

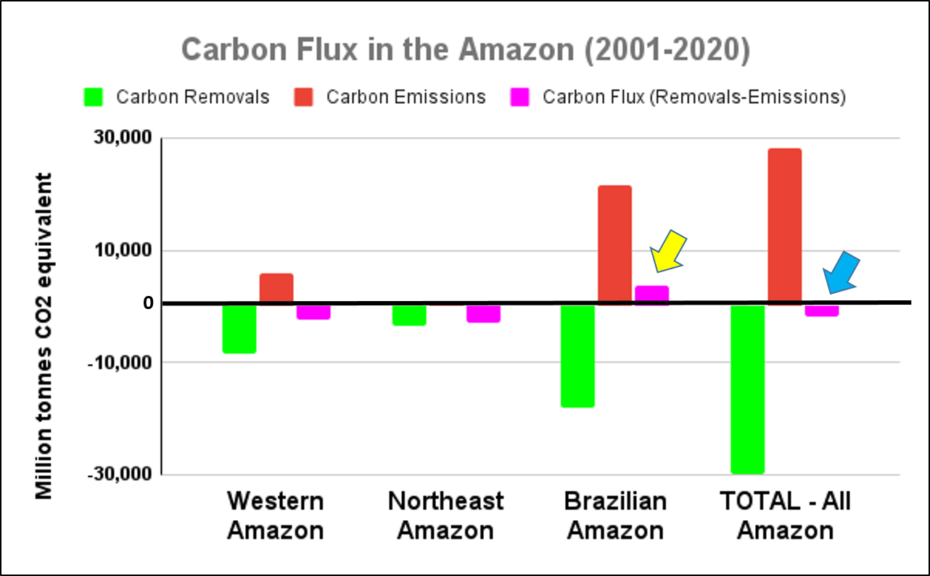
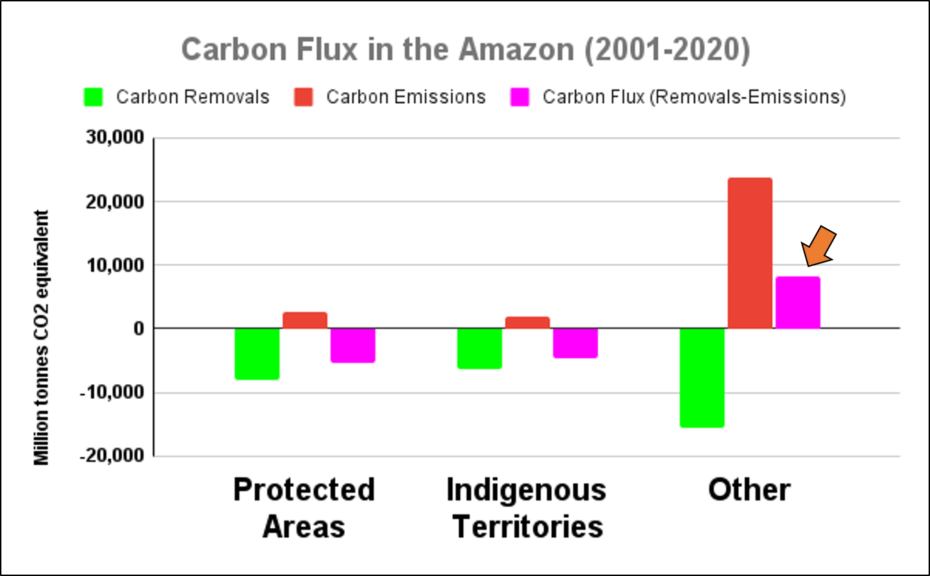
The two graphs below show levels of carbon removals in green and carbon emissions in red across the western Amazon (Bolivia, Colombia, Ecuador, and Peru), northeastern Amazon (French Guiana, Guyana, Suriname, and Venezuela), Brazilian Amazon, and total Amazon. The resulting carbon flux is highlighted in pink.

The arrows highlight three critical results:

  • The Brazilian Amazon has become a net carbon source (positive flux indicated by yellow arrow in Graph 1). That is, emissions now exceed removals (3,600 million tonnes of carbon dioxide equivalent over the past 20 years), exacerbating climate change.
    l
  • The total Amazon is still a net carbon sink (negative flux indicated by blue arrow in Graph 1). That is, removals still exceed emissions (-1,700 million tonnes of carbon dioxide equivalent over the past 20 years), helping mitigate climate change, mainly thanks to the role of the western and northeastern Amazon.
    j
  • Protected areas and indigenous territories are effective carbon sinks, while other areas outside these key designations are the major carbon source (positive flux indicated by orange arrow in Graph 2).
Graph 1. Carbon Flux in the Amazon, 2001-20. Data: Harris et al 2021. Analysis: Amazon Conservation/MAAP.
Graph 2. Carbon Flux in the Amazon, 2001-20. Data: Harris et al 2021. Analysis: Amazon Conservation/MAAP.

Key Amazon Carbon Sinks: Protected Areas & Indigenous Territories

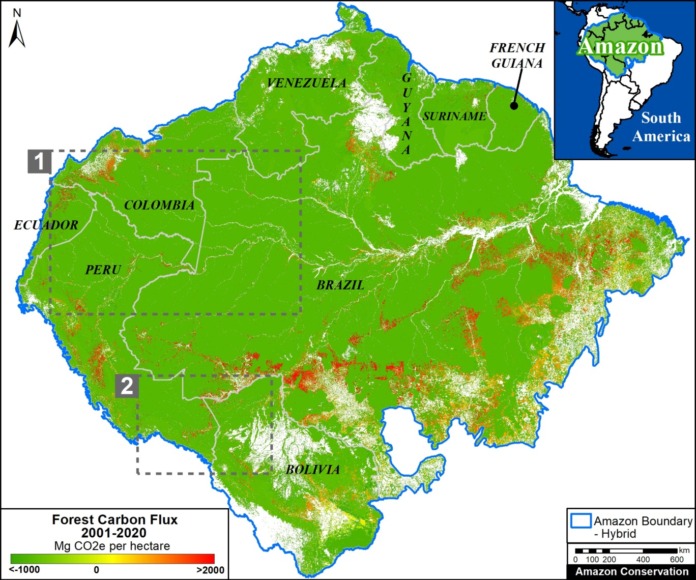
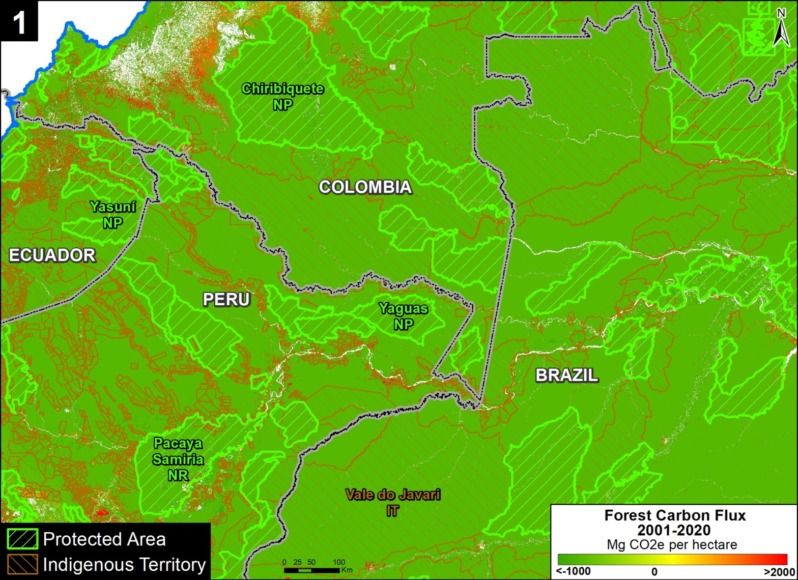
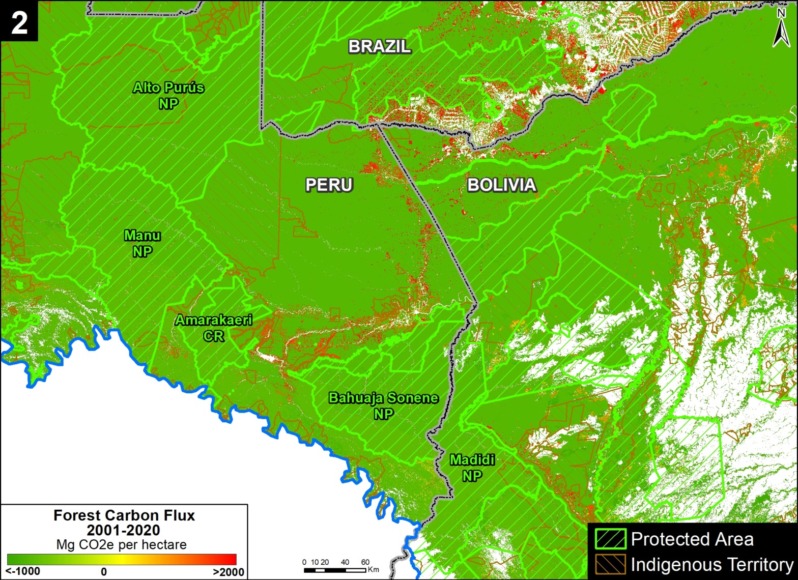
Zooms 1 and 2 show two major carbon sinks in the western Amazon.

Zoom 1 focuses in on the northwestern Amazon, stretching across four countries (Brazil, Peru, Colombia, and Ecuador). This region includes large protected areas (such as Yasuni National Park in Ecuador, Chiribiquete National Park in Colombia, and Yaguas National Park in Peru) and indigenous territories (such as Vale do Javari in Brazil).

Zoom 2 focuses in on the southwestern Amazon, stretching across three countries (Brazil, Peru, and Bolivia). This region also includes large protected areas (such as Alto Purus, Manu, and Bahuaja Sonene National Parks in Peru and Madidi National Park in Bolivia).

Base Map: Amazon carbon sinks, indicated by insets 1 and 2. Data: Harris et al 2021.


Key Amazon Carbon Sources: High Deforestation Areas

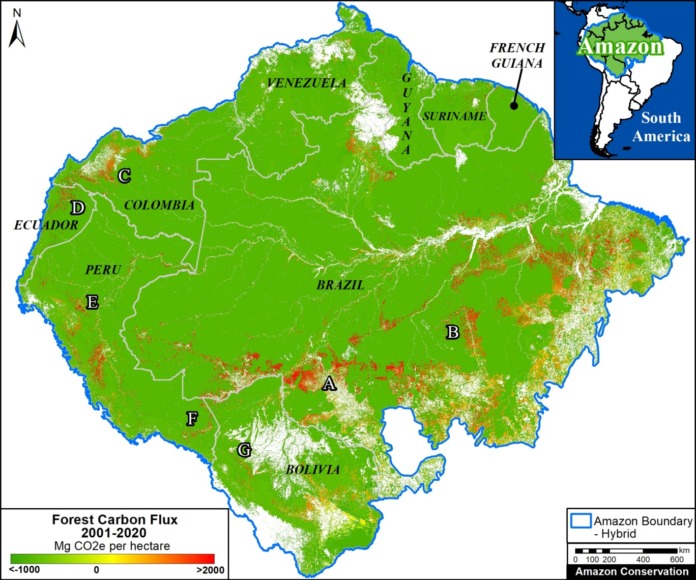
Zooms A-H show eight major carbon sources in the western Amazon.

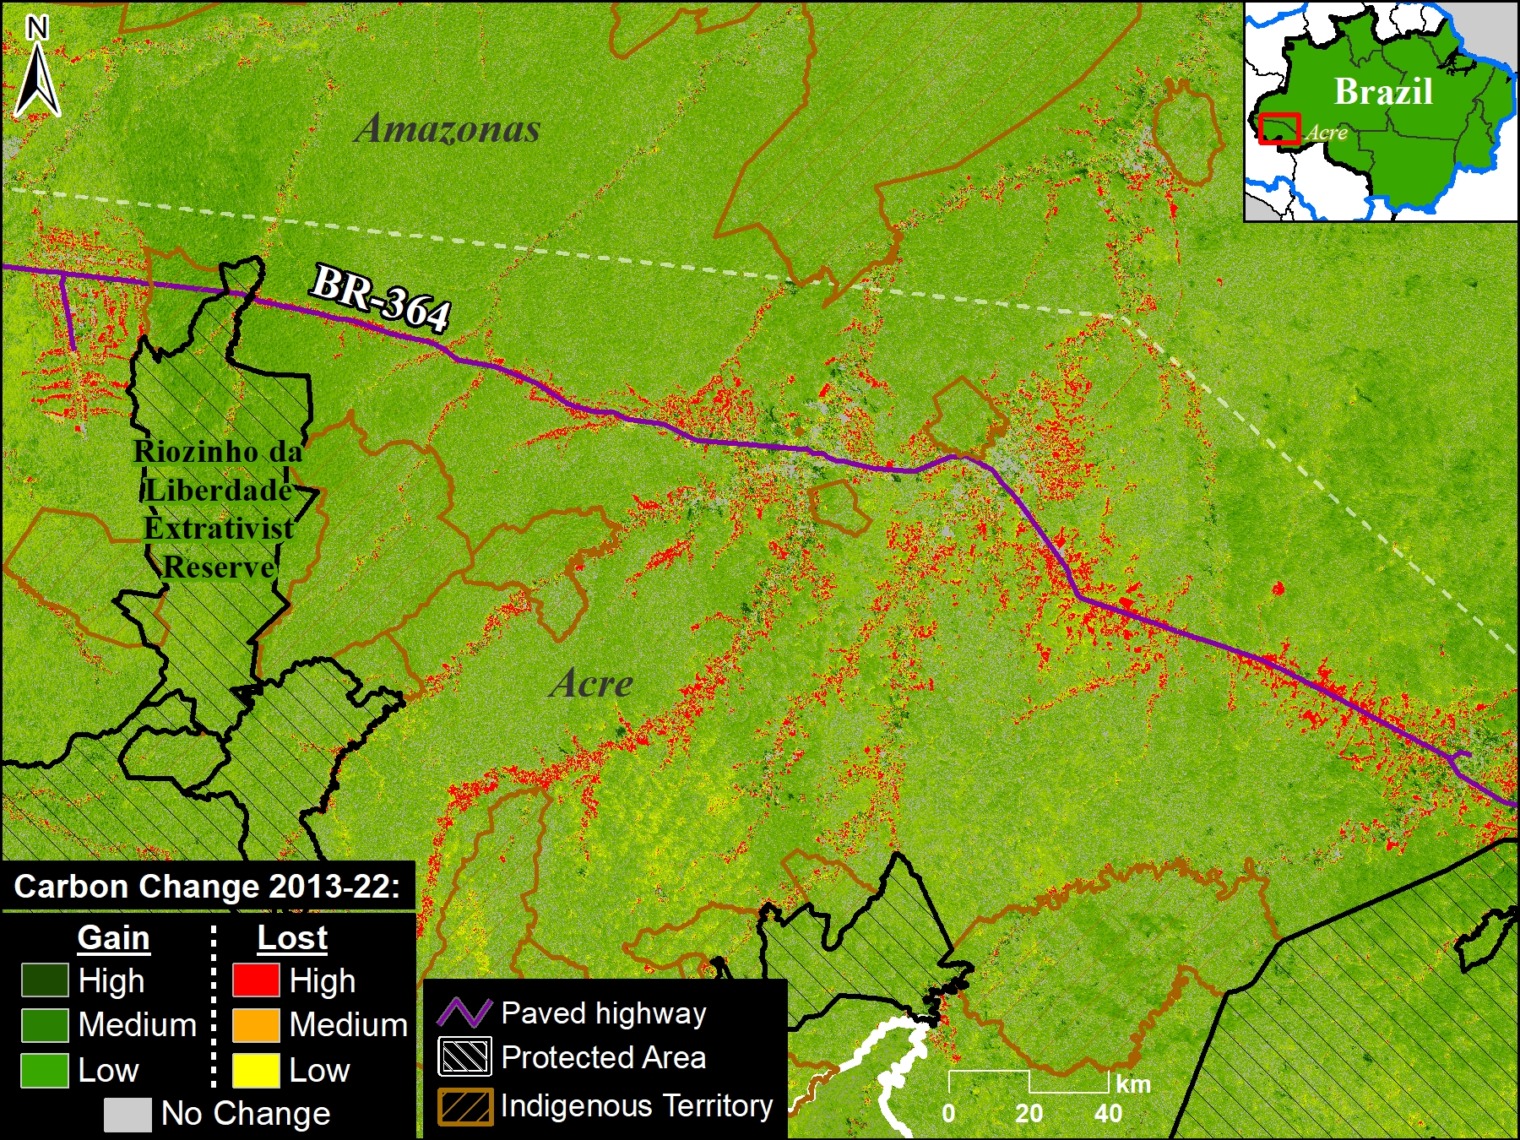
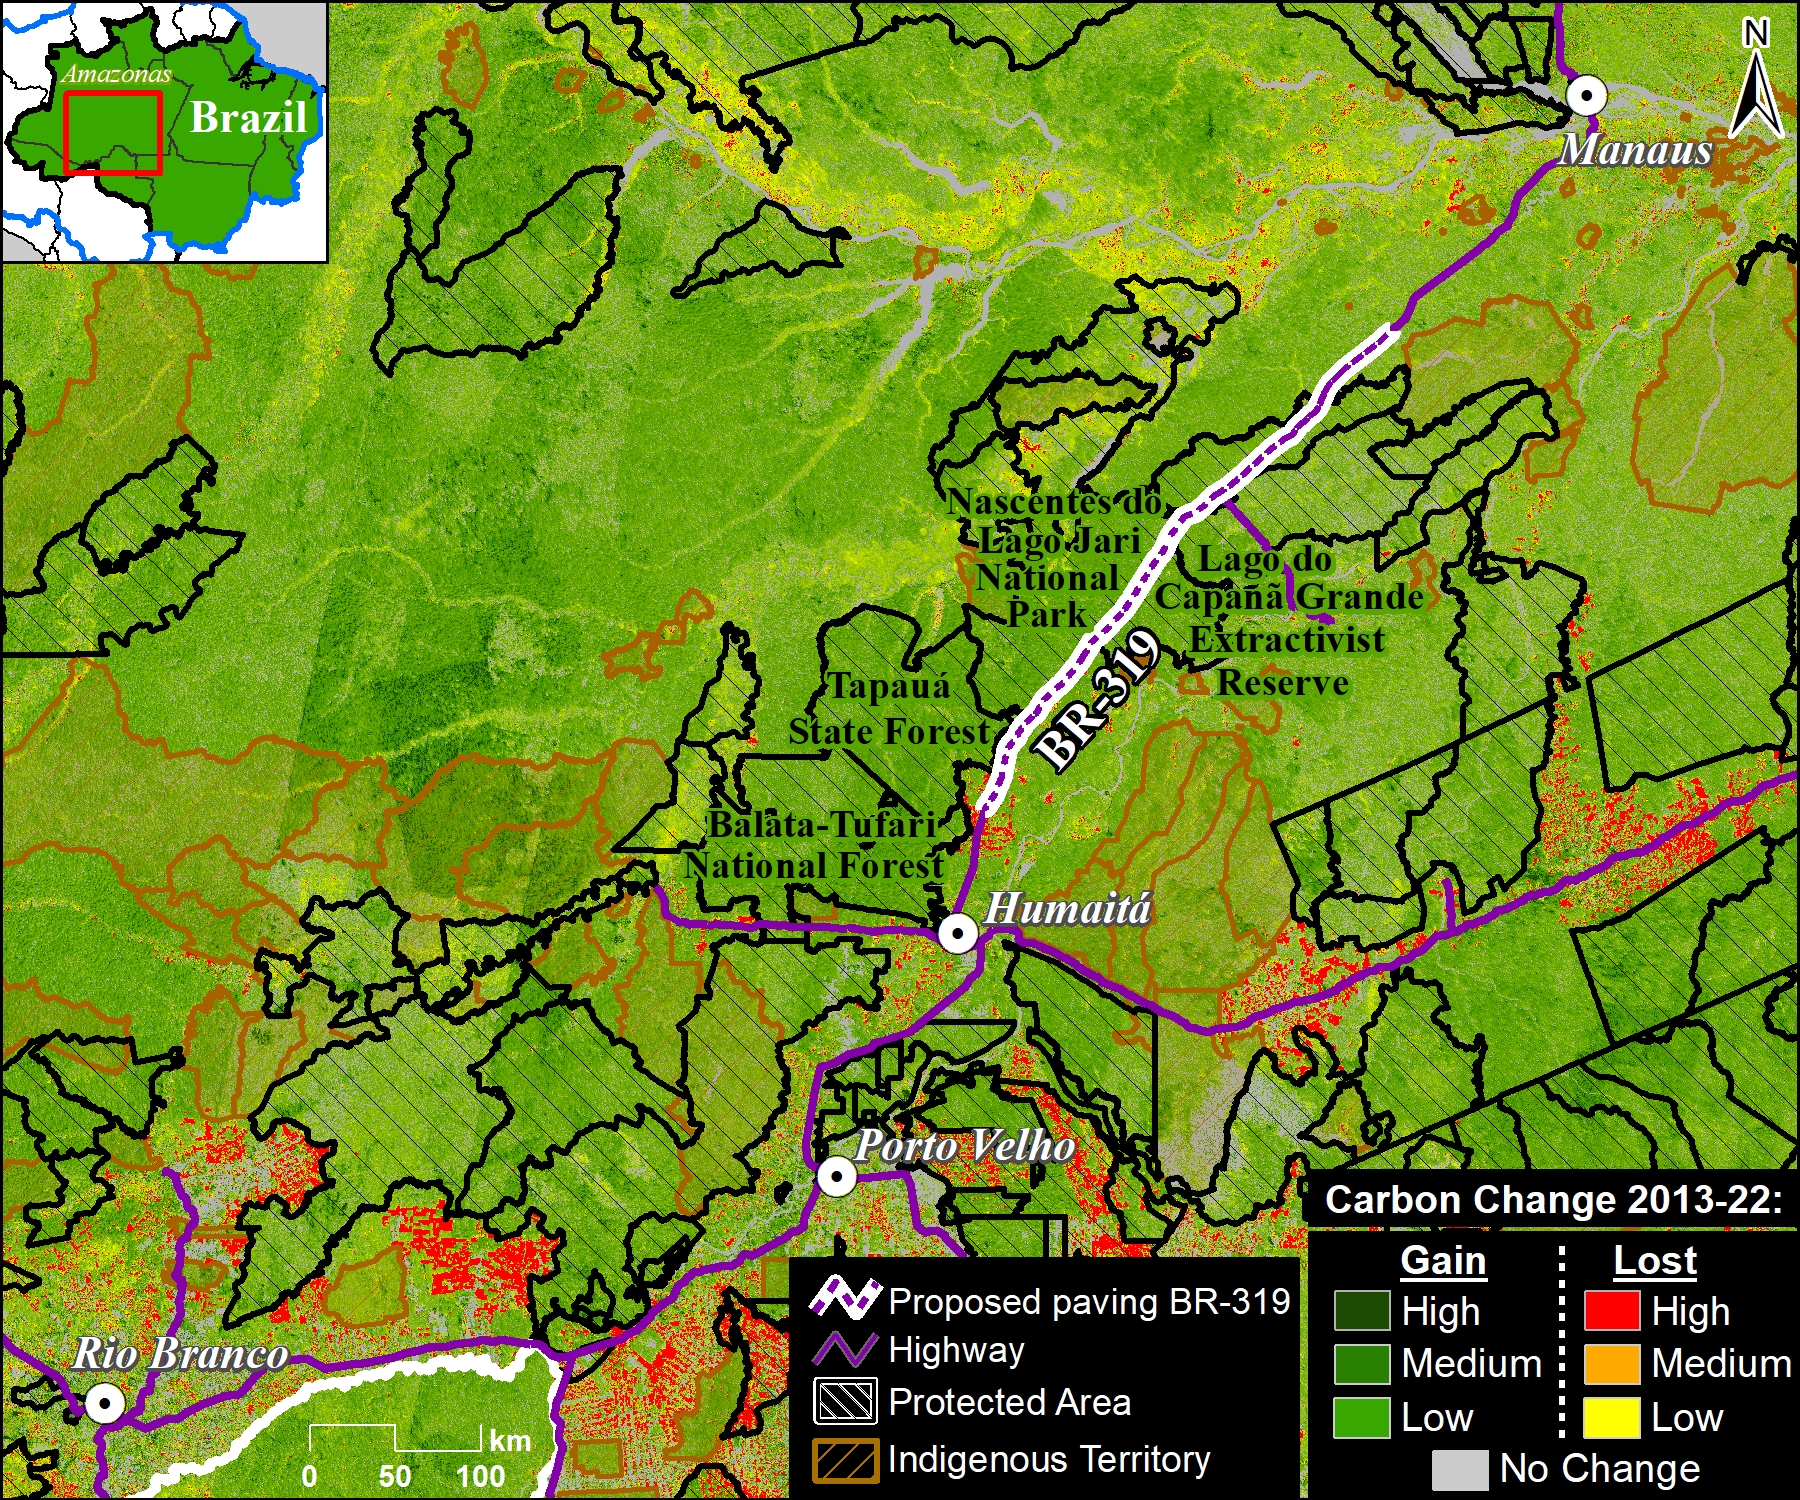
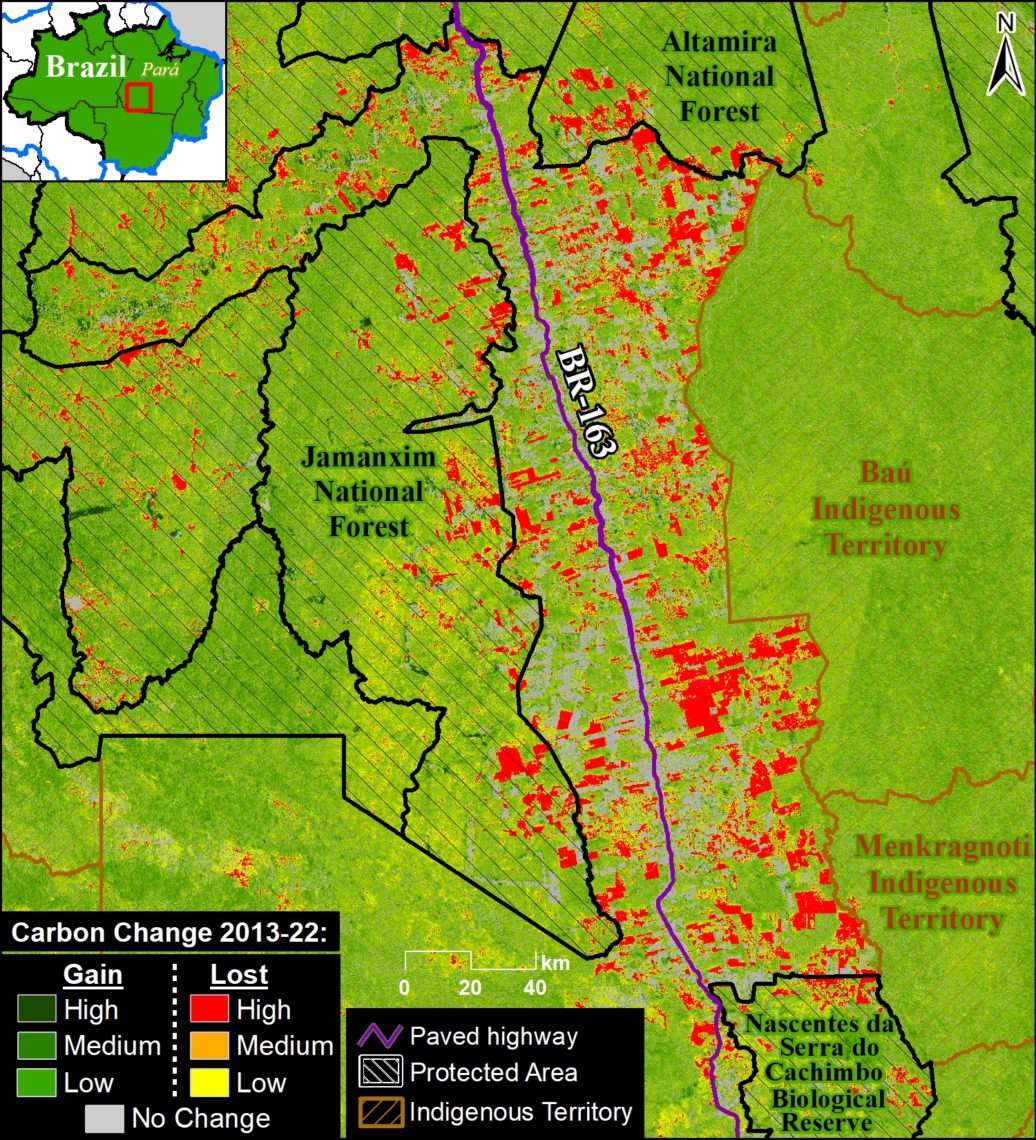
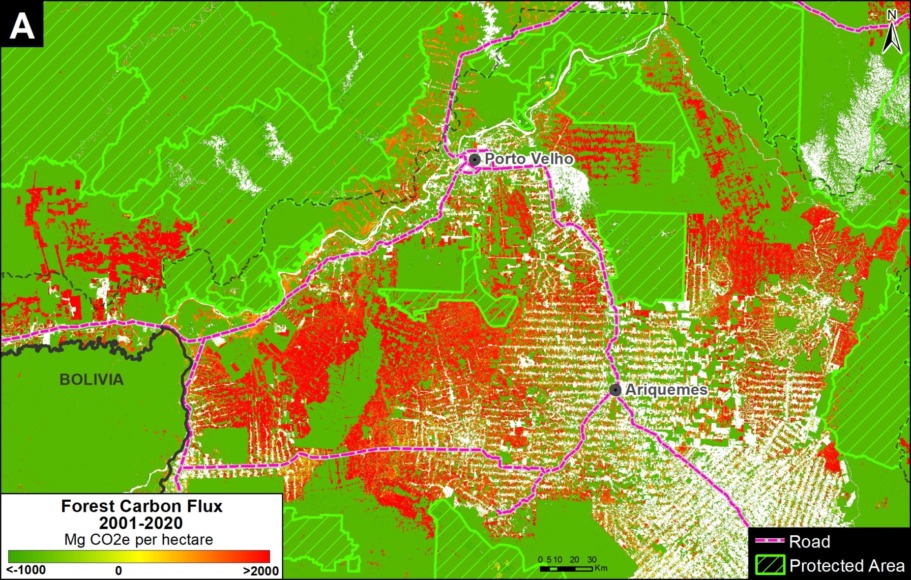
Zooms A and B show two of the major deforestation fronts in the Brazilian Amazon. Zoom A shows the massive deforestation around the city of Porto Velho, in the state of Rondônia and near the border with the state of Amazonas. Zoom B shows the massive deforestation along the BR-163 highway in the state of Pará.

Base Map: Amazon carbon sources, indicated by letters A-G. Data: Harris et al 2021.

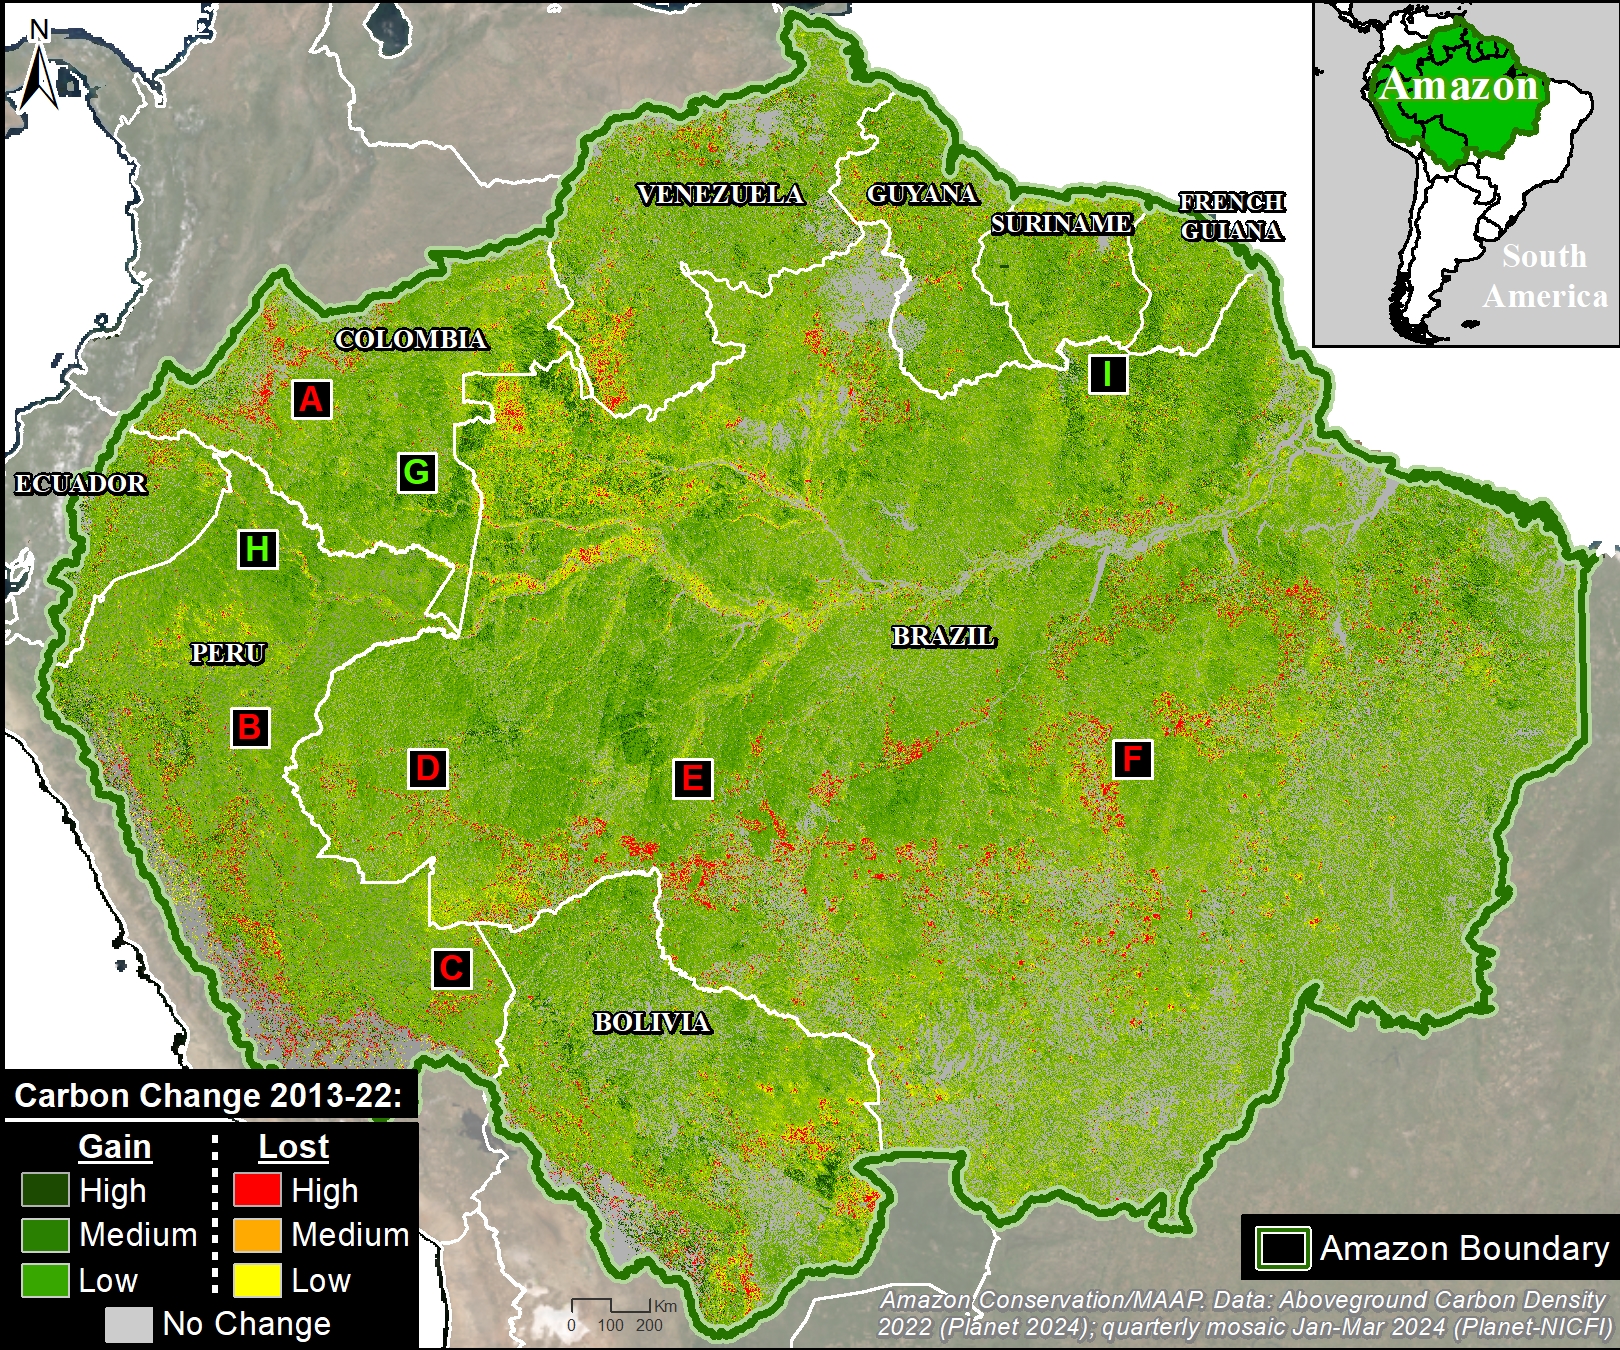
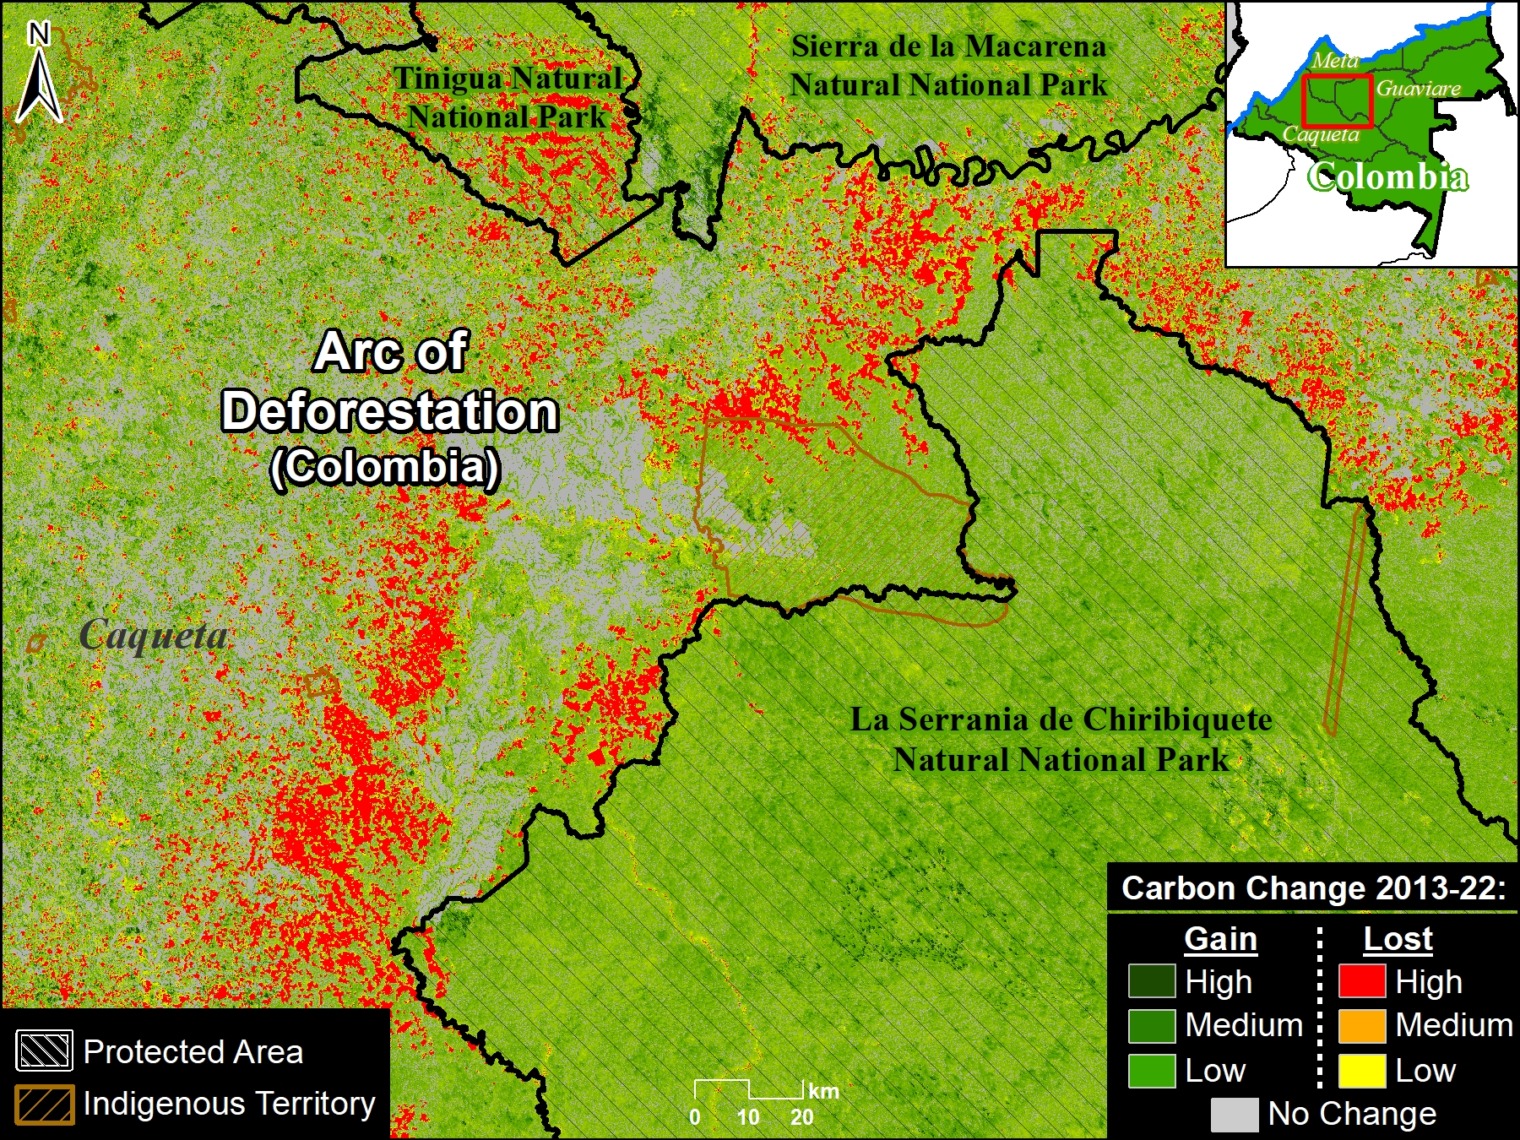
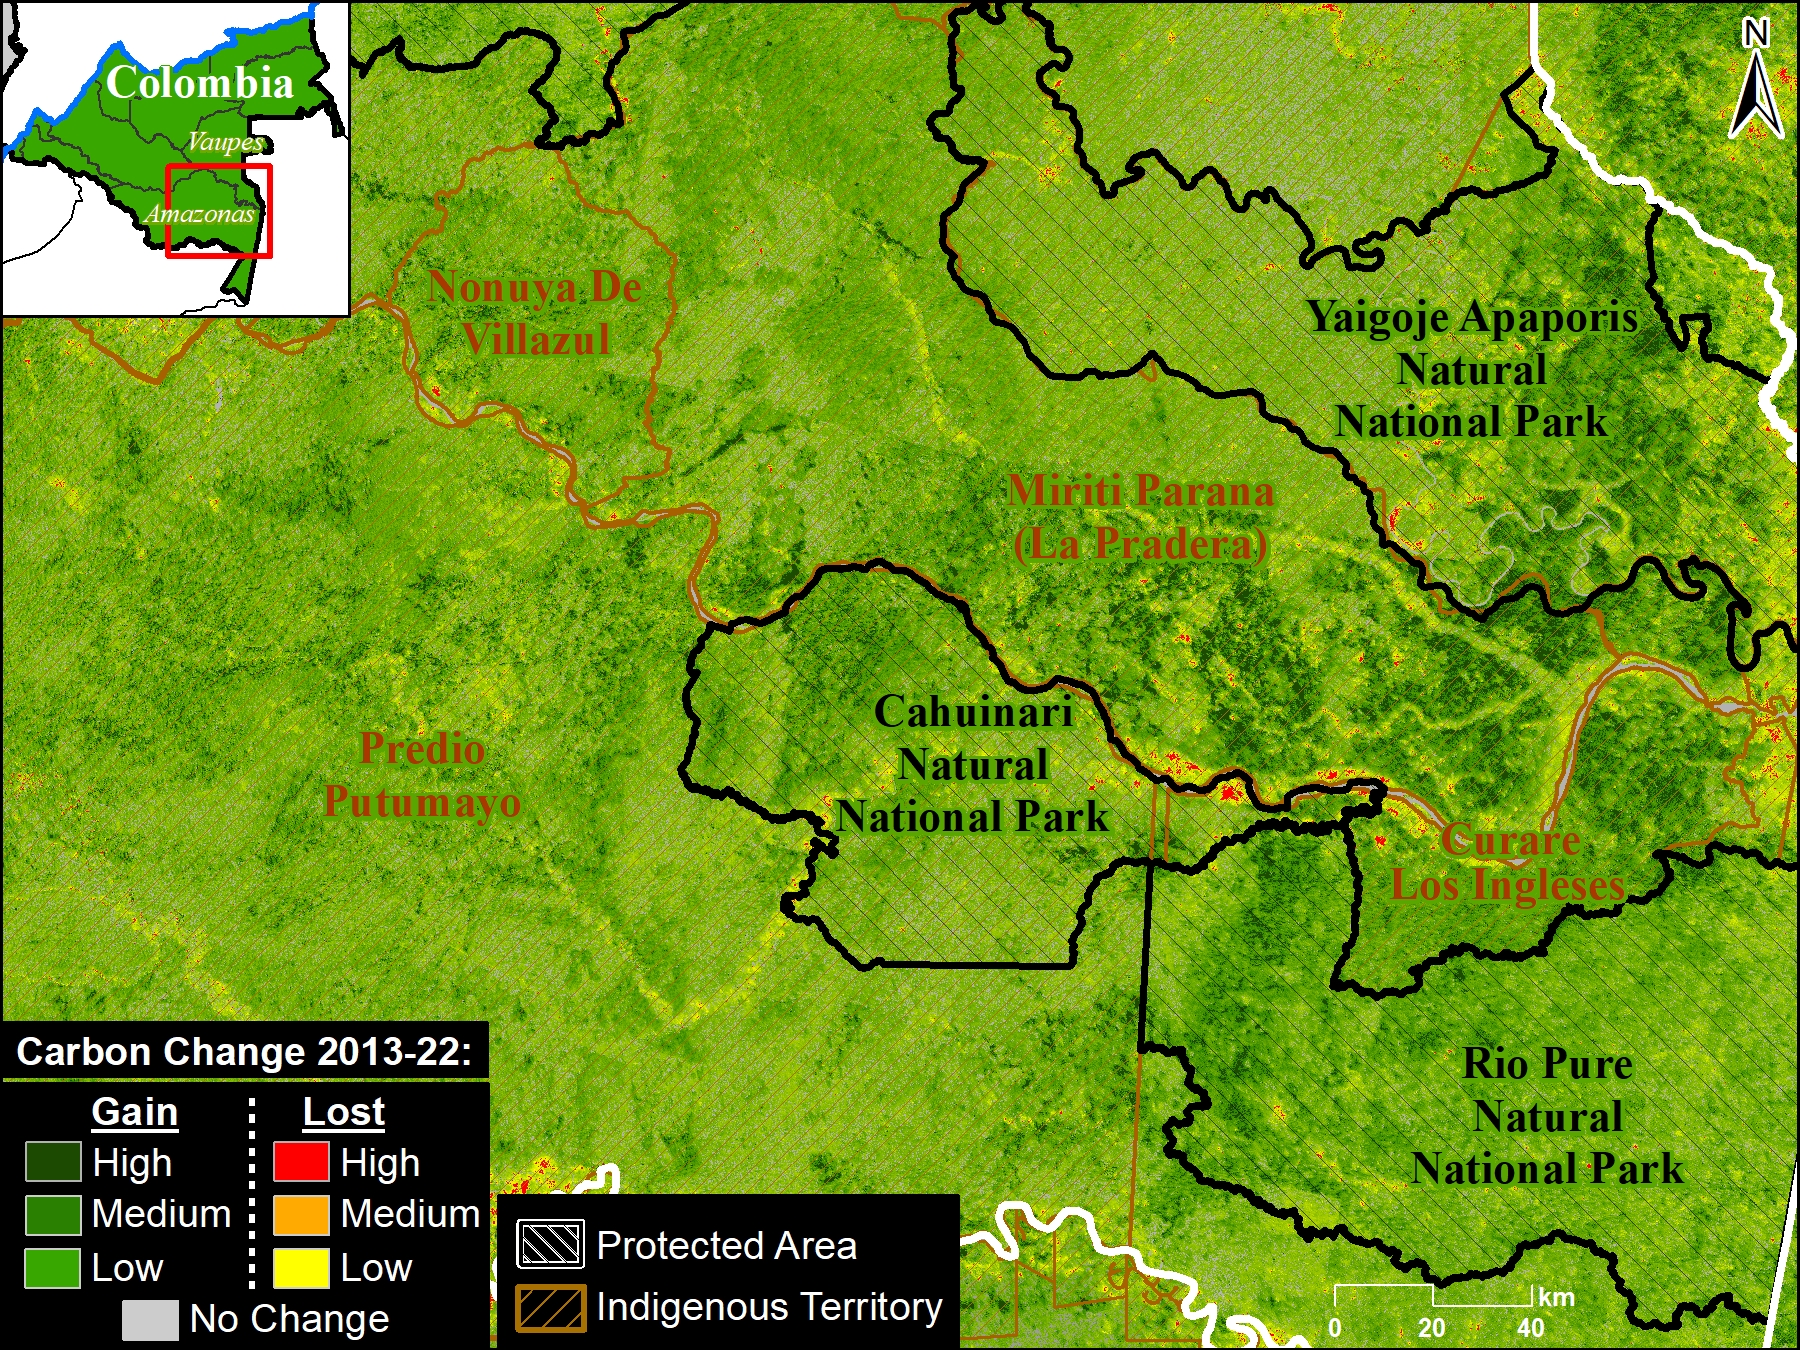
Moving to the western Amazon, Zoom C shows the arc of deforestation in the northwestern Colombian Amazon and Zoom D shows the major deforestation front in the northern Ecuadorian Amazon.

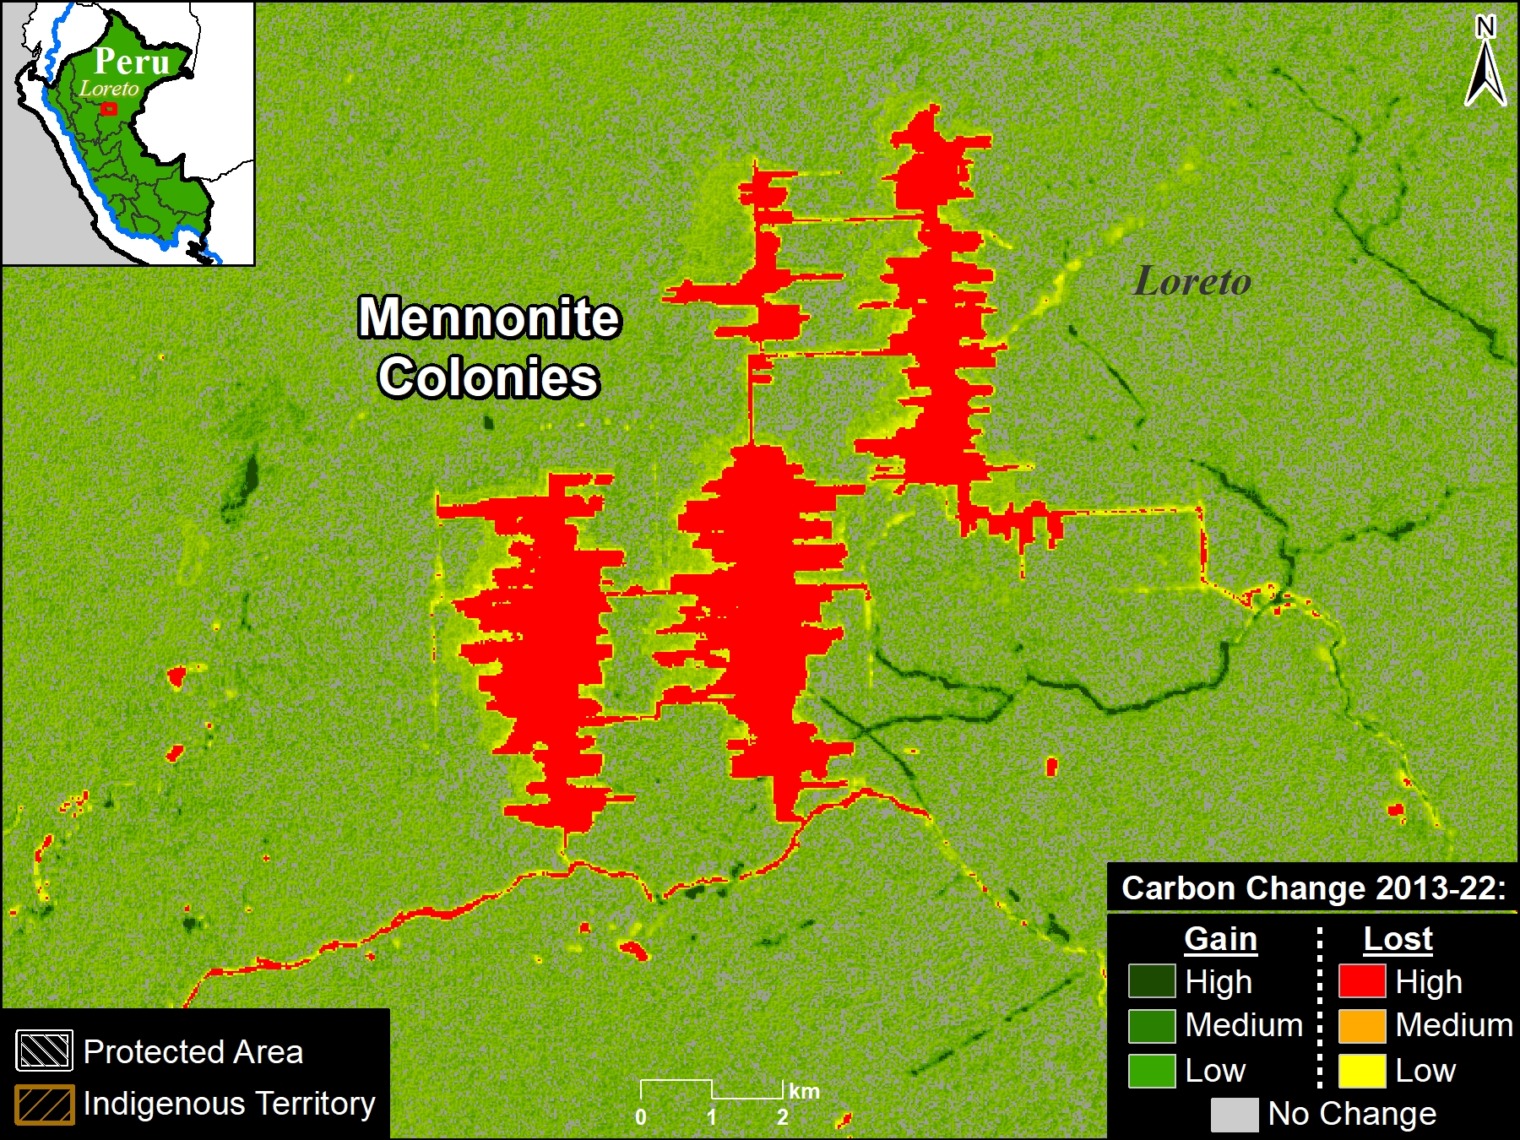
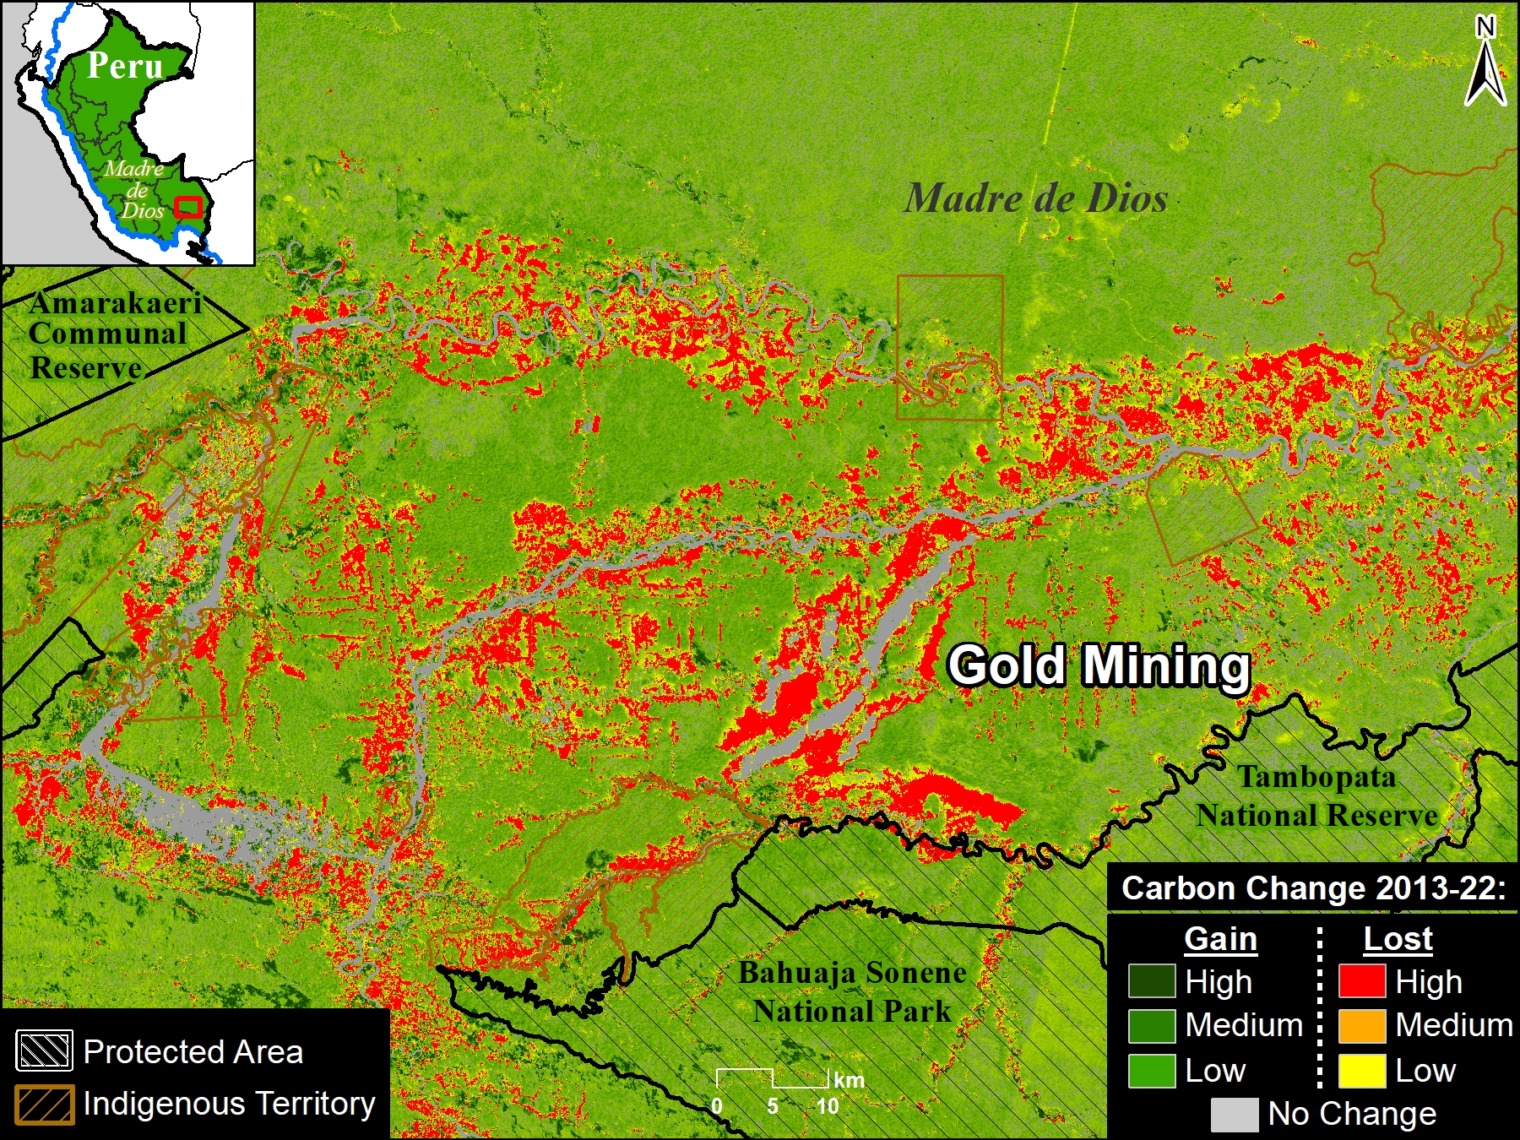
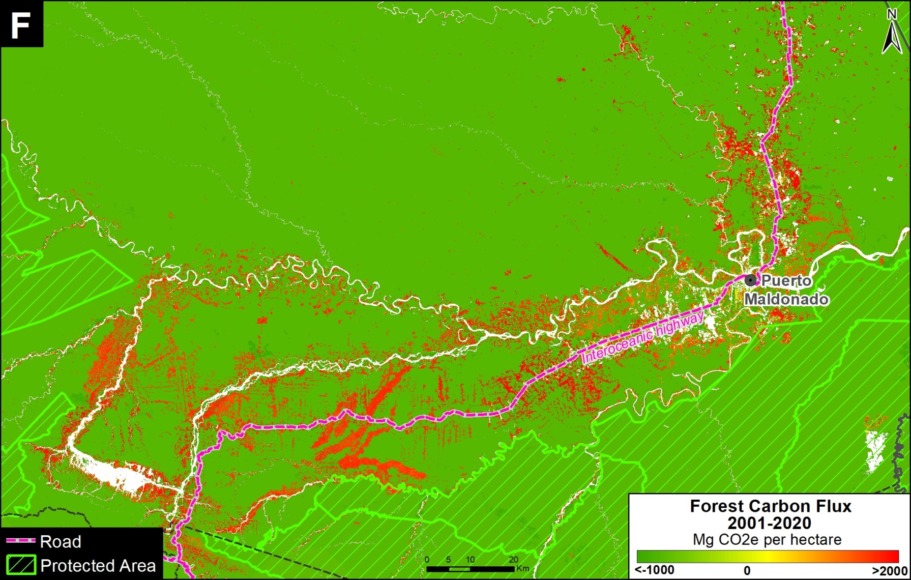
Zooms E and F show two of the major deforestation fronts in the Peruvian Amazon. Zoom E shows large-scale deforestation from oil palm plantations and a new Mennonite colony in the north. Zoom F shows the major deforestation front in the south, along the Interoceanic Highway, surrounded by gold mining and small-scale agriculture.


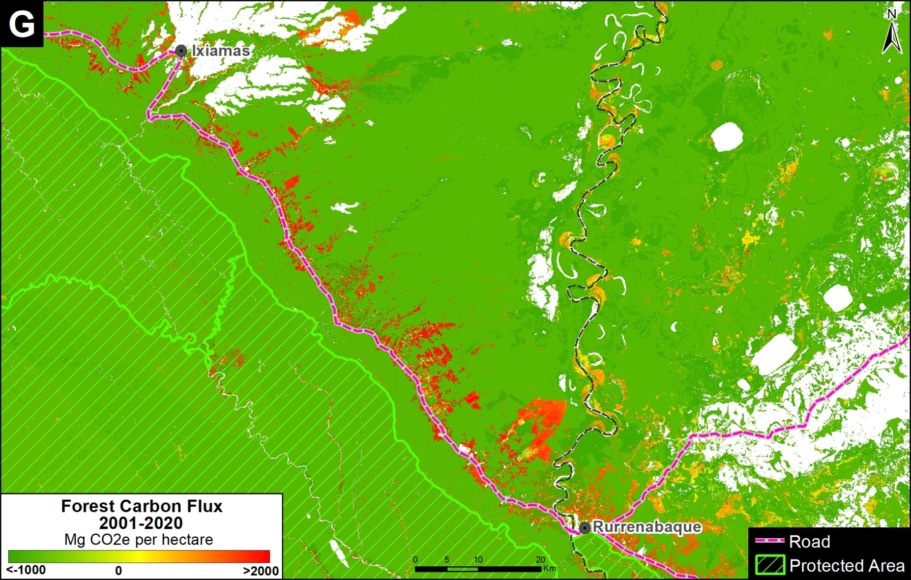
Finally, Zoom G shows the deforestation along the road connecting Rurrenabaque and Ixiamas, including the new large-scale sugar cane plantation.


*Methodology & Notes

Base Map, Figure 1, and Zoom maps are based on 30-meter, satellite-based data obtained from Harris et al (2021). Our geographic range included nine countries and consists of a combination of the Amazon biogeographic limit (as defined by RAISG) plus the Amazon watershed limit in Bolivia. See Base Map above for delineation of this hybrid Amazon limit, designed for maximum inclusion.

References

Gatti, LV et al (2021) Amazonia as a carbon source linked to deforestation and climate change. Nature 595, 388–393.

Harris NL et al (2021) Global maps of twenty-first century forest carbon fluxes. Nature Climate Change 11, 234-240.

Acknowledgements

We thank M. Silman (Wake Forest University), D. Gibbs (WRI), M.E. Gutierrez (ACCA), D. Larrea (ACEAA), J. Beavers (ACA), and A. Folhadella (ACA) for their helpful comments on this report.

This work was supported by the Norwegian Agency for Development Cooperation (NORAD), and International Conservation Fund of Canada (ICFC).

Citation

Finer M, Mamani N (2021) The Amazon & Climate Change: Carbon Sink vs Carbon Source. MAAP: 144.

MAAP #83: Climate Change Defense: Amazon Protected Areas and Indigenous Lands

Base Map. Data: Asner et al 2014, MINAM/PNCB, SERNANP, IBC

Tropical forests, especially the Amazon, sequester huge amounts of carbon, one of the main greenhouse gases driving climate change.

Here, we show the importance of protected areas and indigenous lands to safeguard these carbon stocks.

In MAAP #81, we estimated the loss of 59 million metric tons of carbon in the Peruvian Amazon during the last five years (2013-17) due to forest loss, especially deforestation from mining and agricultural activities.

This finding reveals that forest loss represents nearly half (47%) of Peru’s annual carbon emissions, including from burning fossil fuels.1,2

In contrast, here we show that protected areas and indigenous lands have safeguarded 3.17 billion metric tons of carbon, as of 2017.3,4

The Base Map (on the right) shows, in shades of green, the current carbon densities in relation to these areas.

The breakdown of results are:
1.85 billion tons safeguarded in the Peruvian national protected areas system;
1.15 billion tons safeguarded in titled native community lands; and
309.7 million tons safeguarded in Territorial Reserves for indigenous peoples in voluntary isolation.

The total safeguarded carbon (3.17 billion metric tons) is the equivalent to 2.5 years of carbon emissions from the United States.5

Below, we show several examples of how protected areas and indigenous lands are safeguarding carbon reservoirs in important areas, indicated by insets A-E.

A. Yaguas National Park

The following Image A shows how three protected areas, including the new Yaguas National Park, are effectively safeguarding 202 million metric tons of carbon in the northeastern Peruvian Amazon. This area is home to some of the highest carbon densities in the country.

Image 83a. Yaguas. Data: Asner et al 2014, MINAM/PNCB, SERNANP

B. Manu National Park, Amarakaeri Communal Reserve, CC Los Amigos

The following Image B shows how Los Amigos, the world’s first conservation concession, is effectively safeguarding 15 million metric tons of carbon in the southern Peruvian Amazon. Two surrounding protected areas, Manu National Park and Amarakaeri Communal Reserve, safeguard an additional 194 million metric tons. This area is home to some of the highest carbon densities in the country.

Image 83b. Los Amigos-Manu-Amarakaeri. Data: Asner et al 2014, MINAM/PNCB, SERNANP, ACCA

C. Tambopata National Reserve, Bahuaja Sonene National Park

The following Image C shows how two important natural protected areas, Tambopata National Reserve and Bahuaja Sonene National Park, are helping conserve carbon stocks in an area with intense illegal gold mining activity.

D. Sierra del Divisor National Park, National Reserve Matsés

Image 83d. Data: Asner et al 2014, MINAM/PNCB, SERNANP

The following Image D shows how four protected areas, including the new Sierra del Divisor National Park, and adjacent National Reserve Matsés are effectively safeguarding 270 million metric tons of carbon in the eastern Peruvian Amazon.

This area is home to some of the highest carbon densities in the country.

E. Murunahua Indigenous Reserve

The following Image E shows the carbon protected in the Murunahua Indigenous Reserve (for indigenous peoples in voluntary isolation) and the surrounding titled native communities.

Imagen 83e. Datos: Asner et al 2014, MINAM/PNCB, SERNANP

References

1  UNFCCC. Emissions Summary for Peru. http://di.unfccc.int/ghg_profile_non_annex1

2  No incluye las emisiones por la degradación de bosques

Asner GP et al (2014). The High-Resolution Carbon Geography of Perú. Carnegie Institution for Science. ftp://dge.stanford.edu/pub/asner/carbonreport/CarnegiePeruCarbonReport-English.pdf

Sistema de Áreas Naturales Protegidas del Perú, que incluye áreas de administración nacional, regional, y privado. Datos de las tierras indígenas son de Instituto de Bien Común. Datos de pérdida forestal son de la Programa Nacional de Conservación de Bosques para la Mitigación del Cambio Climático (MINAM/PNCB).

UNFCCC. Emissions Summary for United States. http://di.unfccc.int/ghg_profile_annex1

Citation

Finer M, Mamani N (2017). Climate Change Defense: Amazon Protected Areas and Indigenous Lands. MAAP: 83.

MAAP #81: Carbon loss from deforestation in the Peruvian Amazon

Base Map. Data: MINAM/PNCB, Asner et al 2014

When tropical forests are cleared, the enormous amount of carbon stored in the trees is released to the atmosphere, making it a major source of global greenhouse gas emissions (CO2) that drive climate change.

In fact, a recent study revealed that deforestation and degradation are turning tropical forests into a new net carbon source for the atmosphere, exacerbating climate change.1

The Amazon is the world’s largest tropical forest, and Peru is a key piece of that. Researchers (led by Greg Asner at the Carnegie Institution for Science) recently published the first high-resolution estimate of aboveground carbon in the Peruvian Amazon, documenting 6.83 billion metric tons.2

Here, we analyze this same dataset to estimate the total carbon emissions from deforestation in the Peruvian Amazon between 2013 and 2017. We estimate the loss of 59 million metric tons of carbon during these last five years, the equivalent of around 4% of annual United States fossil fuel emissions.3

We present a series of zoom images to show how carbon loss happened in several key areas impacted by the major deforestation drivers: gold mining, large-scale oil palm and cacao plantations, and smaller-scale agriculture. The labels A-G correspond to the zooms below.

We also show how protected areas are protecting hundreds of millions of metric tons of carbon in some of the most important areas in the country.

On the positive side, having this detailed information may provide added incentives to slow deforestation and degradation as part of critical climate change strategies.


Major Findings

Data: Asner et al 2014

The base map (see above) shows, in shades of green, carbon densities across Peru. It also shows, in red, the forest loss layer from 2013 to 2017.

We calculated the estimated amount of carbon emissions from forest loss during these five years: 59.029 teragrams, or 59 million metric tons.

The regions with the most carbon loss are 1) Loreto (13.4 million metric tons), 2) Ucayali (13.2 million), 3) Huánuco (7.3 million), 4) Madre de Dios (7 million), and 5) San Martin (6.9 million).

These values include some natural forest loss. Overall, however, they should be considered underestimates because they do not include forest degradation (for example, selective logging).

A recent study revealed that degradation may account for 70% of emissions, thus total carbon emissions from forests in the Peruvian Amazon may be closer to 200 million metric tons.

Next, we show a series of zoom images to show how carbon loss happened in several key areas. We also show how protected areas and conservation concessions are protecting the most important carbon reserves.


Zoom A: Central Peruvian Amazon

Image A shows the loss of 2.8 million metric tons of carbon in a section of the central Peruvian Amazon (Ucayali region). On the east side of image, note the loss due to two large-scale oil palm plantations (649,000 metric tons); on the west side, note small-scale agriculture penetrating deeper into high carbon density forest.

Image A. Central Peruvian Amazon. Data: Asner et al 2014, MINAM/PNCB

Zoom B: Southern Peruvian Amazon (gold mining) 

Image B shows the loss of 756 thousand metric tons of carbon due to gold mining in the southern Peruvian Amazon (Madre de Dios region). On the east side of image is the sector known as La Pampa; west side is Upper Malinowski.

Image B. Gold mining. Data: Asner et al 2014, MINAM/PNCB

Zoom C: Southern Peruvian Amazon (agriculture)

Image C shows the loss of 876 thousand metric tons of carbon in the southern Peruvian Amazon around the town of Iberia (Madre de Dios region). Note the expanding carbon loss along both sides of the Interoceanic Highway that crosses the image.

Image C. Iberia. Data: Asner et al 2014, MINAM/PNCB

Zoom D: United Cacao

Image D shows the loss of 291 thousand metric tons of carbon for a large-scale cacao project (United Cacao) in the northern Peruvian Amazon (Loreto region). Note that nearly all the forest clearing occurred in high carbon density forest. This is another line of evidence that the company cleared primary forest, contrary to their claims that the area was already degraded.

Image D. United Cacao. Data: Asner et al 2014, MINAM/PNCB

Zoom E: Yaguas National Park

Image E shows how three protected areas, including the new Yaguas National Park, are effectively safeguarding 202 million metric tons of carbon in the northeastern Peruvian Amazon. This area is home to some of the highest carbon densities in the country.

Image E. Yaguas. Data: Asner et al 2014, MINAM/PNCB

Zoom F: Los Amigos Conservation Concession

Image F shows how Los Amigos, the world’s first conservation concession, is effectively safeguarding 15 million metric tons of carbon in the southern Peruvian Amazon. Two surrounding protected areas, Manu National Park and Amarakaeri Communal Reserve, safeguard an additional 194 million metric tons. This area is home to some of the highest carbon densities in the country.

Image F. Los Amigos. Data: Asner et al 2014, MINAM/PNCB

Zoom G: Sierra del Divisor National Park

Image G. Data: Asner et al 2014, MINAM/PNCB

Image G shows how three protected areas, including the new Sierra del Divisor National Park, are effectively safeguarding 270 million metric tons of carbon in the eastern Peruvian Amazon.

This area is home to some of the highest carbon densities in the country.


Methodology

Para el análisis se utilizó los datos de carbono sobre el suelo  generados por Asner et al 2014, y los datos de pérdida de bosques identificados por el Programa Nacional de Conservación de Bosques (PNBC-MINAM) de los años 2013 al 2016 así como las alertas tempranas del año 2017. Primero uniformizamos los datos de pérdida de bosque 2013-2016 con las alertas tempranas del año 2017 para evitar superposición y tener un solo dato 2013-2017. Posteriormente, extraemos los datos de carbono de las áreas de pérdida de bosque del 2013-2017, este proceso permitió obtener la densidad de carbono (por hectárea) en relación al área de la pérdida de bosque para finalmente estimar el total de stocks de carbono perdido entre el año 2013 al 2017.

References

Baccini A, Walker W, Carvalho L, Farina M, Sulla-Menashe D, Houghton RA (2017) Tropical forests are a net carbon source based on aboveground measurements of gain and loss. Science. 13;358(6360):230-4.

Asner GP et al (2014). The High-Resolution Carbon Geography of Perú. Carnegie Institution for Science.

Boden TA, Andres RJ, Marland G (2017) National CO2 Emissions from Fossil-Fuel Burning, Cement Manufacture, and Gas Flaring: 1751-2014. DOI 10.3334/CDIAC/00001_V2017

Citation

Finer M, Mamani N (2017). Carbon loss from deforestation in the Peruvian Amazon. MAAP: 81.