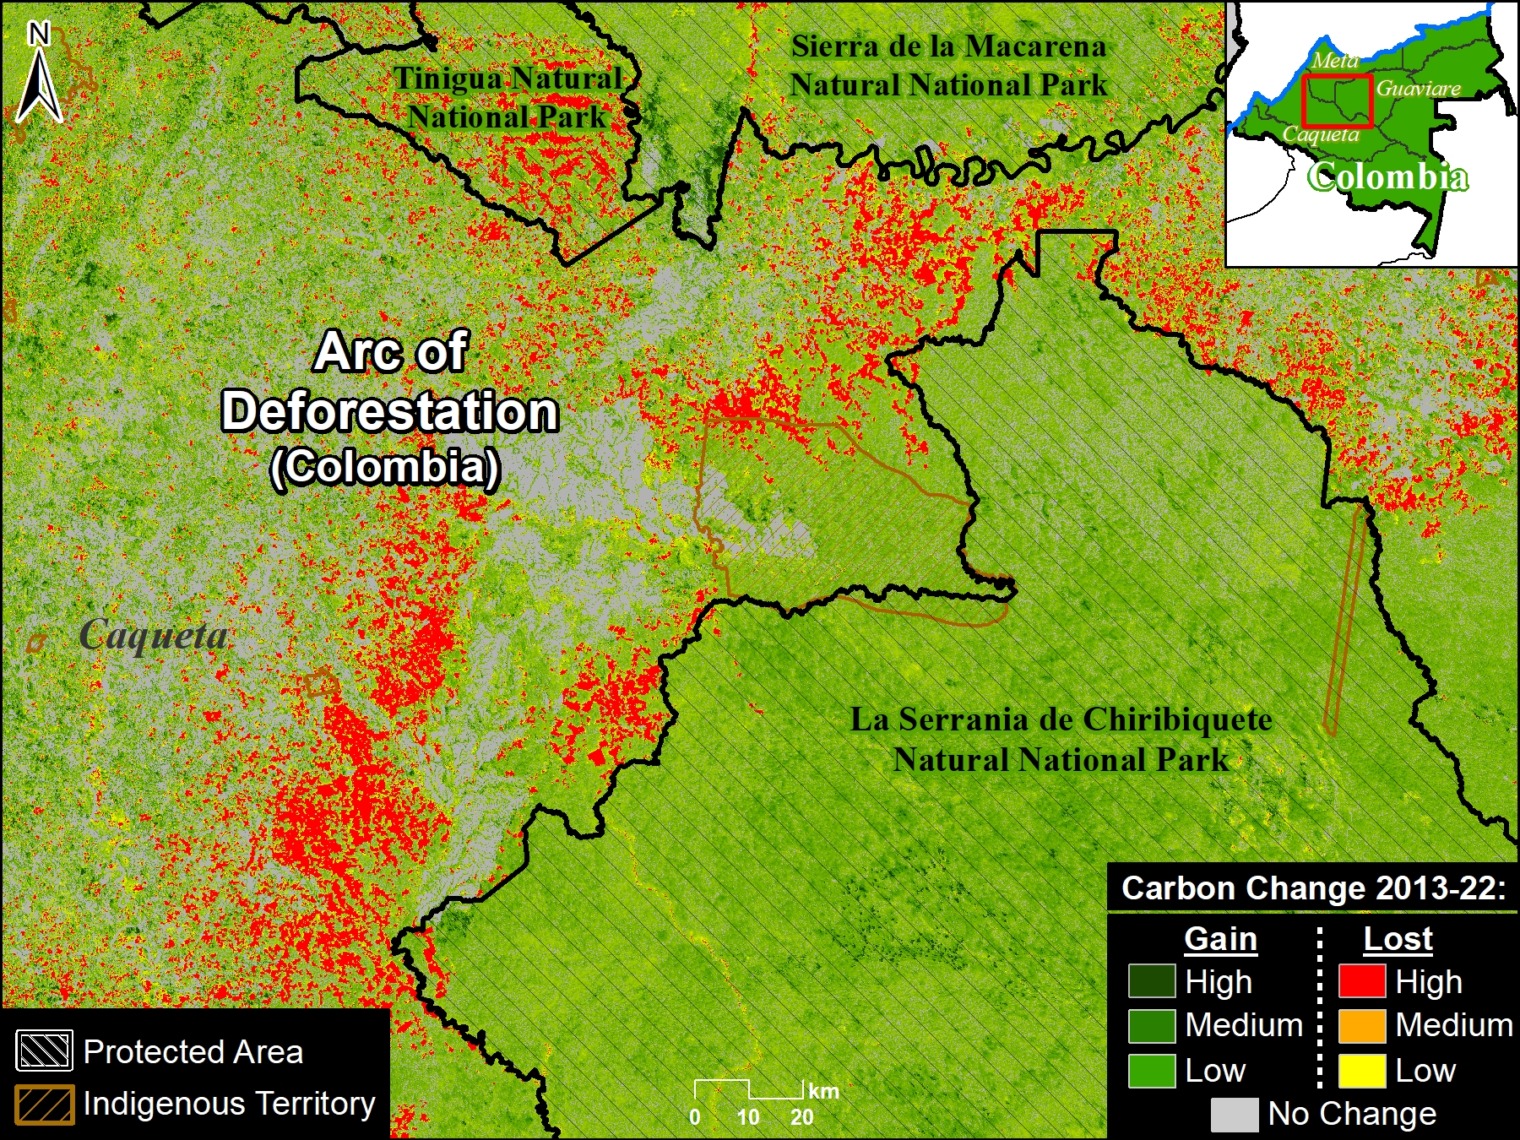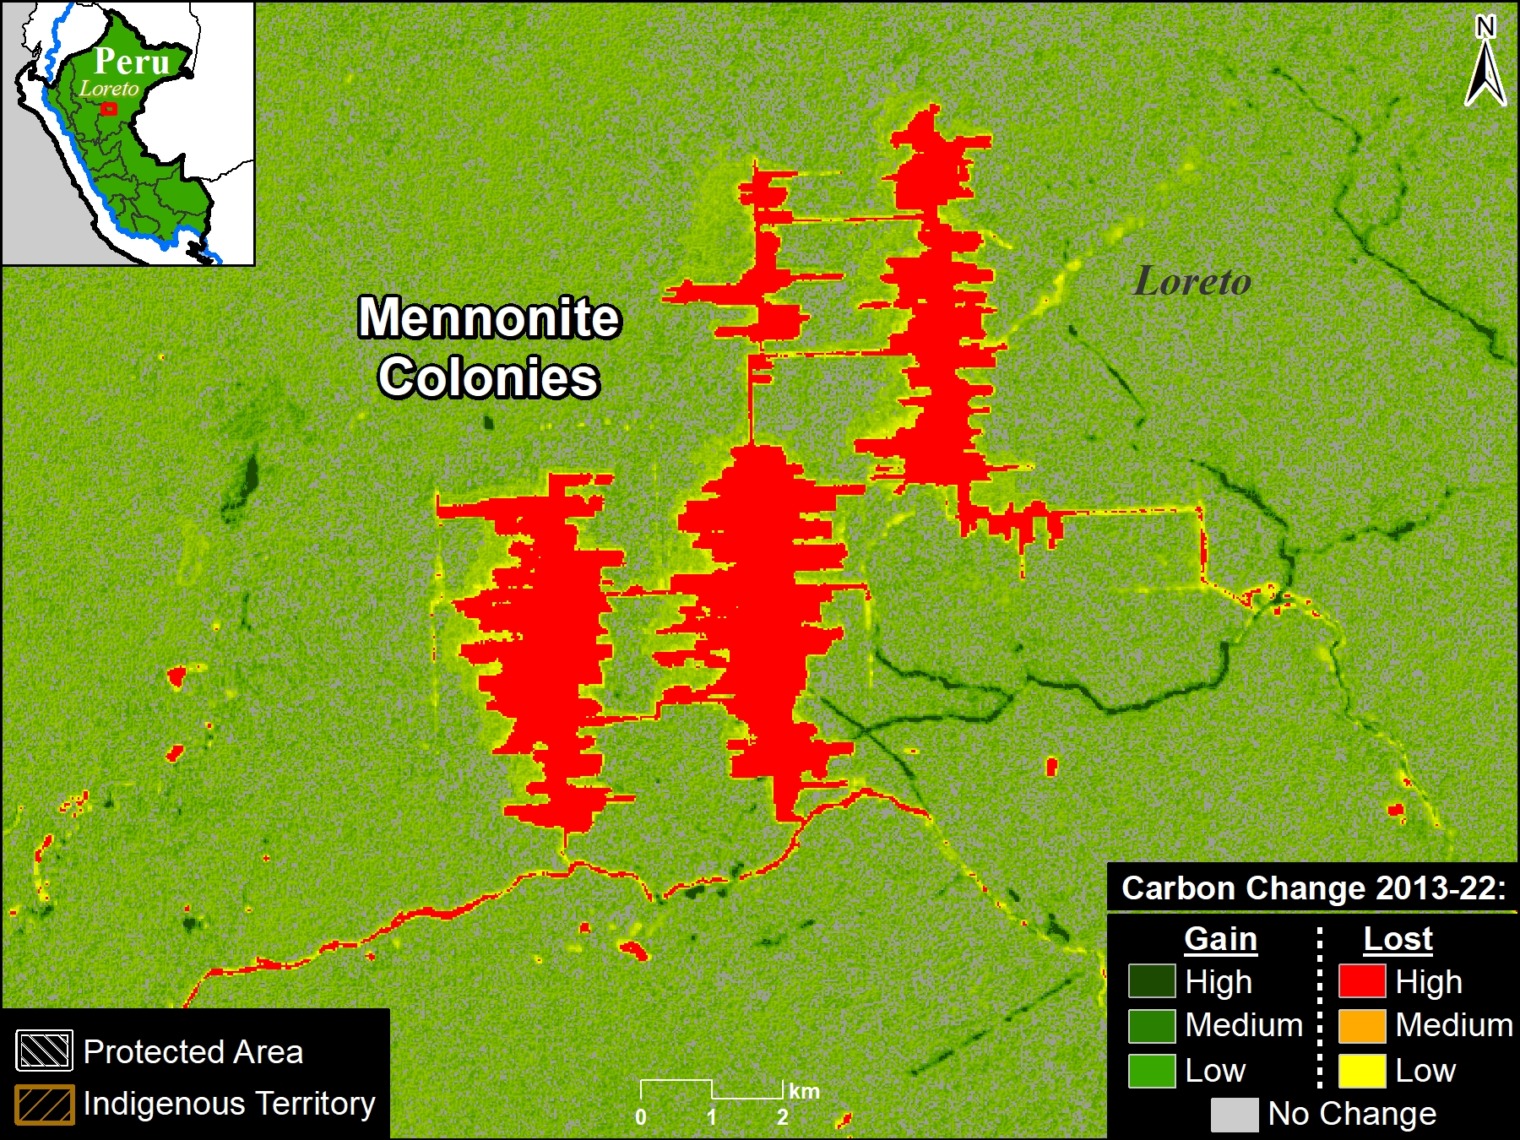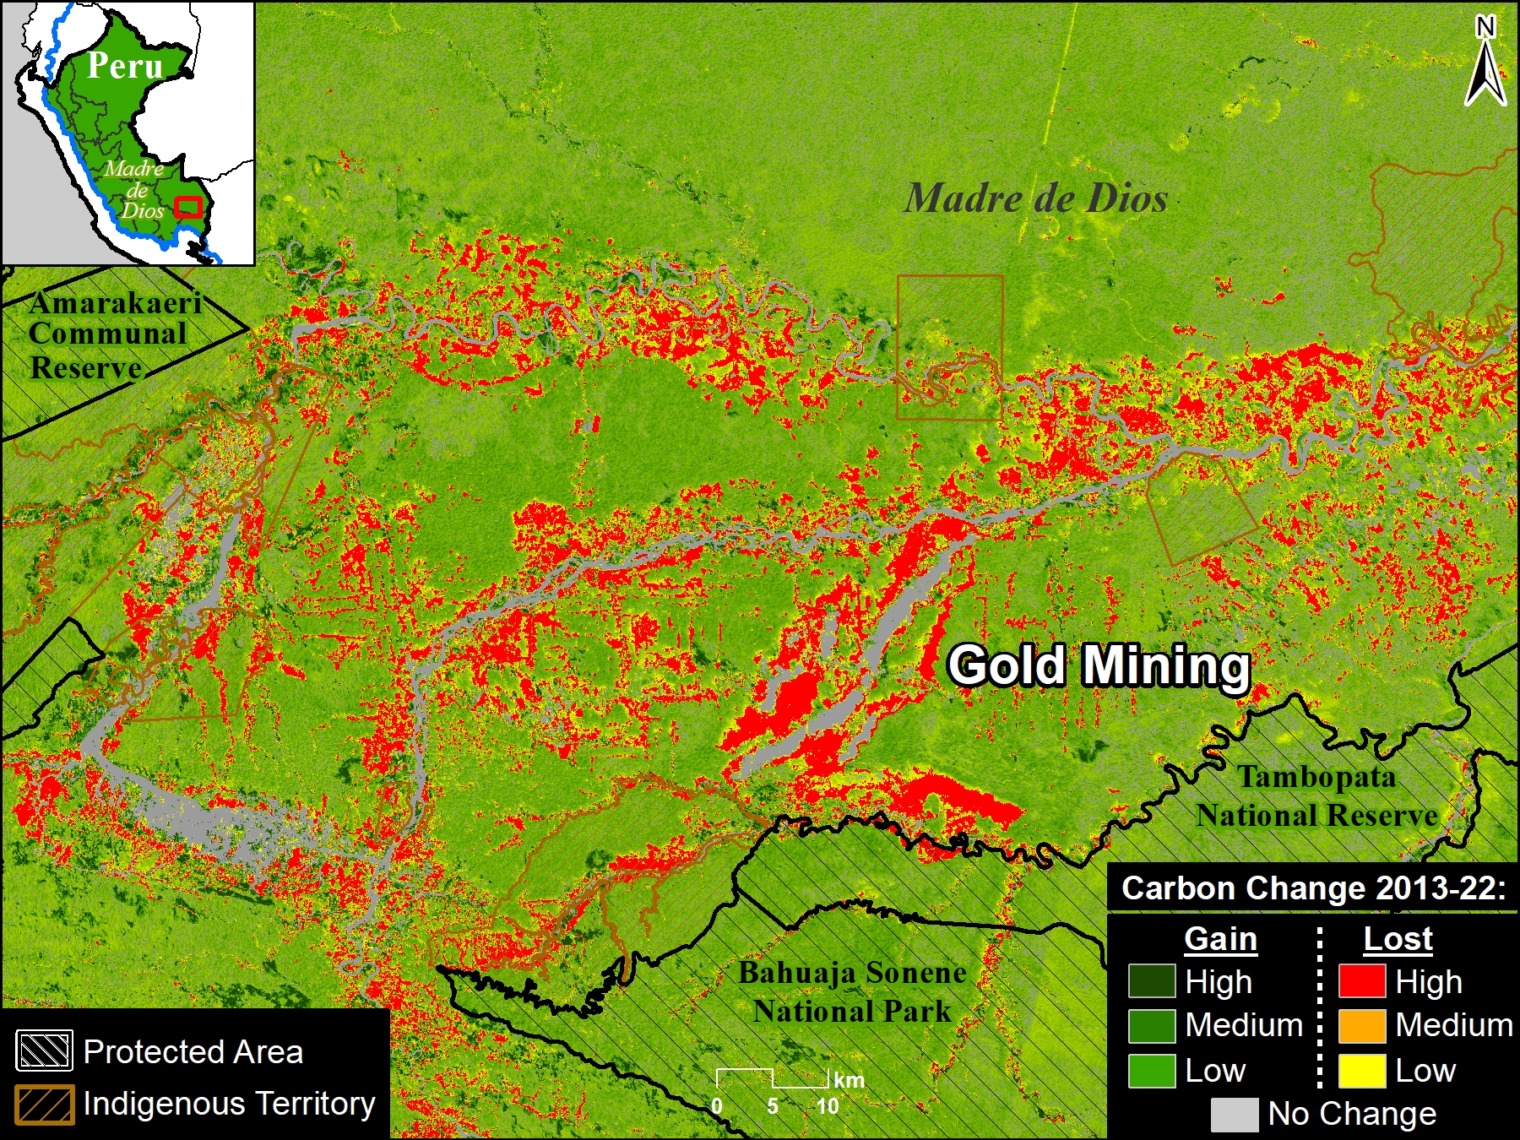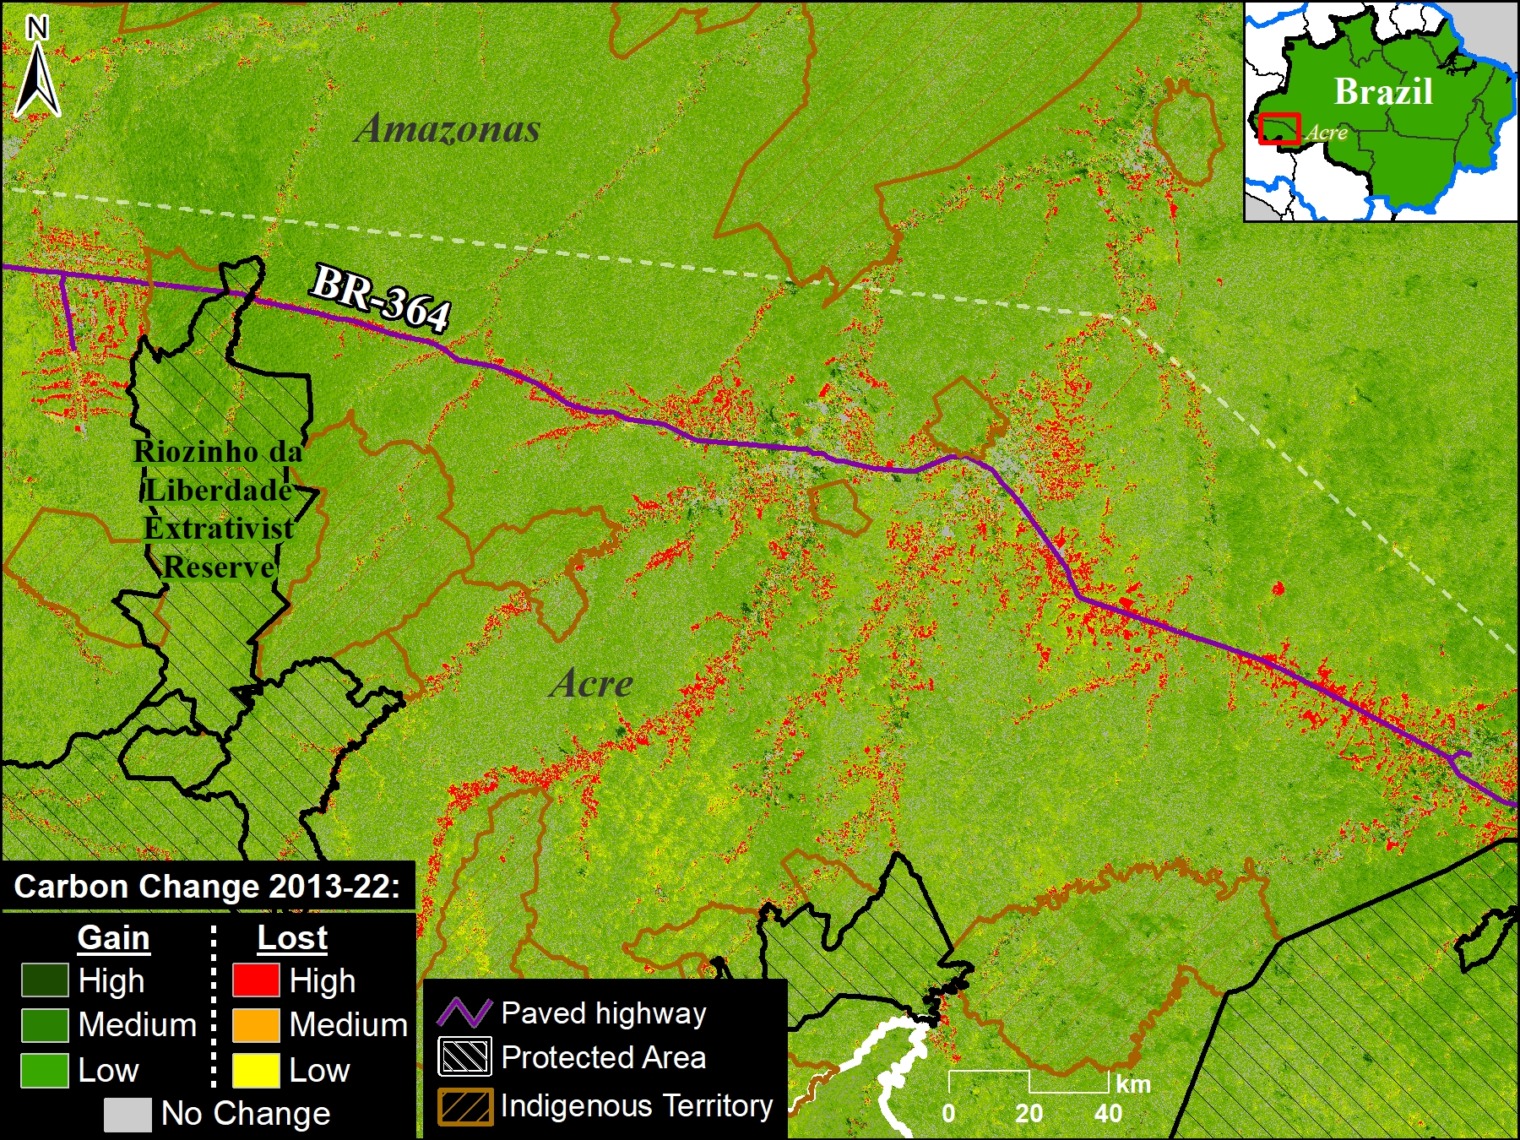
MAAP #217: Carbon across the Amazon (part 2): Peak Carbon Areas

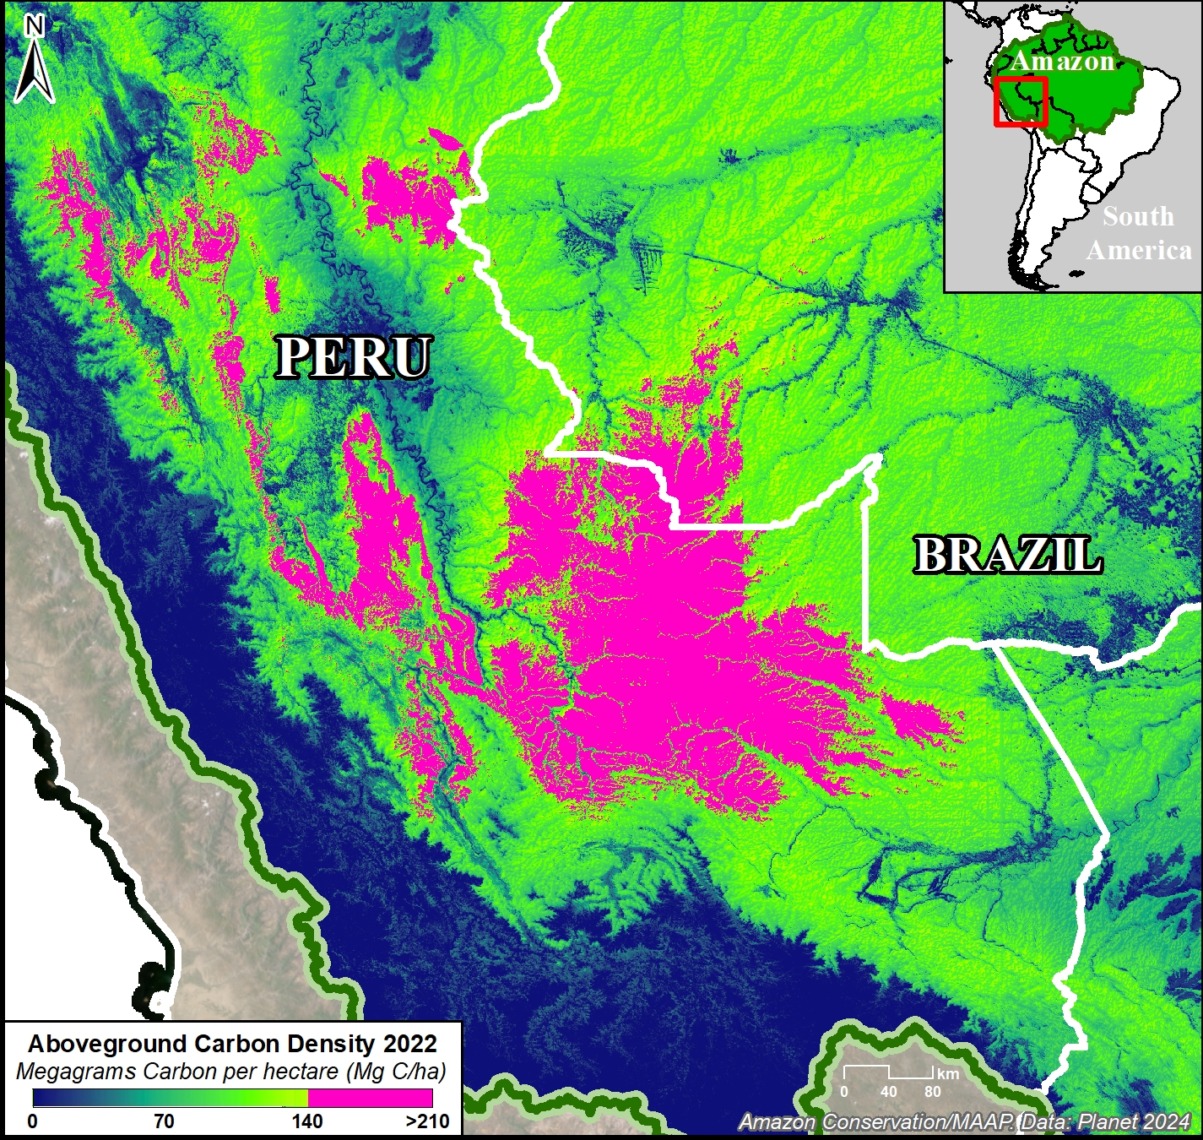
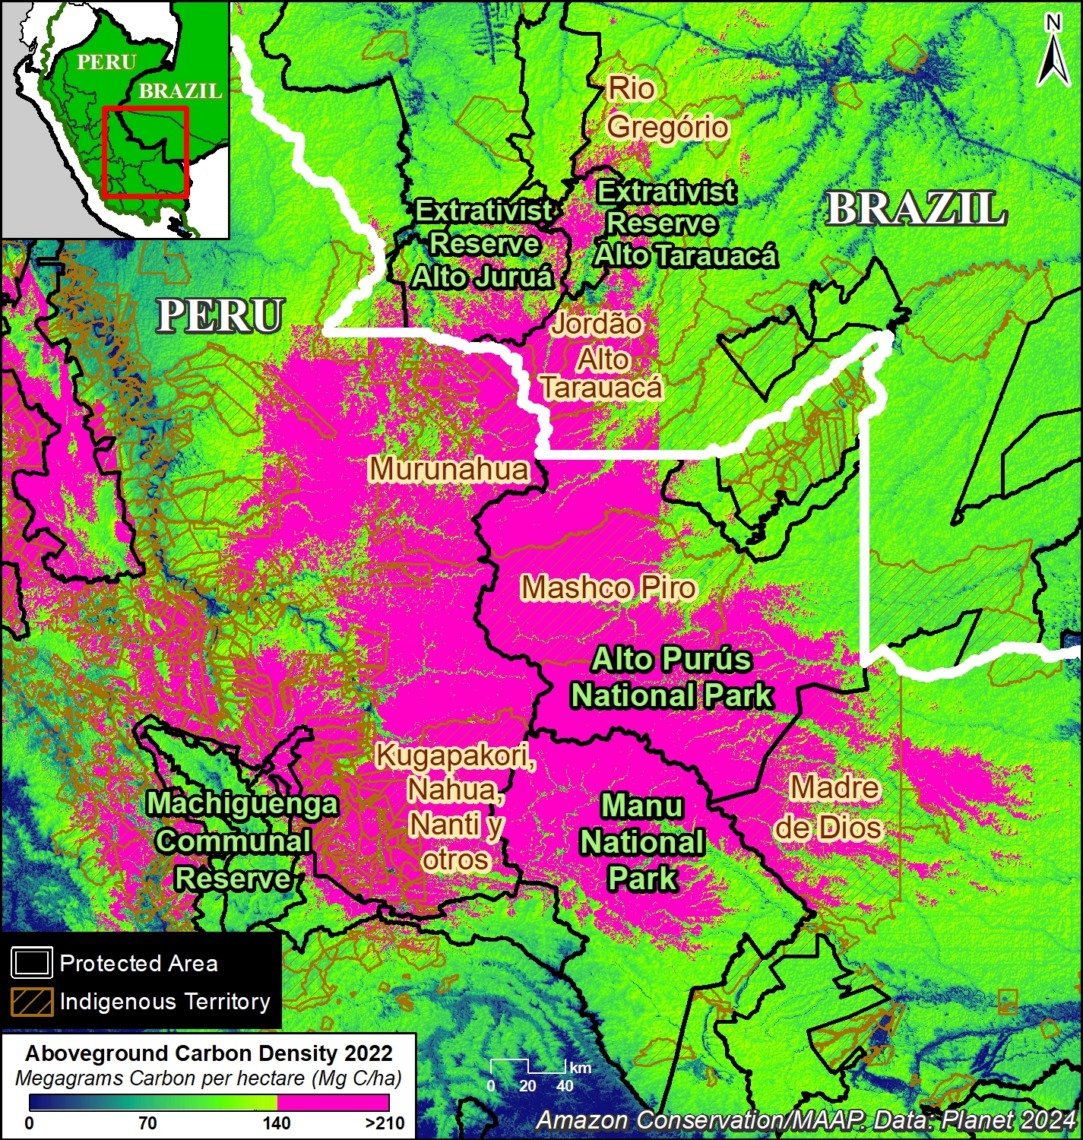
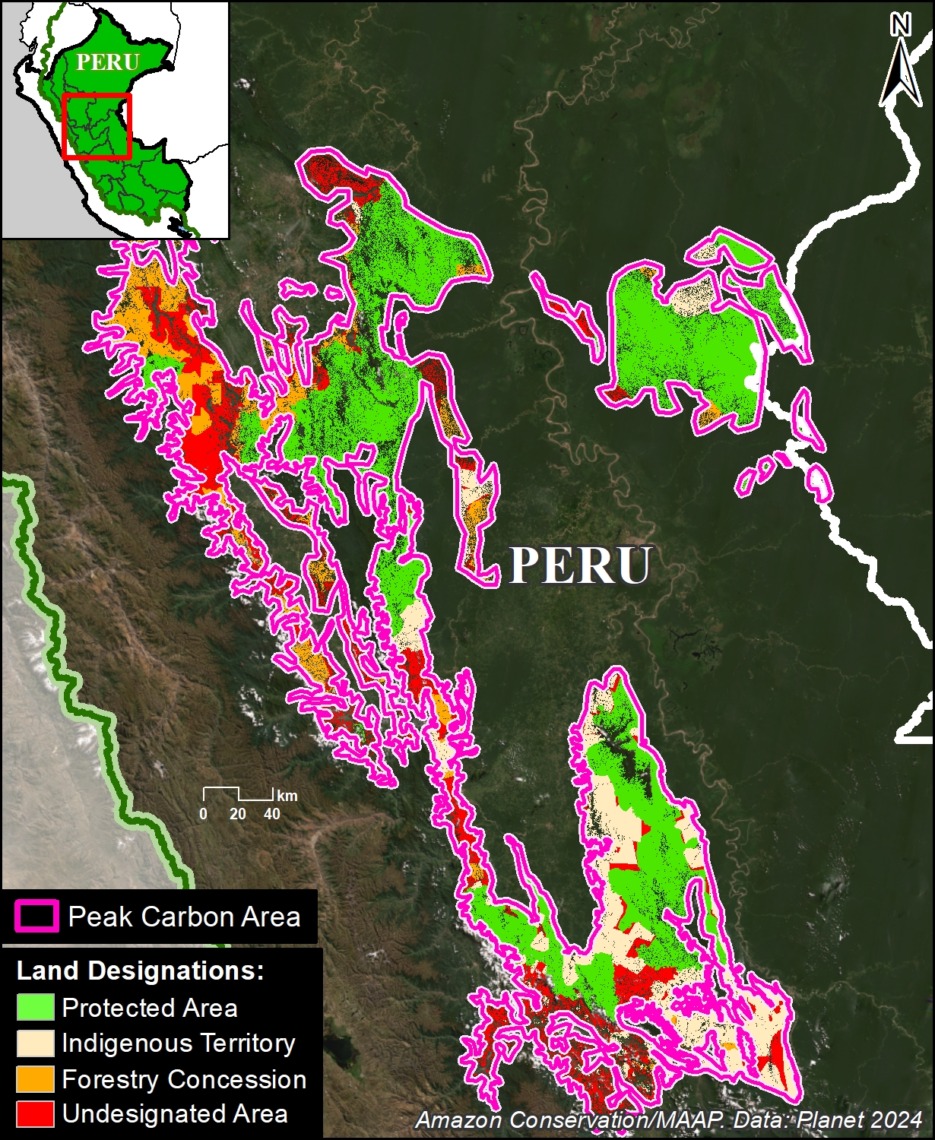
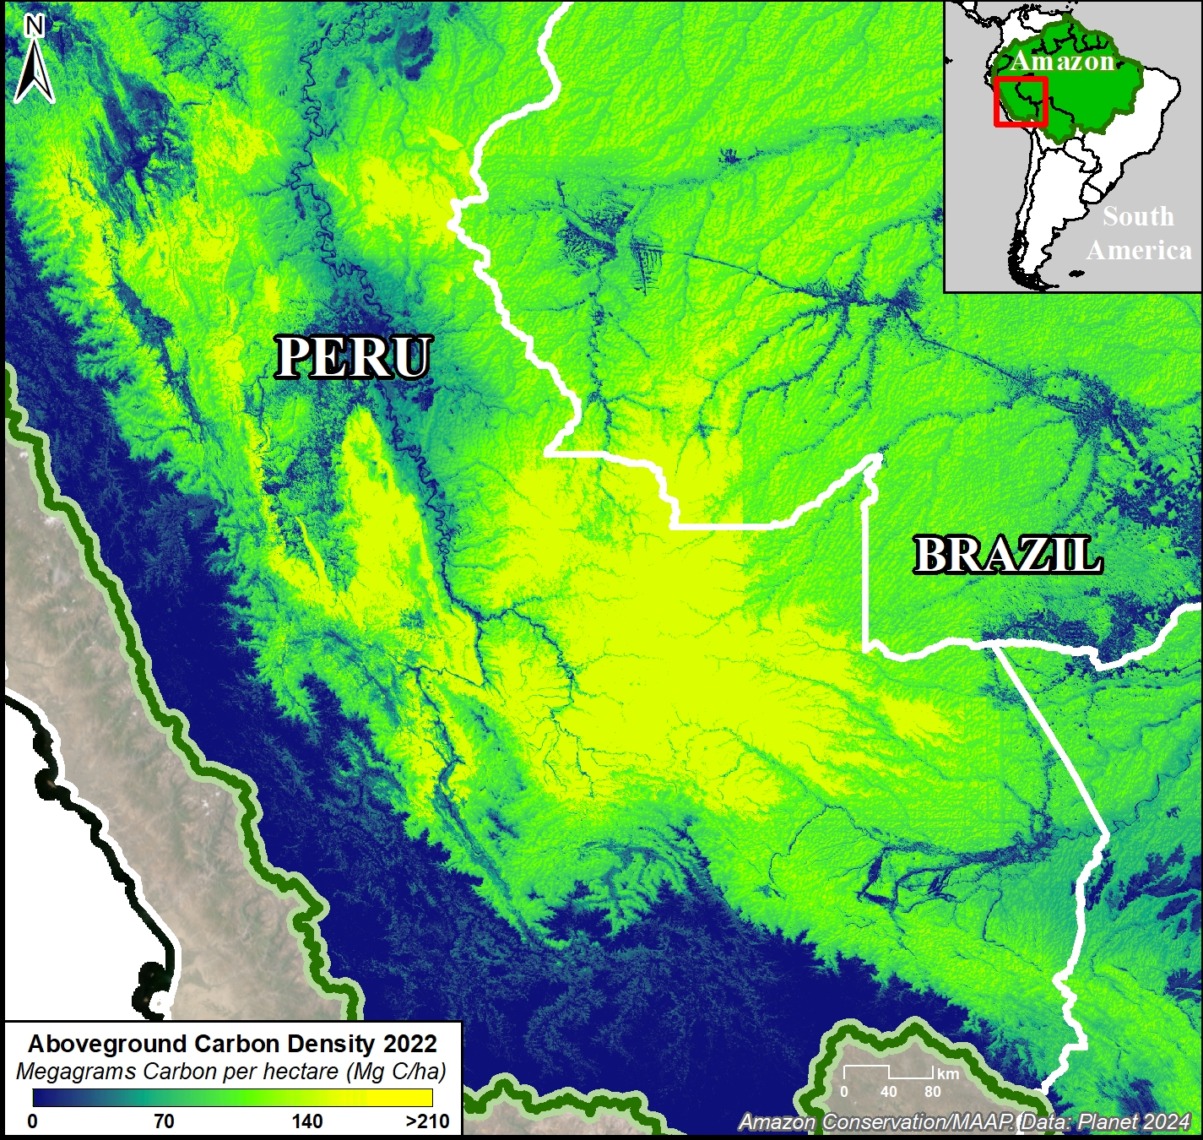
Figure 1. Example of peak carbon areas in southern Peru and adjacent western Brazil. Data: Planet.

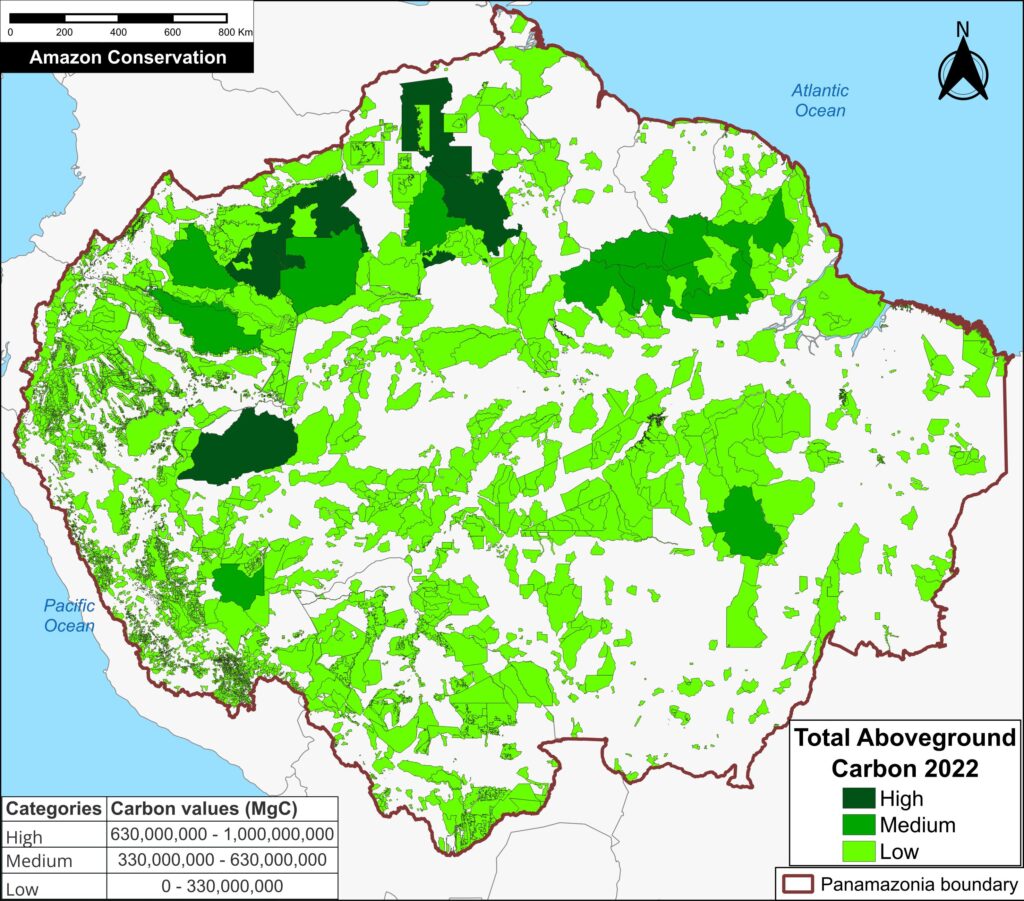
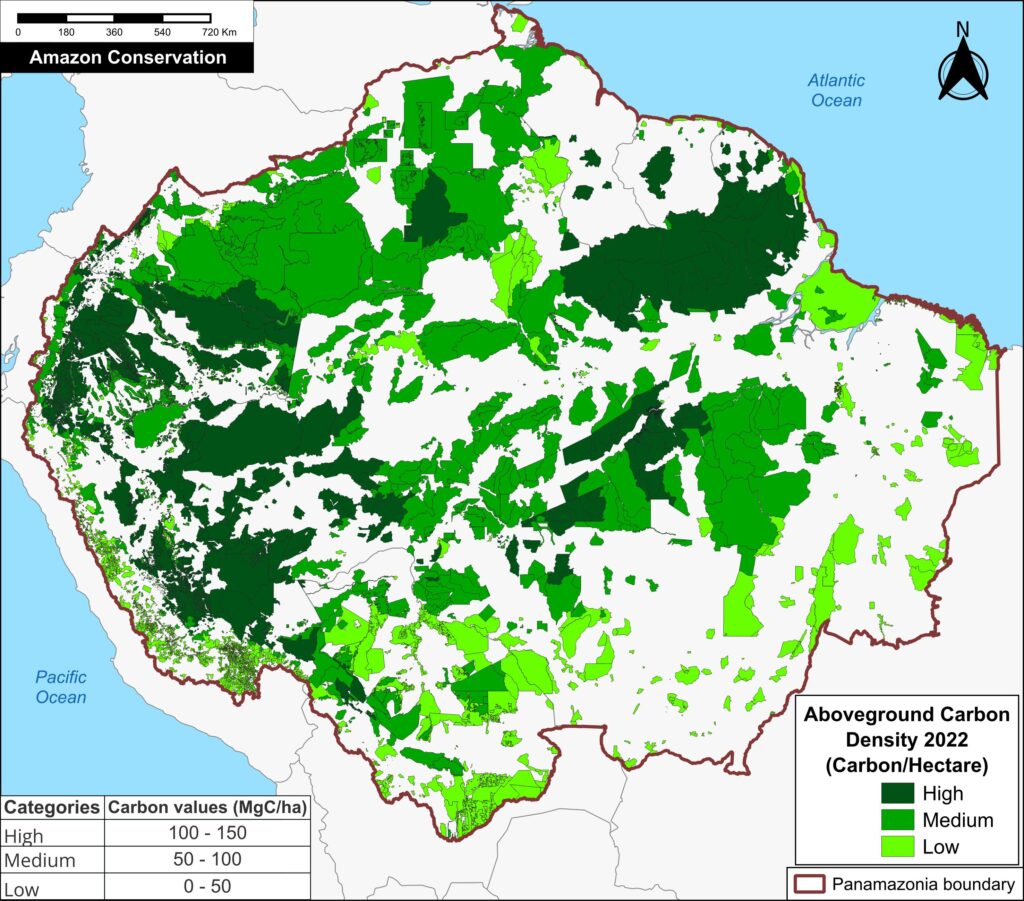
In part 1 of this series (MAAP #215), we introduced a critical new resource (Planet Forest Carbon Diligence) that provides wall-to-wall estimates for aboveground carbon density at an unprecedented 30-meter resolution. This data uniquely merges machine learning, satellite imagery, airborne lasers, and a global biomass dataset from GEDI, a NASA mission.4

In that report, we showed that the Amazon contains 56.8 billion metric tons of aboveground carbon (as of 2022), and described key patterns across all nine countries of the Amazon biome over the past decade.

Here, in part 2, we focus on the peak carbon areas of the Amazon that are home to the highest aboveground carbon levels.

These peak carbon areas correspond to the upper one-third of aboveground carbon density levels (>140 metric tons per hectare).1

They likely have experienced minimal degradation (such as selective logging, fire, and edge/fragmentation effects)2 and are thus a good proxy for high-integrity forests.

Figure 1 shows an important example of peak carbon areas in southern Peru and adjacent western Brazil.

The peak carbon areas are often found in the remote primary forests of protected areas and Indigenous territories, but some are located in forestry concessions (specifically, logging concessions) or undesignated lands (also referred to as undesignated public forests).

Our goal in this report is to leverage unprecedented aboveground carbon data to reinforce the importance of these designated areas and draw attention to the remaining undesignated lands.

For example, peak carbon areas would be excellent candidates for the High Integrity Forest (HIFOR) initiative, a new financing instrument that uniquely focuses on maintaining intact tropical forests.3 HIFOR rewards the climate services that intact tropical forests provide, including ongoing net carbon removal from the atmosphere, and complements existing instruments to reduce emissions from deforestation and degradation (REDD+) by focusing on tropical forests that are largely undegraded.

Below, we detail the major findings and then zoom in on the peak carbon areas in the northeast and southwest Amazon.

Peak Carbon Areas in the Amazon   

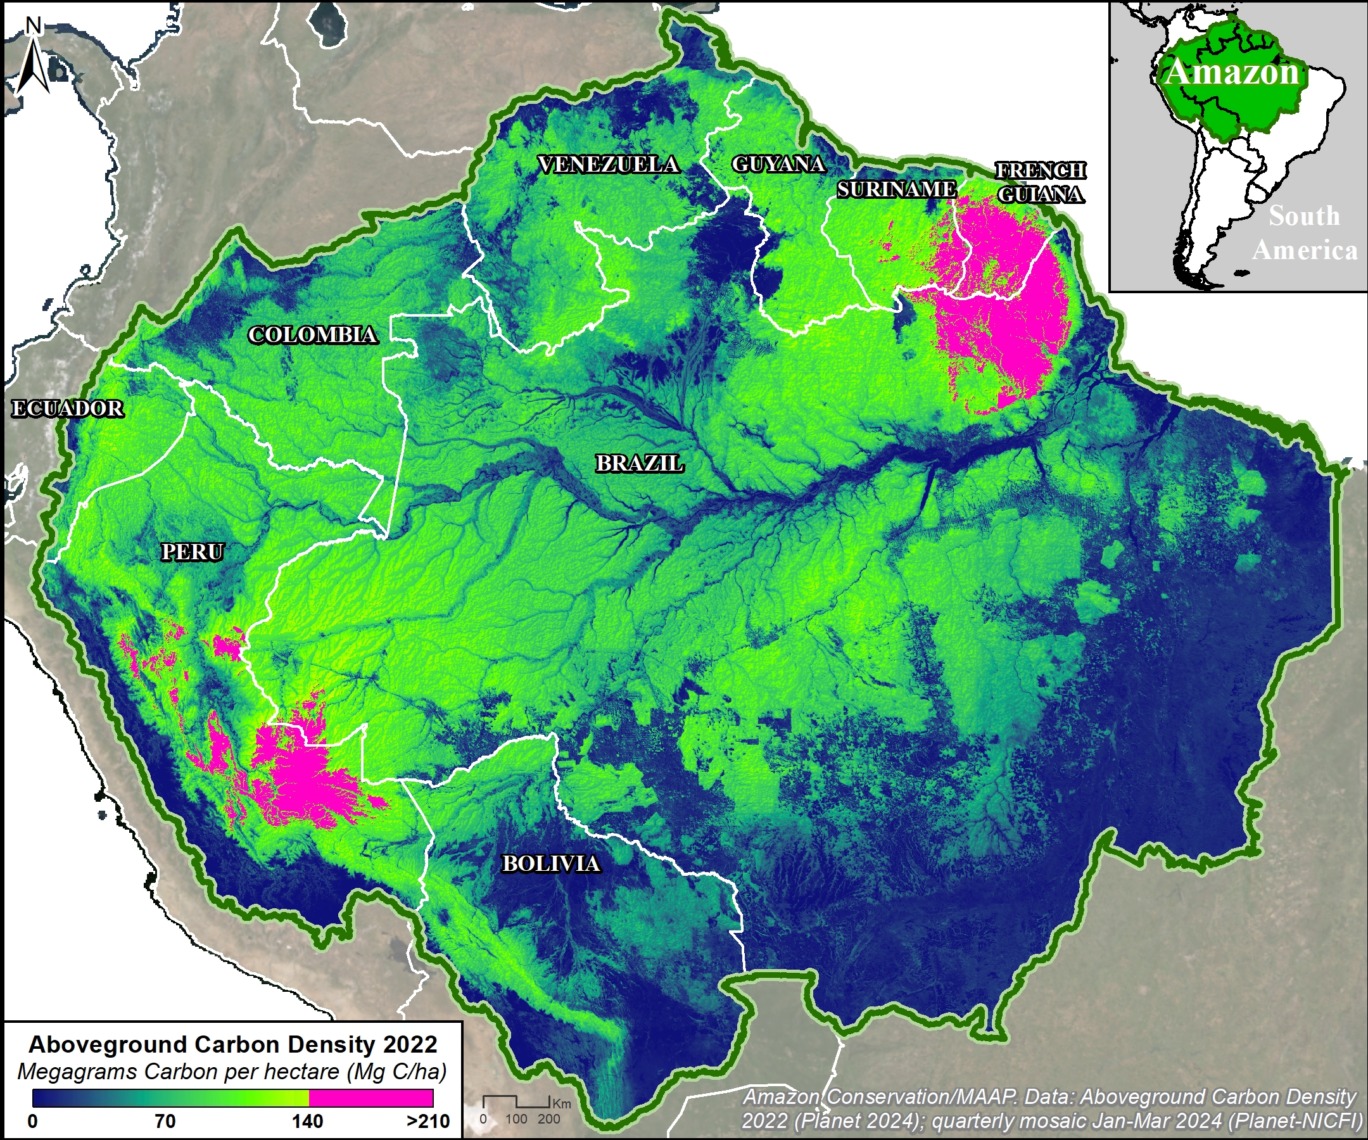
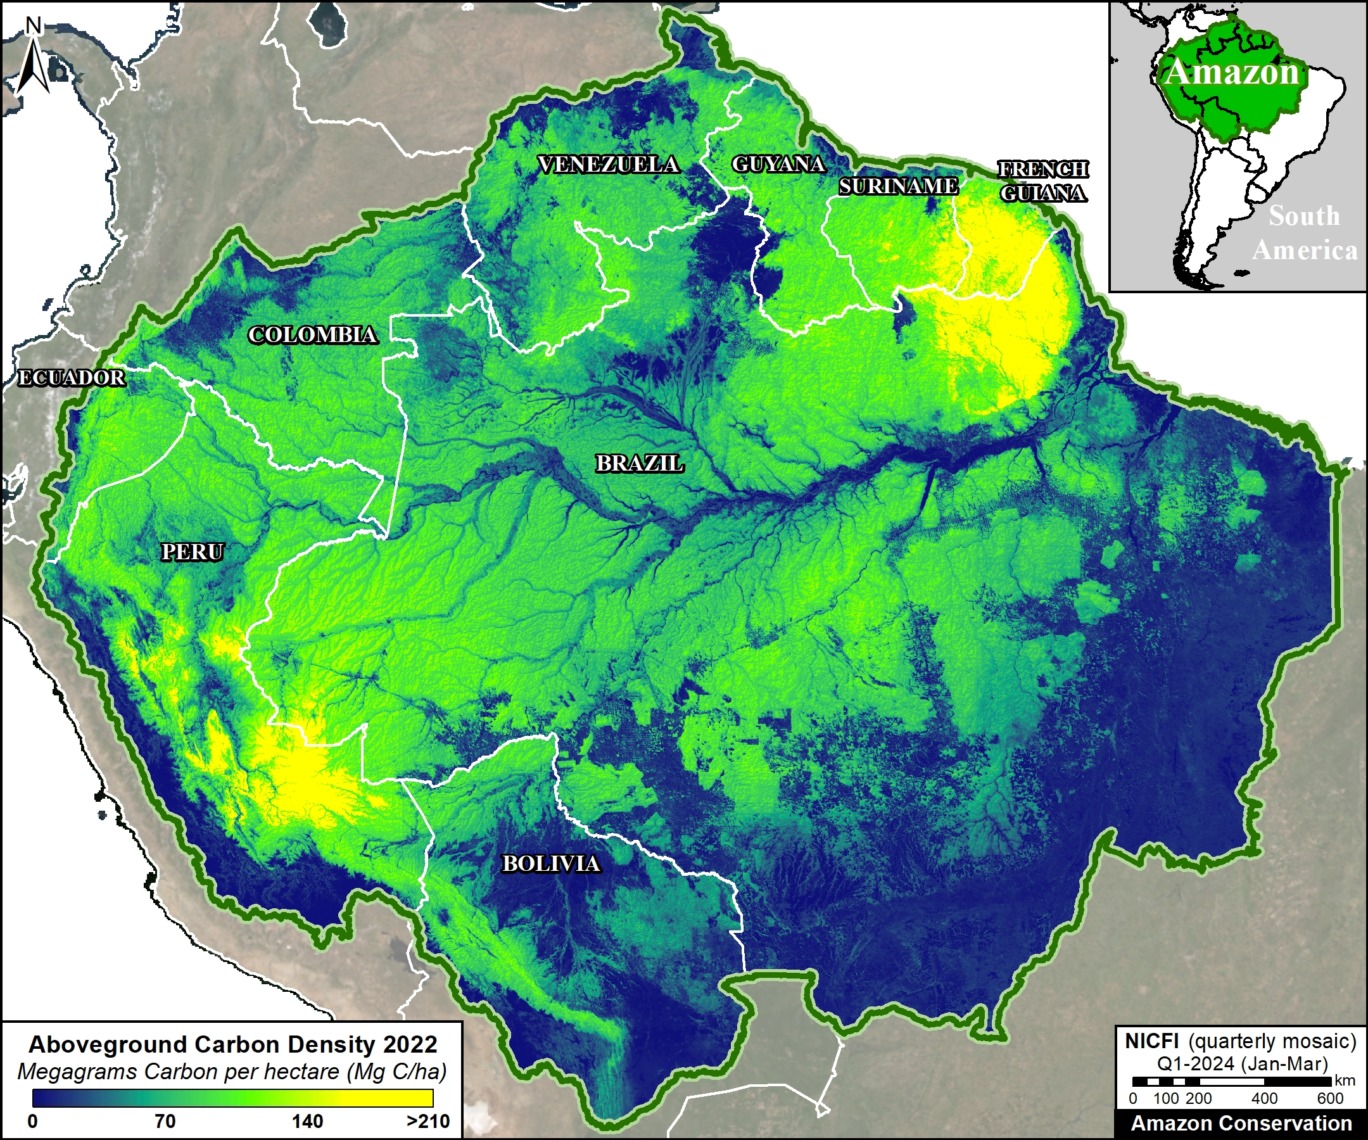
The Base Map below illustrates our major findings.

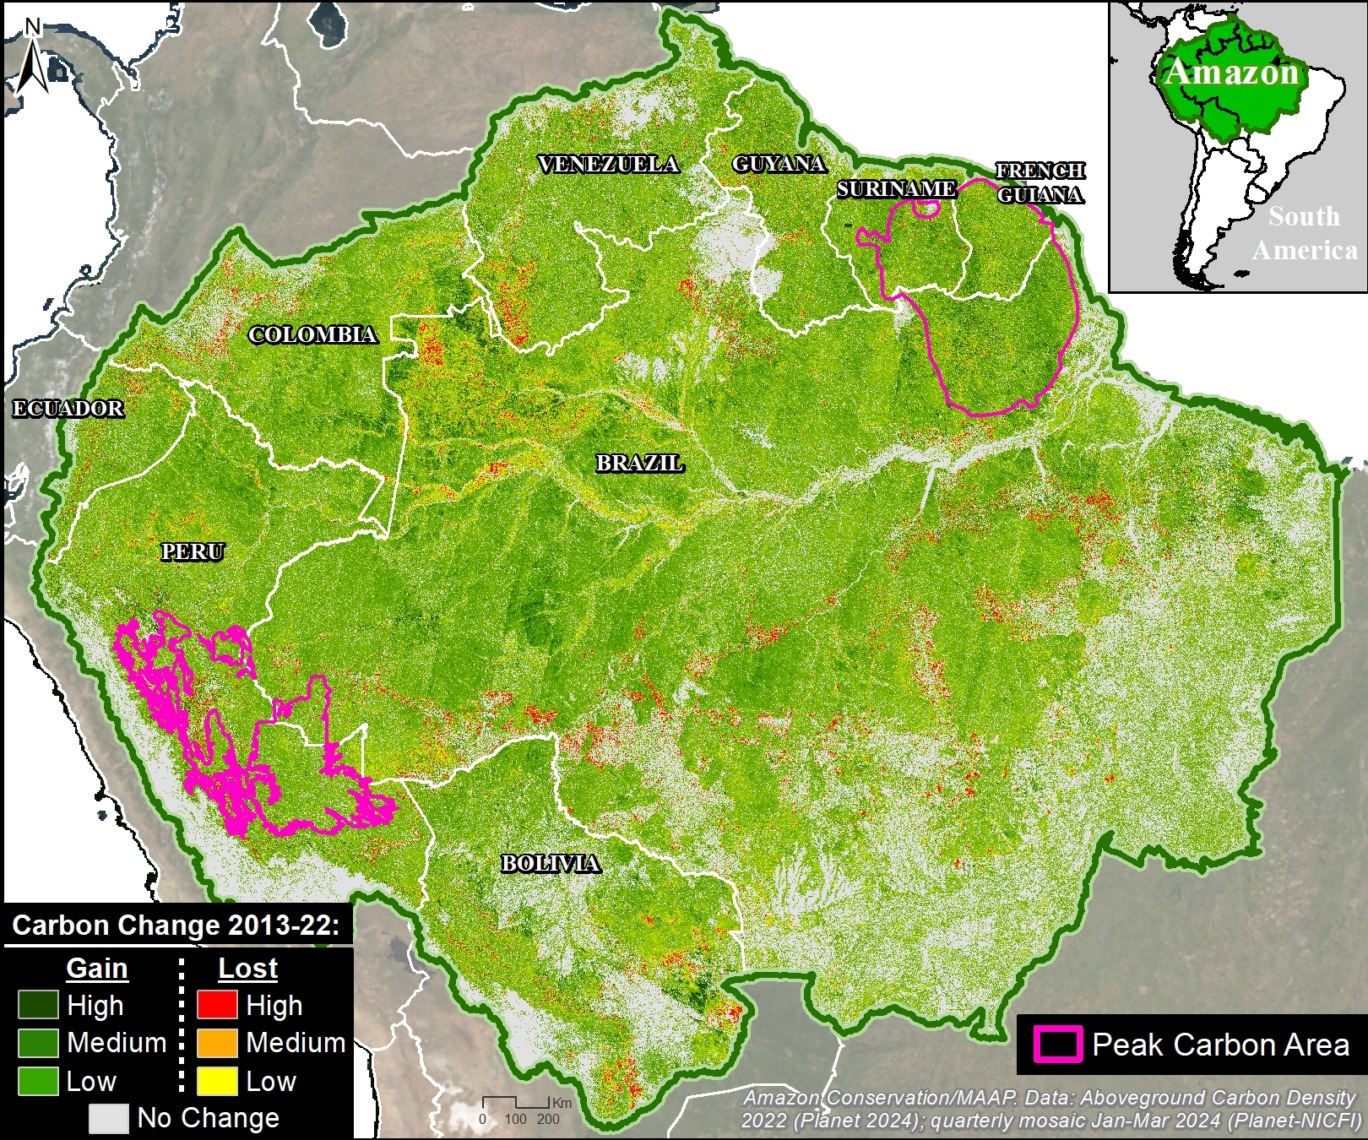
The peak carbon areas (>140 metric tons per hectare; indicated in pink) are concentrated in the southwest and northeast Amazon, covering 27.8 million hectares (11 million ha in the southwest and 16.8 million ha in the northeast).
k

Base Map. Planet Forest Carbon Diligence across the Amazon biome for the year 2022. Data: Planet.

In the southwest Amazon, peak carbon levels are found in southern & central Peru, and adjacent western Brazil.

In the northeast Amazon, peak carbon levels are found in northeast Brazil, much of French Guiana, and parts of Suriname.

By country, Brazil and Peru have the largest area of peak carbon (10.9 million and 10.1 million hectares respectively), followed by French Guiana (4.7 million ha), and Suriname (2.1 million ha).

Protected areas and Indigenous territories cover much (61%) of the peak carbon area (16.9 million hectares).

The remaining 39% remains unprotected, and arguably threatened, in undesignated lands (9.4 million hectares) and forestry concessions (1.5 million ha), respectively.

In addition, high carbon areas (>70 metric tons per hectare; indicated by the greenish-yellow coloration in the Base Map) are found in all nine countries of the Amazon biome, notably Colombia, Ecuador, Bolivia, Venezuela, and Guyana.

Southwest Amazon

­Southern Peru

Figure 2a. Peak carbon area in the southern Peruvian Amazon. Data: Planet, SERNANP, RAISG.

Figure 2a zooms in on the peak carbon area covering 7.9 million hectares in southern Peru (regions of Madre de Dios, Cusco, and Ucayali) and adjacent southwest Brazil (Acre).

Several protected areas (such as Manu and Alto Purús National Parks, and Machiguenga Communal Reserve) anchor this area.

It is also home to numerous Indigenous territories (such as Mashco Piro, Madre de Dios, and Kugapakori, Nahua, Nanti & Others Indigenous Reserves).


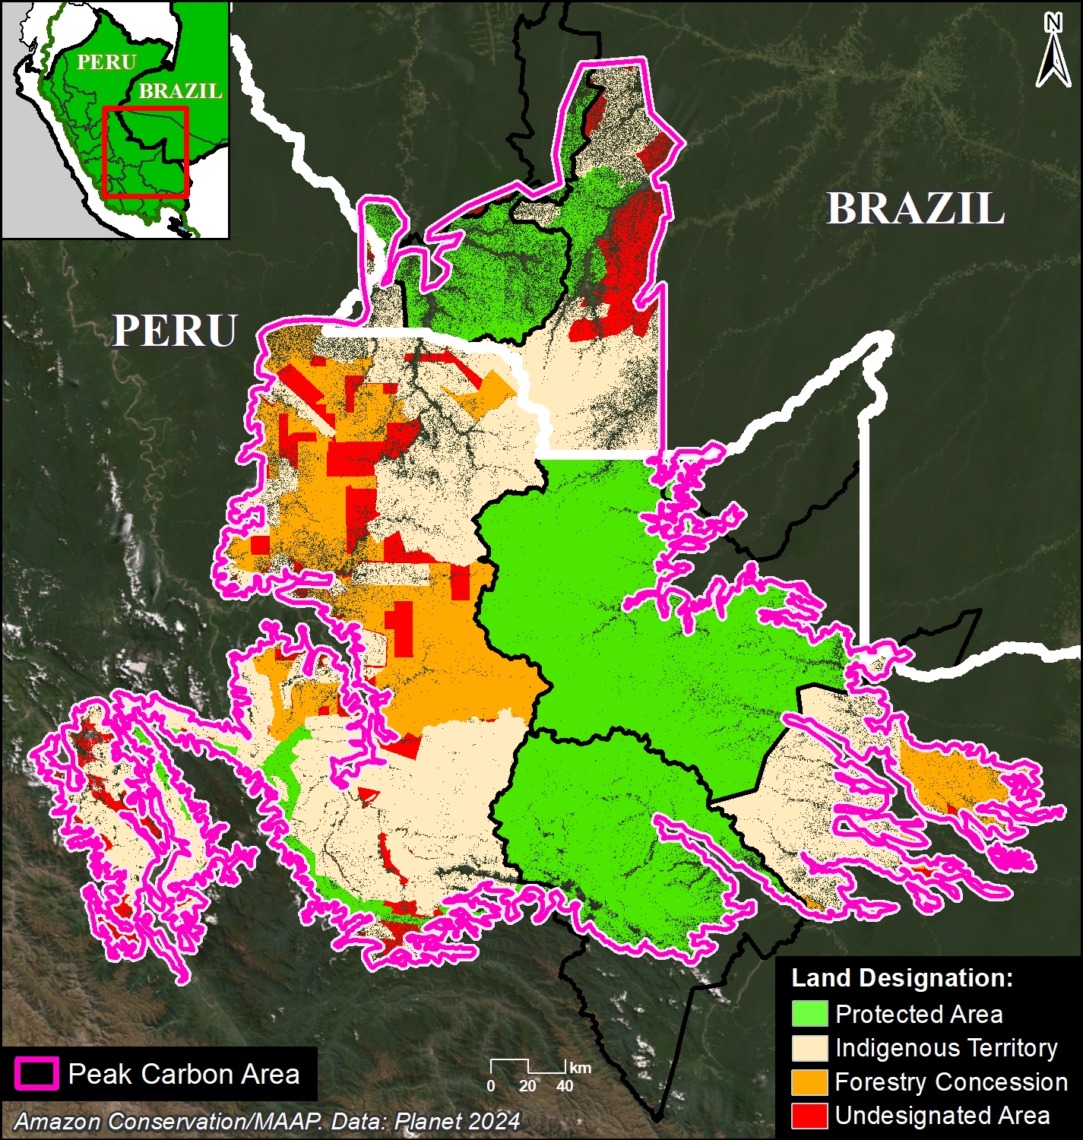
Figure 2b highlights the major land designations within the peak carbon area of southern Peru.

Figure 2b. Peak carbon areas (outlined in pink), categorized by land designation in southern Peru and adjacent western Brazil. Data: Planet, NICFI, SERNANP, SERFOR, RAISG.

Protected areas and Indigenous territories cover 77% of this area (green and brown, respectively).

The remaining 23% could be considered threatened, as they are located in forestry concessions or undesignated lands (orange and red, respectively). Thus, these areas are ideal candidates for increased protection to maintain their peak carbon levels.


Central Peru

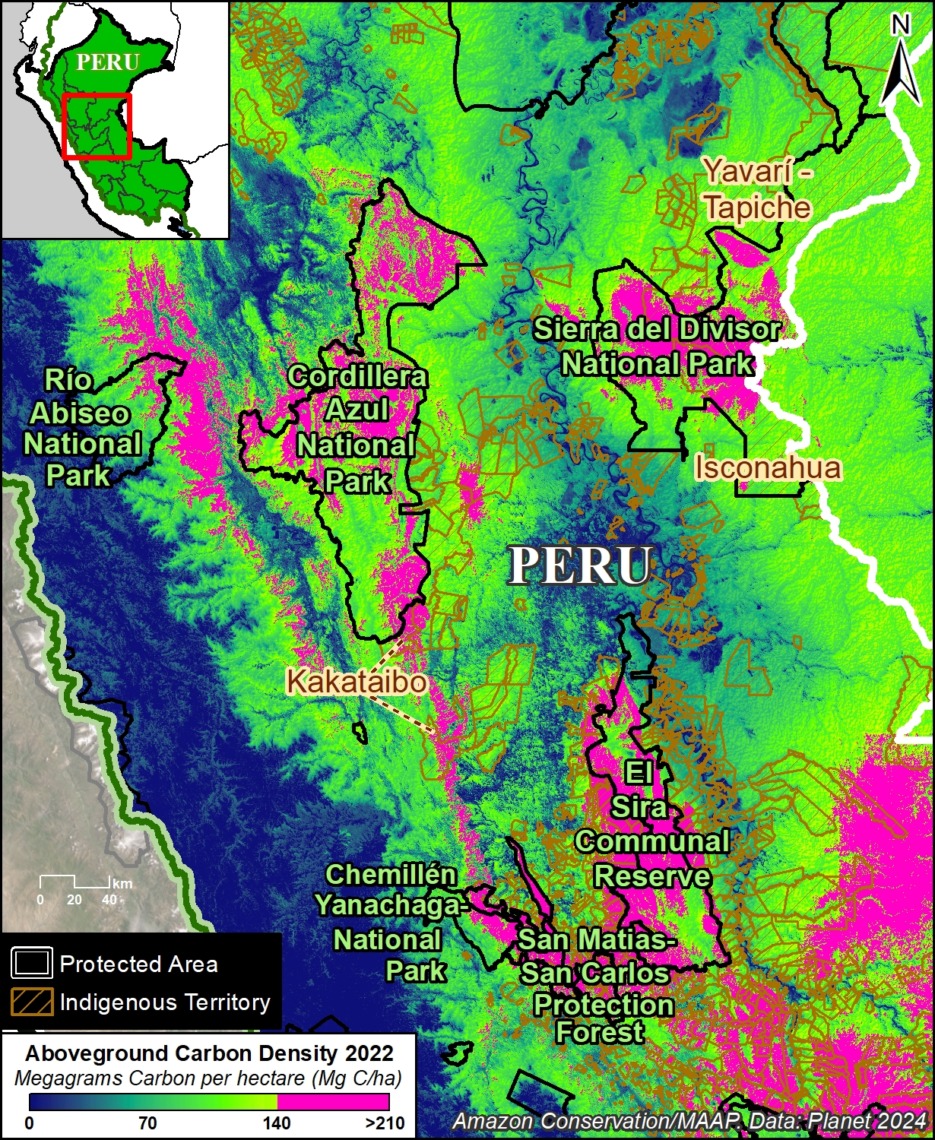
Figure 3a. Peak carbon area in the central Peruvian Amazon. Data: Planet, SERNANP, RAISG.

Figure 3a zooms in on the peak carbon area in the central Peruvian Amazon, which covers 3.1 million hectares in the regions of Ucayali, Loreto, Huánuco, Pasco, and San Martin.

Several protected areas (including Sierra del Divisor, Cordillera Azul, Rio Abiseo, and Yanachaga–Chemillén National Parks, and El Sira Communal Reserve) anchor this area.

It is also home to numerous Indigenous territories (such as Kakataibo, Isconahua, and Yavarí Tapiche Indigenous Reserves).


Figure 3b. Peak carbon areas (outlined in pink), categorized by land designation in central Peru. Data: Planet, NICFI, SERNANP, SERFOR, RAISG.

Figure 3b highlights the major land designations within the peak carbon area of central Peru.

Protected areas and Indigenous territories cover 69% of this area (green and brown, respectively).

The remaining 31% could be considered threatened, as they are located in forestry concessions or undesignated lands (orange and red, respectively), and are ideal candidates for increased protection.


Northeast Amazon

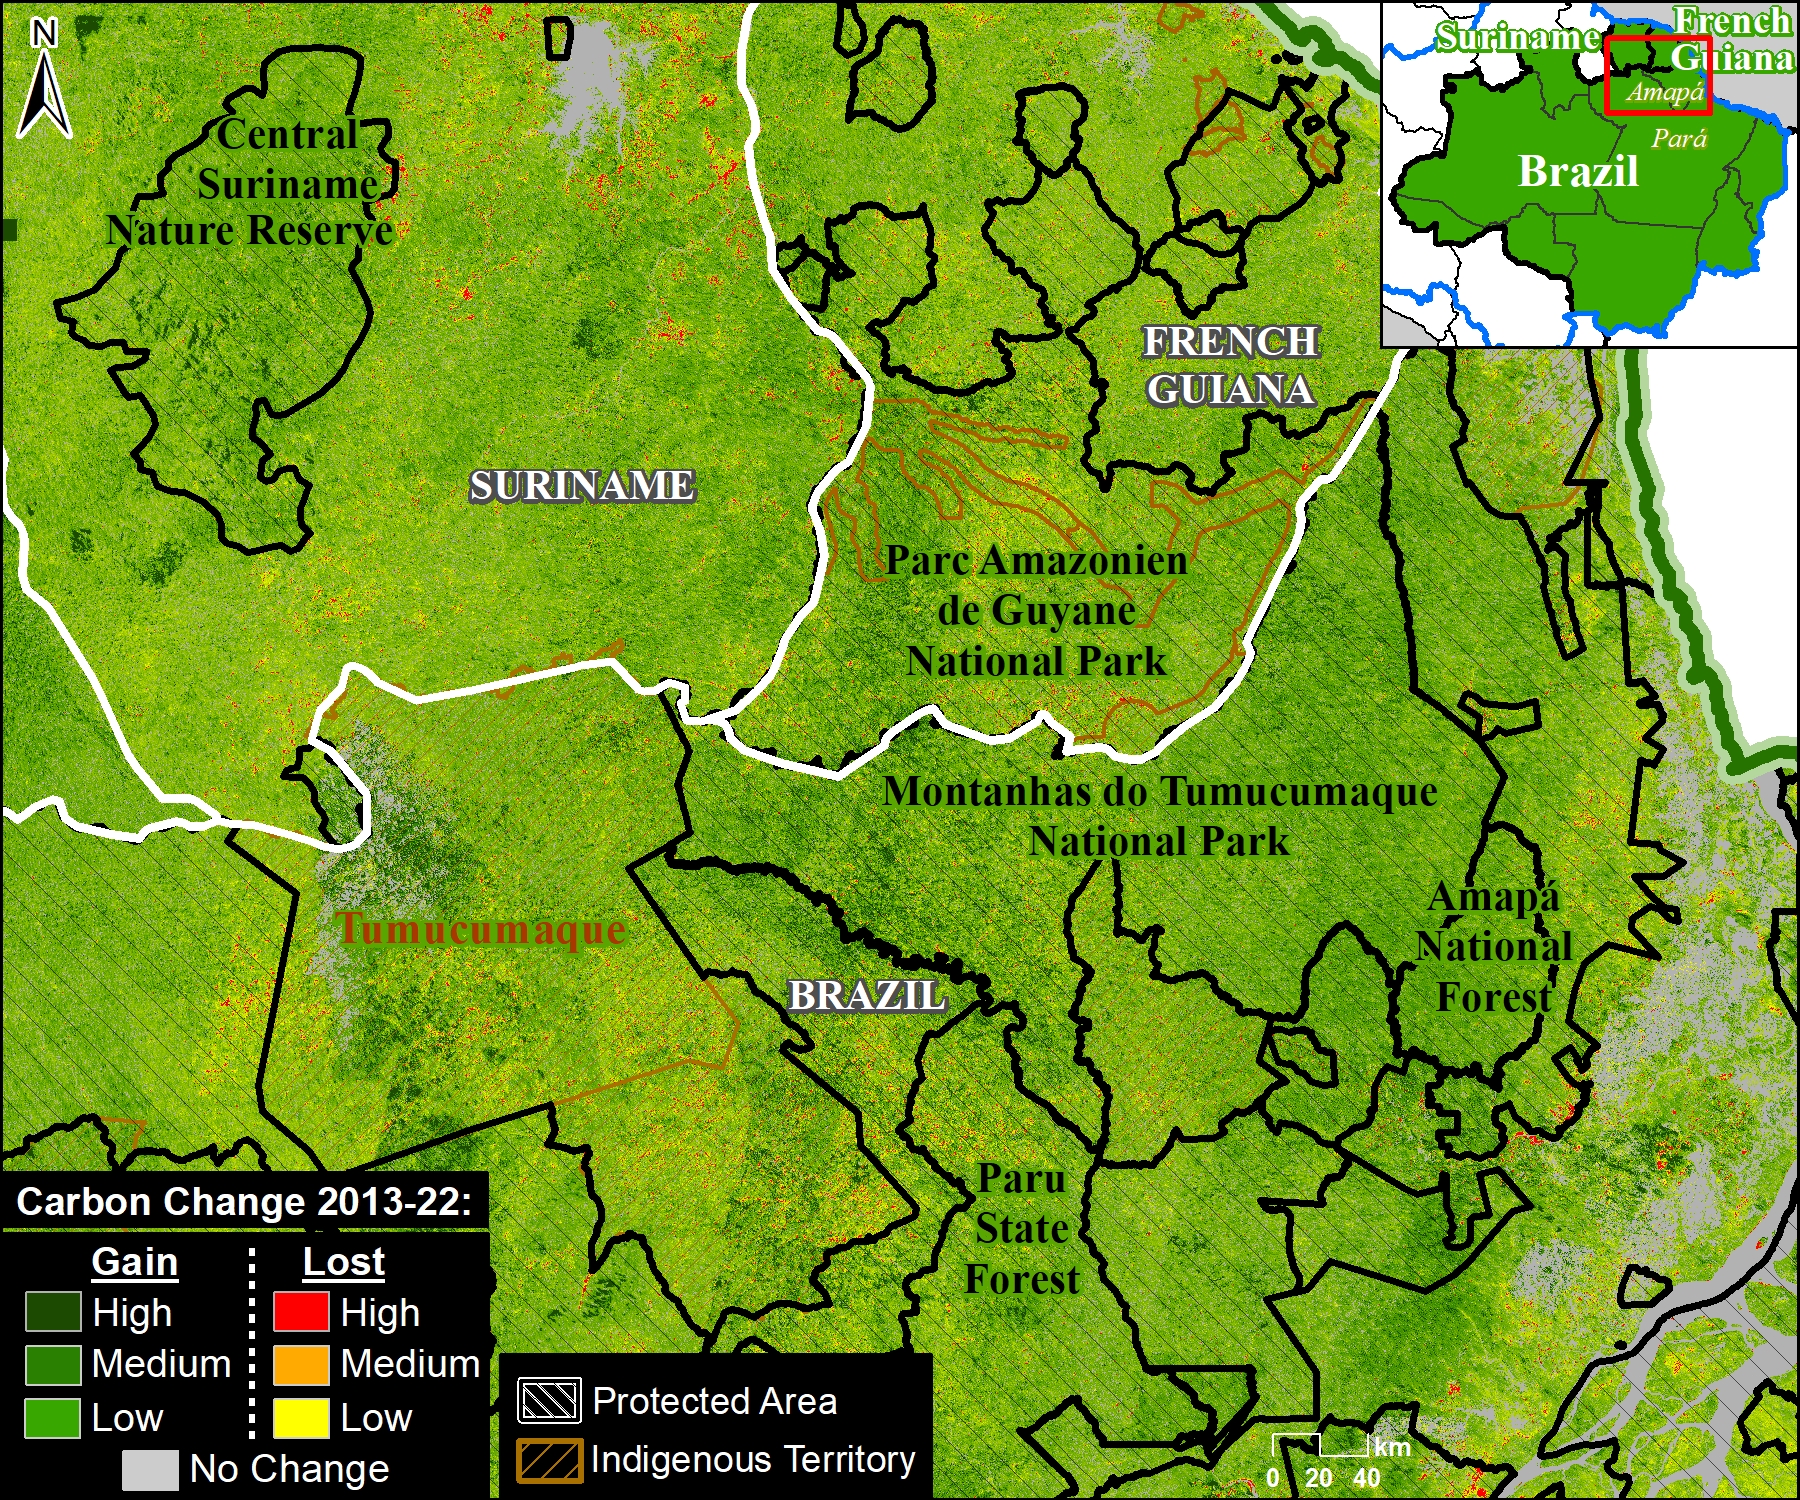
Figure 4a. Peak carbon area in the tri-border region of the northeast Amazon. Data: Planet, RAISG.

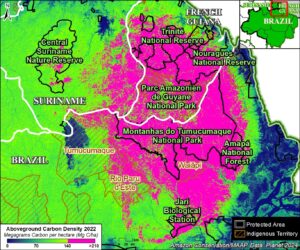
Figure 4a zooms in on the peak carbon area in the tri-border region of the northeast Amazon, which covers 16.8 million hectares in northern Brazil, French Guiana, and Suriname.

Several protected areas (including Montanhas do Tumucumaque National Park in northeast Brazil, Amazonien de Guyane National Park in French Guiana, and Central Suriname Nature Reserve) anchor this area.

It is also home to numerous Indigenous territories (such as Tumucumaque, Rio Paru de Este, and Wayãpi in northeast Brazil).


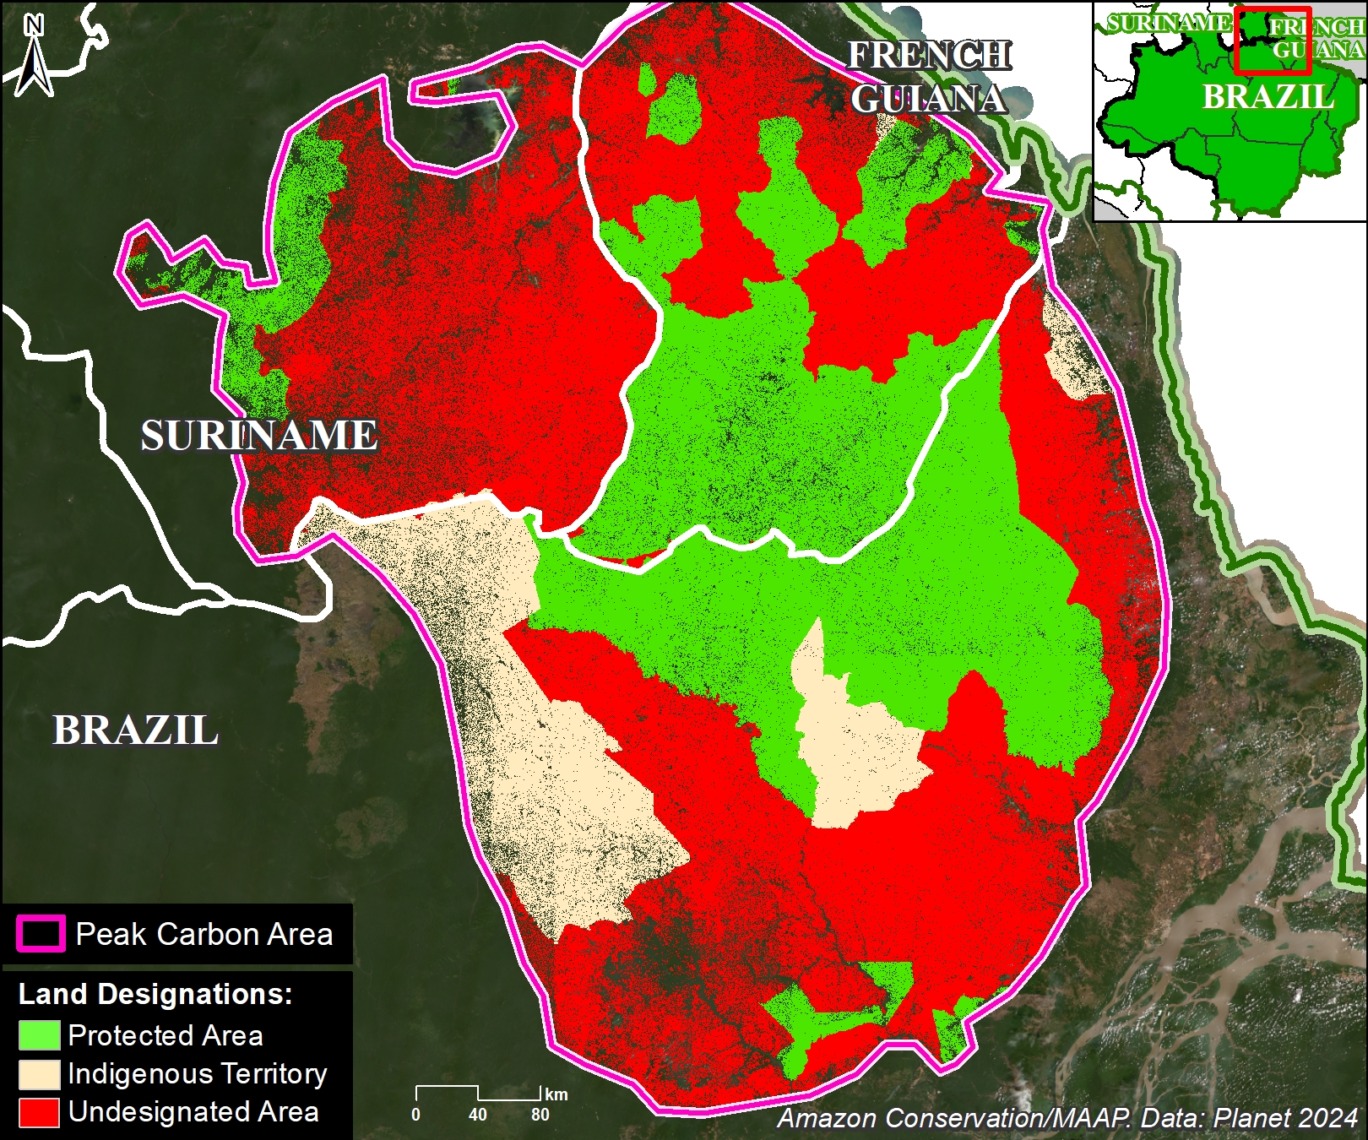
Figure 4b. Peak carbon areas (outlined in pink), categorized by land designation in northeast Amazon. Data: Planet, NICFI, RAISG.

Figure 4b highlights the major land designations within the peak carbon area of the northeast Amazon.

Protected areas and Indigenous territories cover just over half (51%) of this area (green and brown, respectively).

The remaining 49% could be considered threatened, as they are located in undesignated lands, and are ideal candidates for increased protection.


Notes

1 We selected this value (upper 33%) to capture the highest aboveground carbon areas and include a range of high carbon areas. Additional analyses could target different values, such as the highest 10% or 20% of aboveground carbon.

2  A recent paper documented a strong relationship between selective logging and aboveground carbon loss (Csillik et al. 2024, PNAS). The link between forest edges and carbon is presented in Silva Junior et al, Science Advances.

3 High Integrity Forest (HIFOR) units are a new tradable asset that recognizes and rewards the essential climate services and biodiversity conservation that intact tropical forests provide, including ongoing net removal of CO2 from the atmosphere. For more information see https://www.wcs.org/our-work/climate-change/forests-and-climate-change/hifor

4 For more information, see the “What is Forest Carbon Diligence?” section in this recent blog from Planet.

Citation

Finer M, Mamani N, Anderson C, Rosenthal A (2024) Carbon across the Amazon (part 2): Peak Carbon Areas. MAAP #217.

MAAP #215: Unprecedented Look at Carbon across the Amazon (part 1)

Figure 1. Example of Planet Forest Carbon Diligence, focused on southern Peru and adjacent western Brazil.

The Amazon biome has long been one of the world’s largest carbon sinks, helping stabilize the global climate.

Precisely estimating this carbon, however, has been a challenge. Fortunately, new satellite-based technologies are providing major advances, most notably NASA’s GEDI mission (see MAAP #213) and, most recently, Planet Forest Carbon Diligence.1

Here, we focus on the latter, analyzing Planet’s cutting-edge new dataset, featuring a 10-year historical time series (2013 – 2022) with wall-to-wall estimates for aboveground carbon density at 30-meter resolution.

As a result, we can produce high-resolution aboveground carbon maps and estimates for anywhere and everywhere across the vast Amazon (see Figure 1).

Through a generous sharing agreement with Planet, we have been granted access to this data across the entire Amazon biome for the analysis presented in the following three-part series:

  1. Estimate and illustrate total aboveground forest carbon across the Amazon biome in unprecedented detail (see results of this first report, below).
    j
  2. Highlight which parts of the Amazon are home to the highest aboveground carbon levels, including protected areas and Indigenous territories (see second report, MAAP #217).
    l
  3. Present emblematic deforestation cases that have resulted in the highest aboveground carbon emissions across the Amazon (see third report, MAAP #220).

Major Results

Carbon across the Amazon

Based on our analysis of Planet Forest Carbon Diligence, we estimate that the Amazon contained 56.8 billion metric tons of aboveground carbon, as of 2022 (see Base Map). Applying a standard root-to-shoot ratio conversion (26%), this estimate increases to 71.5 billion metric tons of above and belowground carbon. This total is equivalent to nearly two years of global carbon dioxide emissions at the peak 2022 level (37.15 billion metric tons).5

The peak carbon levels are largely concentrated in the southwest Amazon (southern Peru and adjacent western Brazil) and northeast Amazon (northeast Brazil, French Guiana, and Suriname).

Base Map. Planet Forest Carbon Diligence across the Amazon biome.

Total Carbon by Country

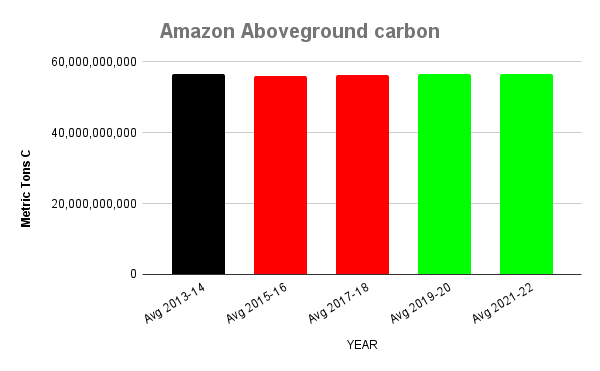
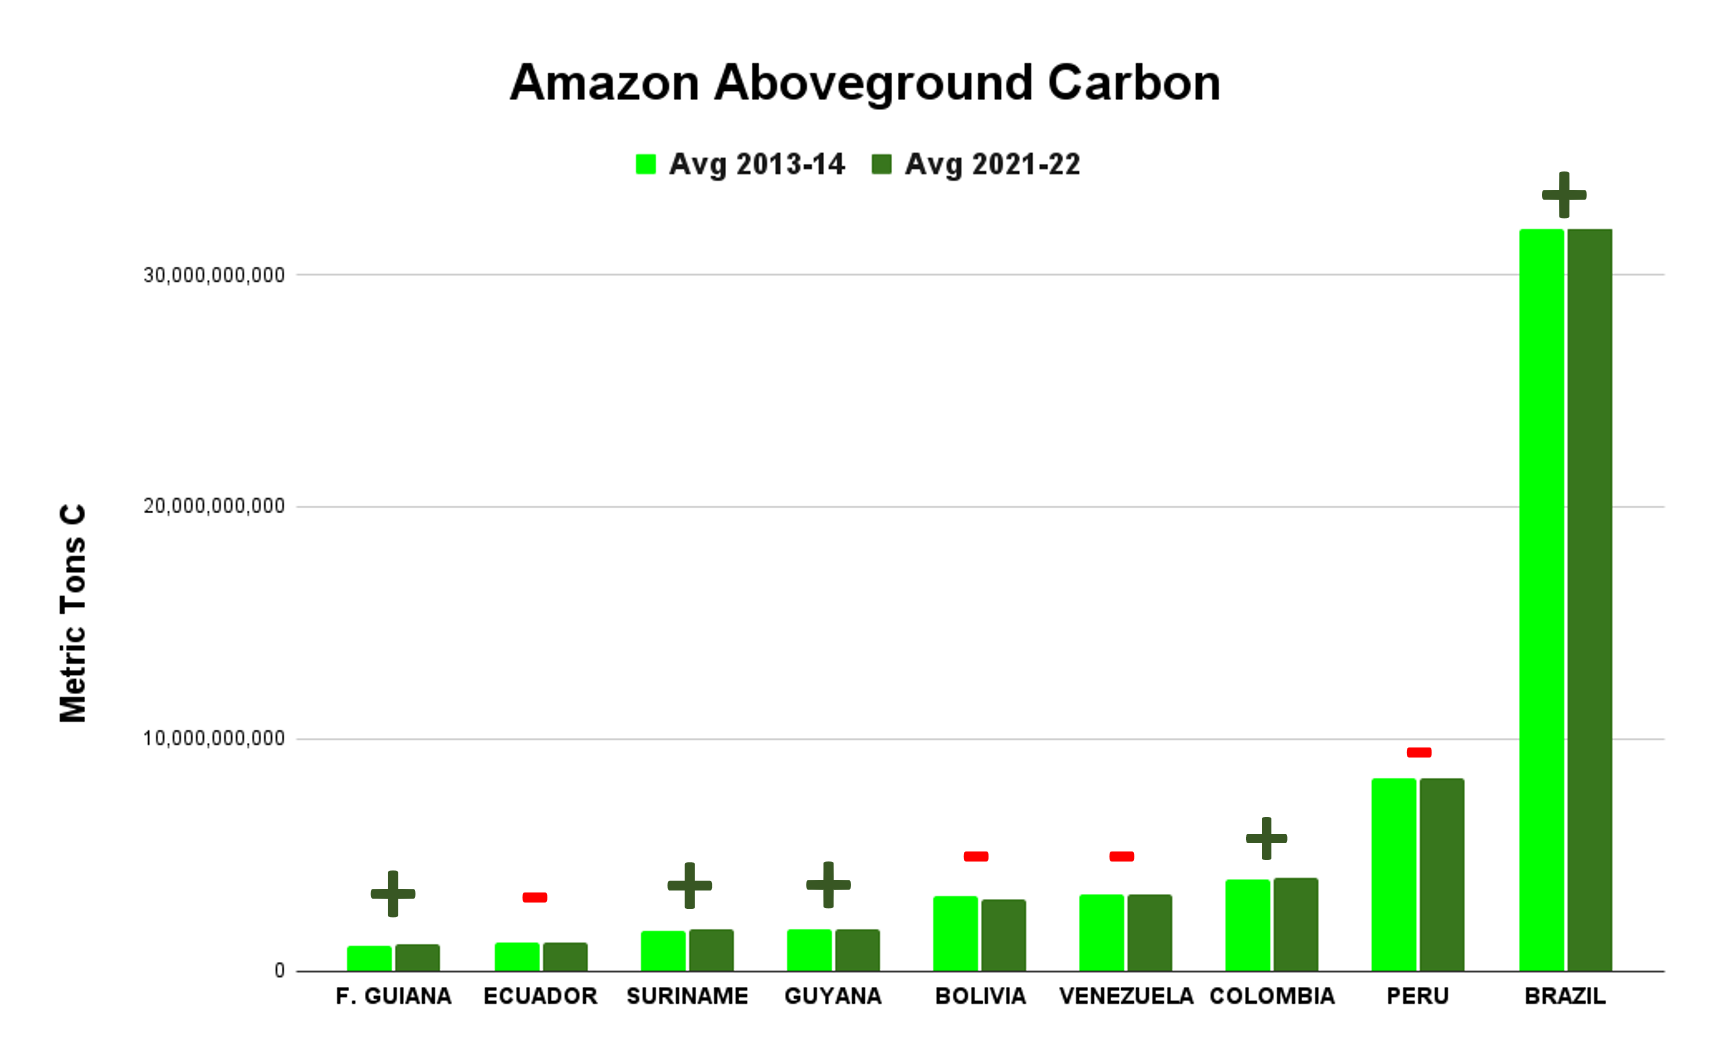
As shown in Graph 1, countries with the most aboveground carbon are 1) Brazil (57%; 32.1 billion metric tons), 2) Peru (15%; 8.3 billion metric tons), 3) Colombia (7%; 4 billion metric tons), 4) Venezuela (6%; 3.3 billion metric tons), and 5) Bolivia (6%; 3.2 billion metric tons). These countries are followed by Guyana (3%; 2 billion metric tons), Suriname (3%; 1.6 billion metric tons), Ecuador (2%; 1.2 billion metric tons), and French Guiana (2%; 1.1 billion metric tons).

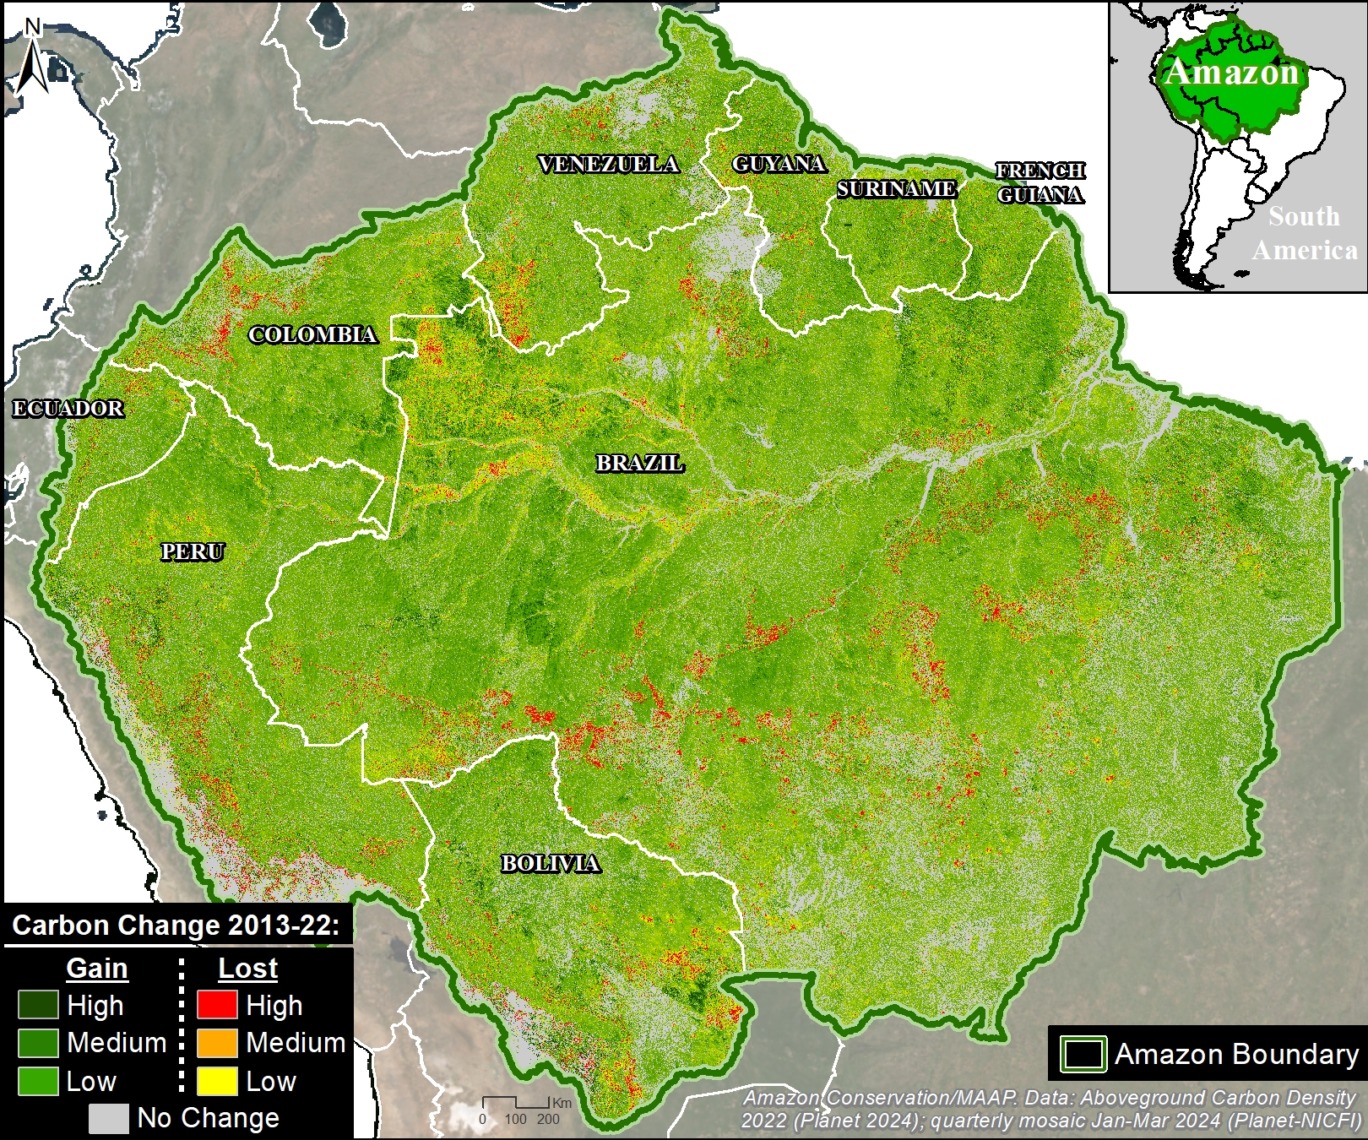
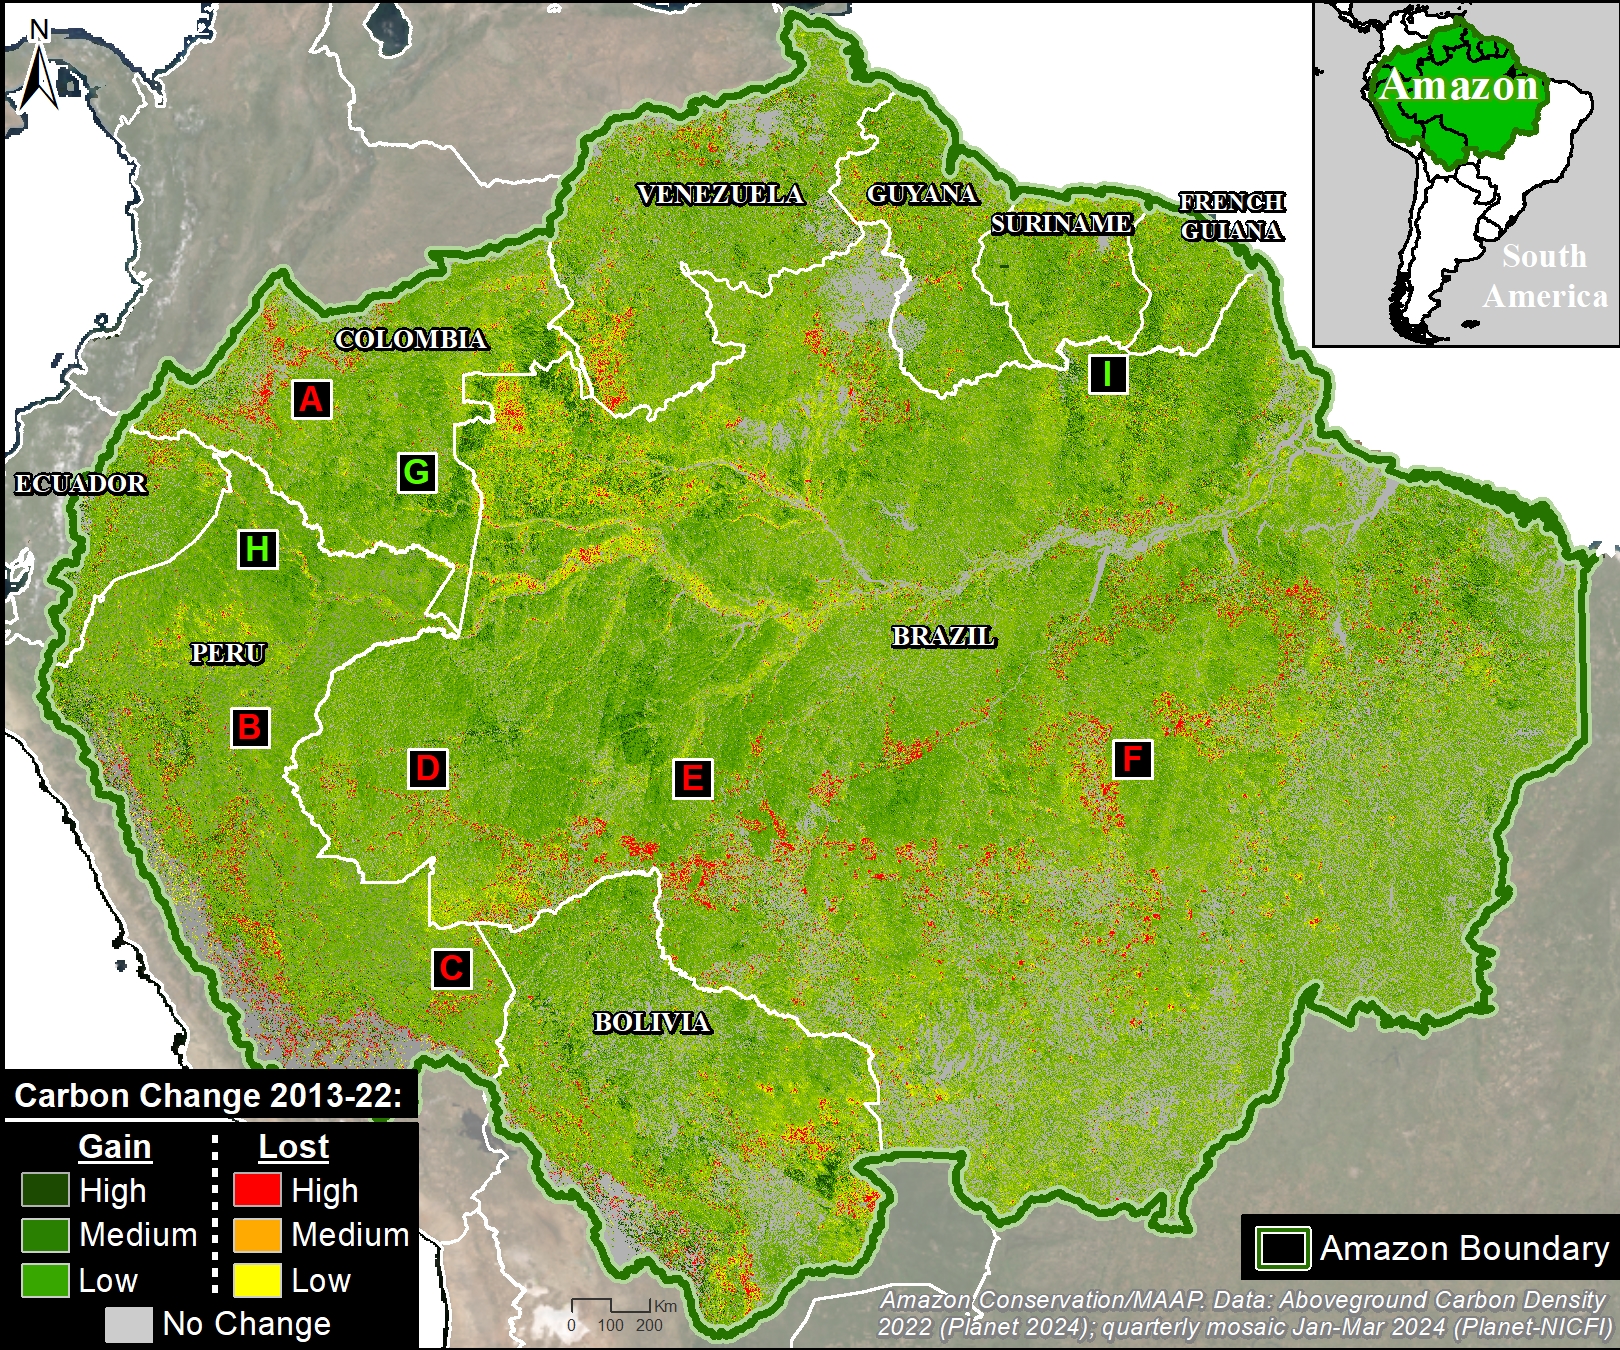
Overall, we documented the total gain of 64.7 million metric tons of aboveground carbon across the Amazon during the ten years between 2013 and 2022.2 In other words, the Amazon is still functioning as a critical carbon sink.

The countries with the most aboveground carbon gain over the past ten years are 1) Brazil, 2) Colombia, 3) Suriname, 4) Guyana, and 5) French Guiana. Note that we show Brazil as a carbon sink (gain of 102.8 million metric tons), despite other recent studies showing it as a carbon source.3 Also note the important gains in aboveground carbon across several key High Forest cover, Low Deforestation (HFLD) countries, namely Colombia, Suriname, Guyana, and French Guiana.4

In contrast, the countries with the most aboveground carbon loss over the past ten years are 1) Bolivia, 2) Venezuela, 3) Peru, and 4) Ecuador.

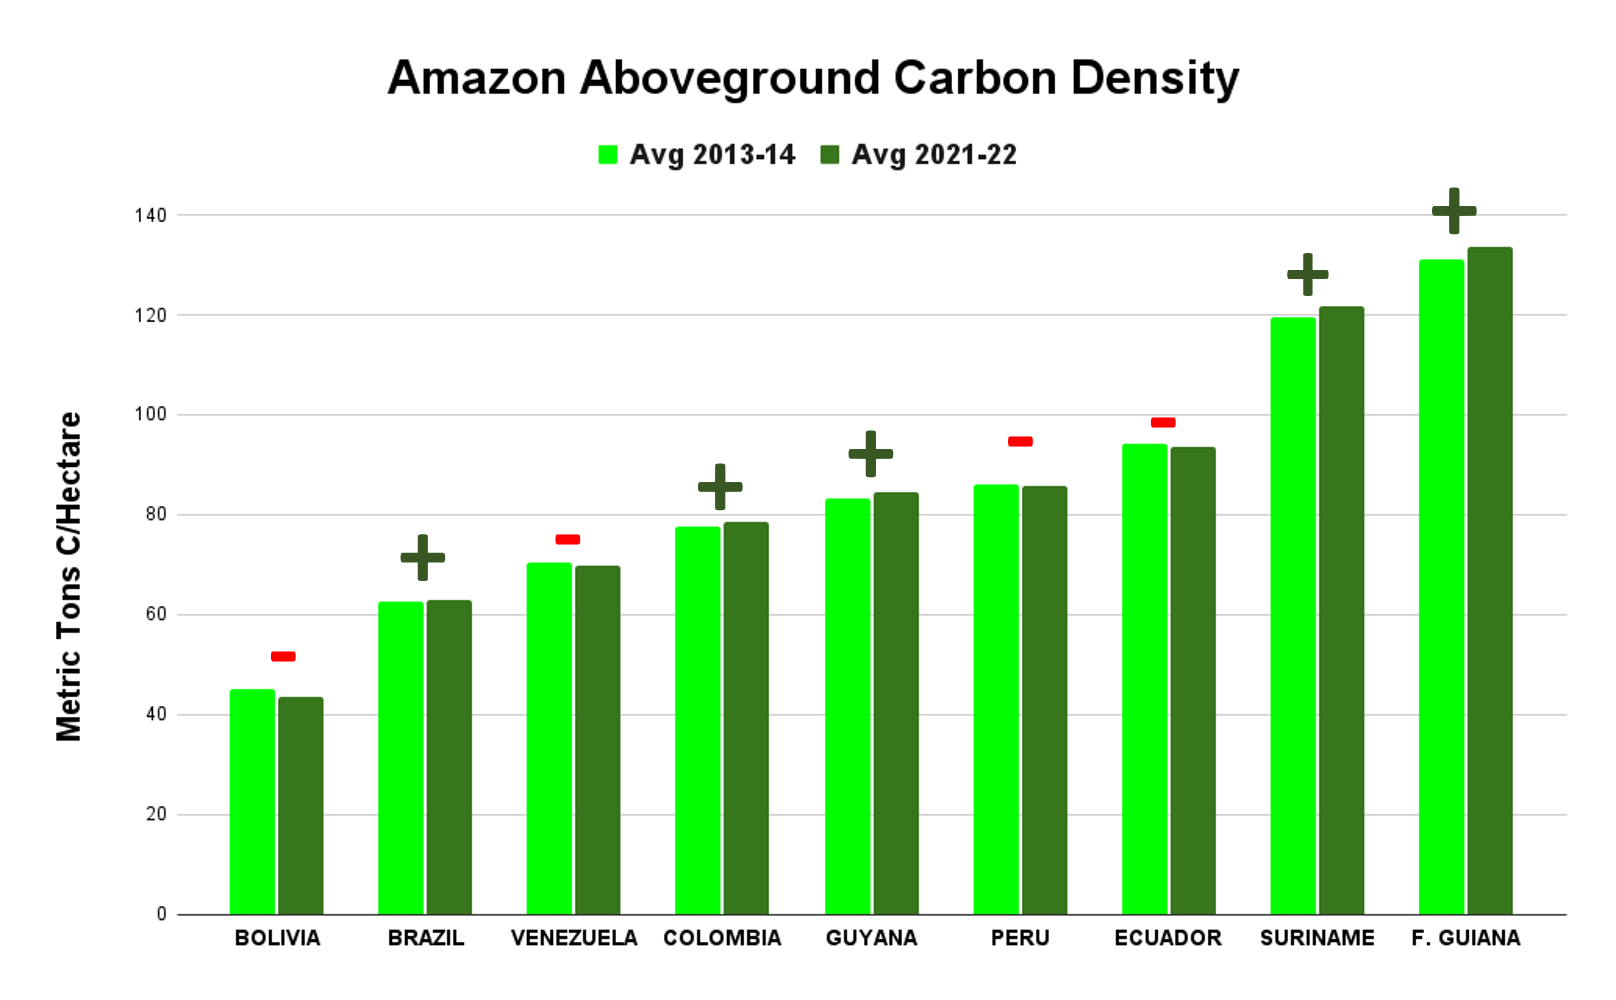
Graph 1. Planet Forest Carbon Diligence data across the Amazon biome, comparing 2013-14 with 2021-22. Note that a “+” symbol indicates that the country gained aboveground carbon, while a “-“ symbol indicates that the country lost aboveground carbon.

Carbon Density by Country

Standardizing for area, Graph 2 shows that countries with the highest aboveground carbon density (that is, aboveground carbon per hectare as of 2021-22) are located in the northeast Amazon: French Guiana (134 metric tons/hectare), Suriname (122 metric tons/hectare), and Guyana (85 metric tons/hectare). Ecuador is also high (94 metric tons/hectare).

Note that countries in the northeast Amazon (French Guiana, Suriname, and Guyana) have lower total aboveground carbon due to their smaller size (Graph 1), but high aboveground carbon density per hectare (Graph 2). This also applies to Ecuador.

Graph 2. Planet Forest Carbon Diligence data for aboveground carbon density by country across the Amazon, comparing 2013-14 with 2021-22. Note that a “+” symbol indicates that the country gained aboveground carbon, while a “-“ symbol indicates that the country lost aboveground carbon.

Notes & Citations

1 Anderson C (2024) Forest Carbon Diligence: Breaking Down The Validation And Intercomparison Report. https://www.planet.com/pulse/forest-carbon-diligence-breaking-down-the-validation-and-intercomparison-report/

2 In terms of uncertainty, the data contains pixel-level estimates, but not yet at national levels. To minimize annual uncertainty at the country level, we averaged 2013 and 2014 for the baseline and 2021 and 2022 for the current state.

3 Recently, in MAAP #144, we showed Brazil as a carbon source, based on data from 2001 to 2020. In contrast, Planet Forest Carbon Diligence is based on data from 2013 to 2022. Thus, one interpretation of the difference is that most carbon loss occurred in the first decade of the 2000s, which is consistent with historical deforestation data showing peaks in the early 2000s. It also highlights the likely importance of the interplay between forest loss/degradation (carbon loss) and forest regeneration (carbon gain) in terms of whether a country is a carbon source or sink during a given timeframe.

4 HFDL, or “High Forest cover, Low Deforestation” describes countries with both a) high forest cover (>50%) and low deforestation rates (<0.22% per year). For more information on HFDL, see https://www.conservation.org/blog/what-on-earth-is-hfld-hint-its-about-forests

5 Annual carbon dioxide (CO₂) emissions worldwide from 1940 to 2023

Citation

Finer M, Mamani N, Anderson C, Rosenthal A (2024) Unprecedented Look at Carbon across the Amazon. MAAP  #215.


MAAP 214: Agriculture in the Amazon: New data reveals key patterns of crops & cattle pasture

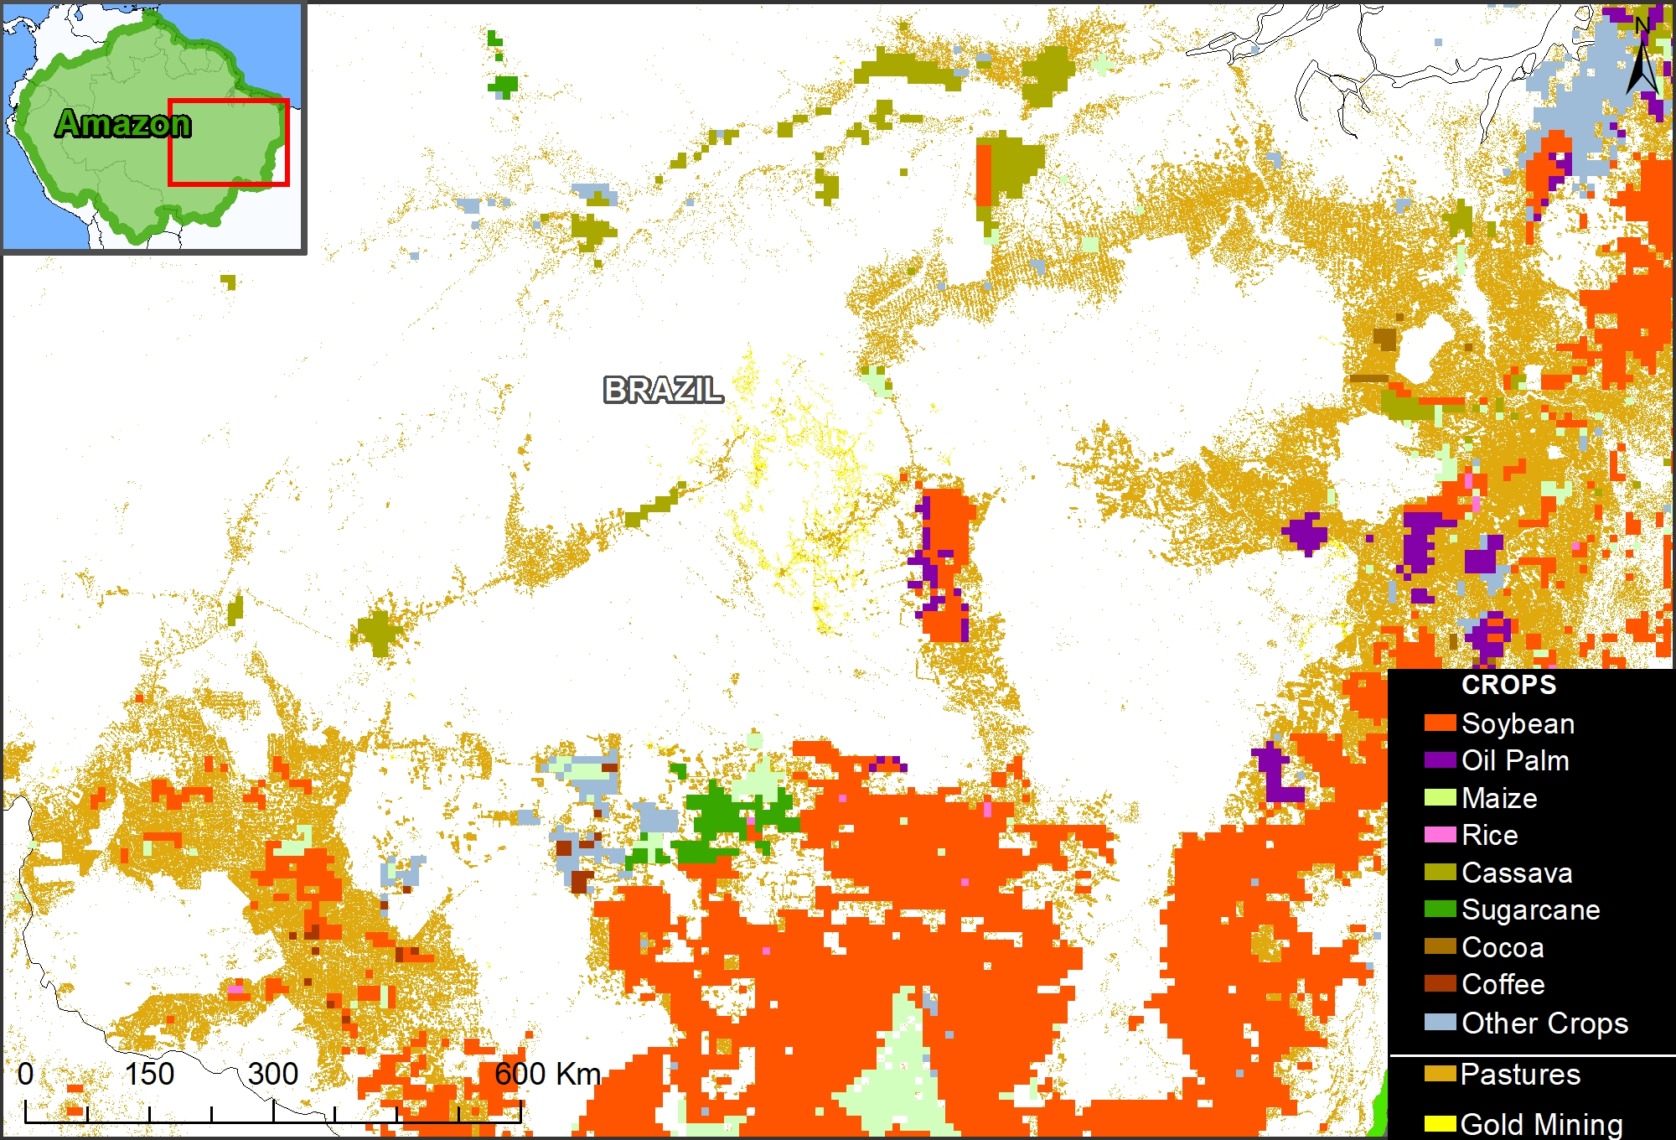
Figure 1. Example of the merged agricultural and pasture data in a section of the Brazilian Amazon. Data: IFRI/SPAM, Lapig/UFG, Mapbiomas, AMW, ACA/MAAP.

A burst of new data and online visualization tools are revealing key land use patterns across the Amazon, particularly regarding the critical topic of agriculture. This type of data is particularly important because agriculture is the leading cause of overall Amazonian deforestation.

These new datasets include:

  • Crops. The International Food Policy Research Institute (IFPRI), a leading agriculture and food systems research authority, recently launched the latest version of their innovative crop monitoring product, the Spatial Production Allocation Model (SPAM).1 This latest version, developed with support from WRI’s Land & Carbon Lab, features spatial data for 46 crops, including soybean, oil palm, coffee, and cocoa. This data is mapped at 10-kilometer resolution across the Amazon and updated through 2020.2
    j
  • Cattle pasture. The Atlas of Pastures,3 developed by the Federal University of Goiás, facilitates access to data regarding Brazilian cattle pastures generated by MapBiomas. This data is mapped at 30-kilometer resolution and updated through 2022. We use Collection 5 from Mapbiomas for the rest of the Amazonian countries.4
    j
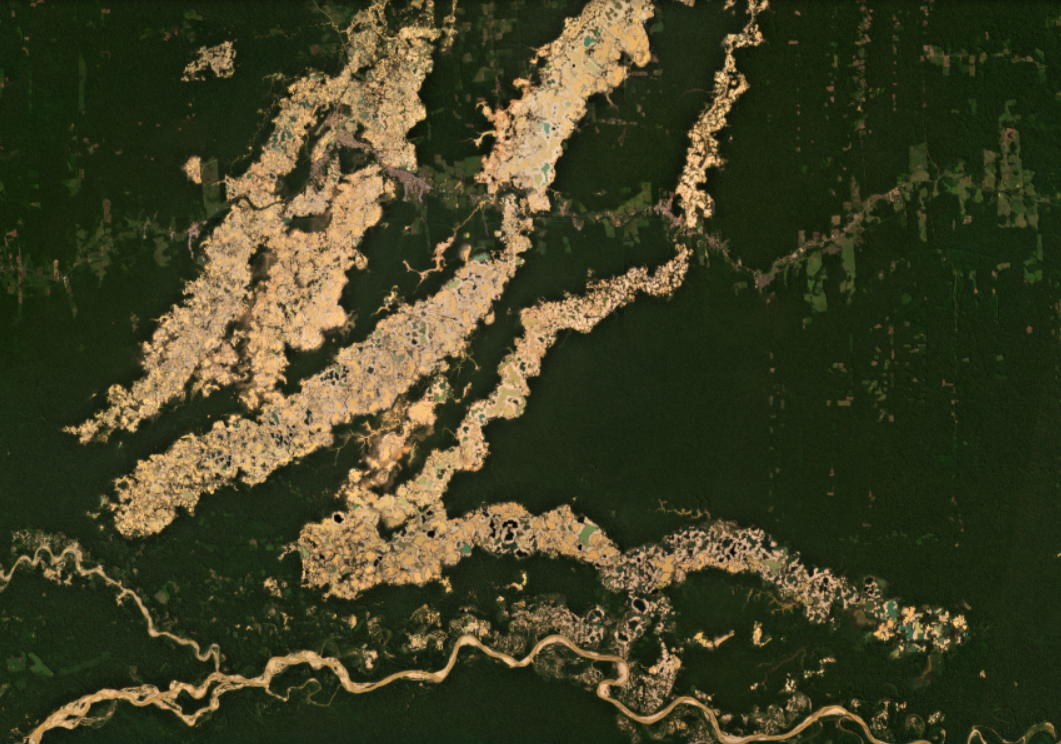
  • Gold mining. New mining data is included for additional context. Amazon Mining Watch uses machine learning to map open-pit gold mining.5 This data is mapped at 10-kilometer resolution across the Amazon and updated through 2023.

We merged and analyzed these new datasets to provide our first overall estimate of Amazonian land use, the most detailed effort to date across all nine countries of the biome. Figure 1 shows an example of this merged data in a section of the Brazilian Amazon.

Below, we present and illustrate the following major findings across the Amazon, and then zoom in on several regions across the Amazon to show the data in greater detail.

Major Findings

The Base Map illustrates several major findings detailed below.

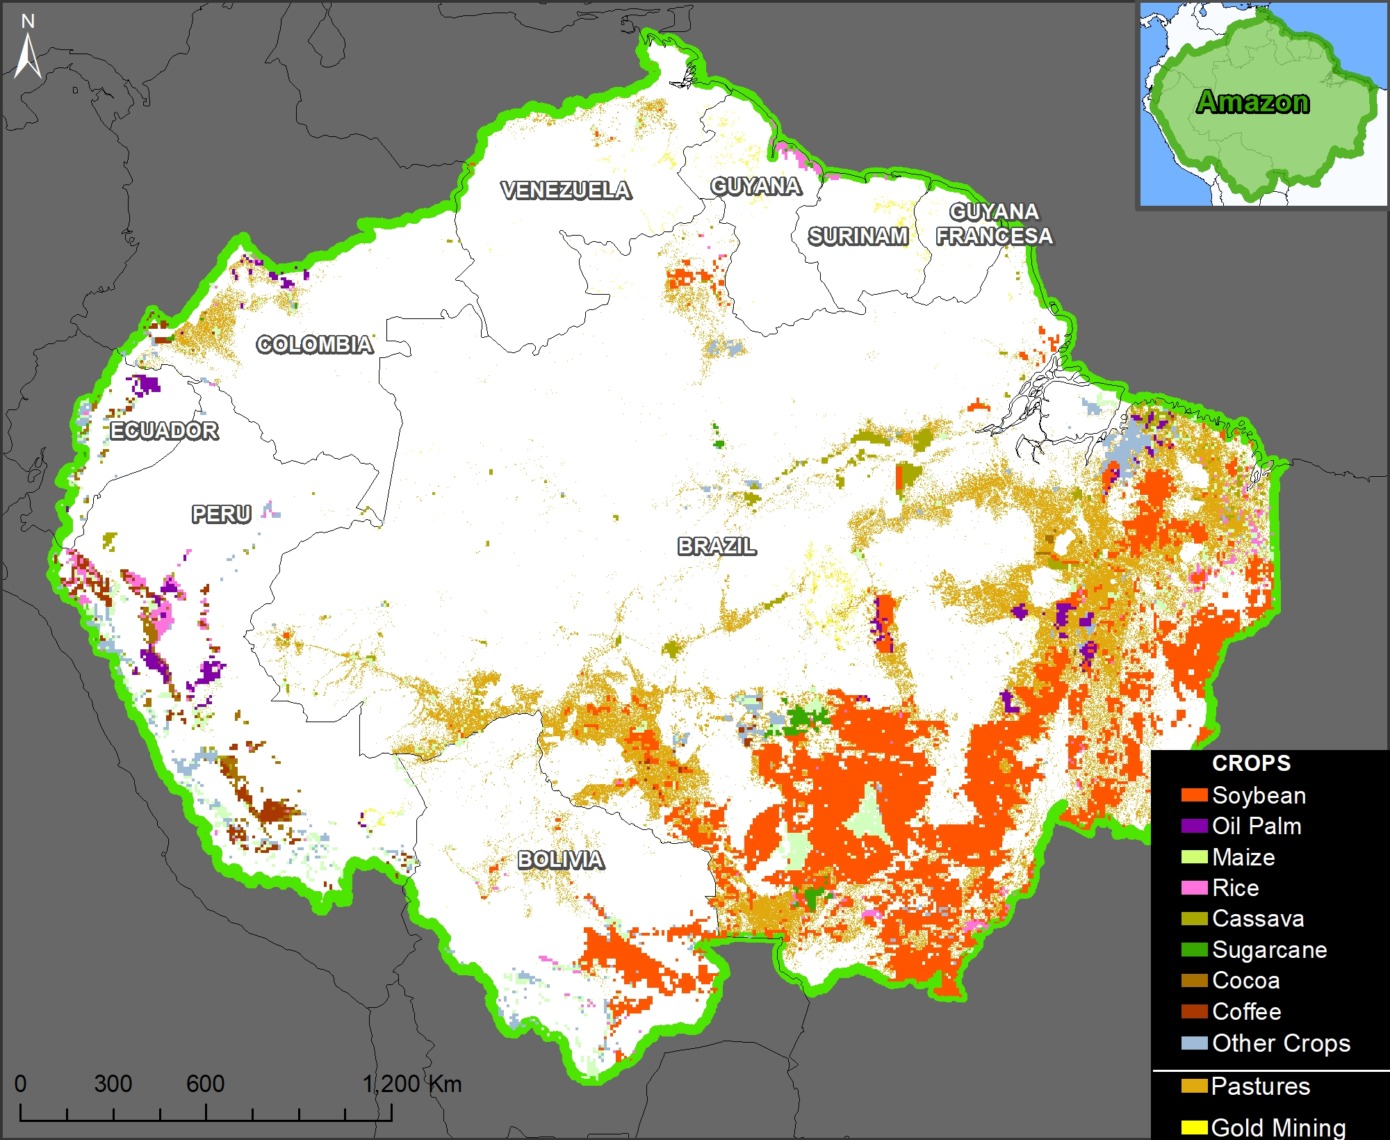
Base Map. Overview of the merged datasets noted above for crops, pasture, and gold mining. Double-click to enlarge. Data: IFRI/SPAM, Lapig/UFG, Mapbiomas, AMW, ACA/MAAP.

1) Crops
We found that 40 crops in the SPAM dataset overlap with the Amazon, covering over 106 million hectares (13% of the Amazon biome).

Soybean covers over 67.5 million hectares, mostly in southern Brazil and Bolivia. Maize covers slightly more area (70 million hectares) but we consider this a secondary rotational crop with soy (thus, there is considerable overlap between these two crops).

Oil palm covers nearly 8 million hectares, concentrated in eastern Brazil, central Peru, northern Ecuador, and northern Colombia.

In the Andean Amazon zones of Peru, Ecuador, and Colombia, cocoa covers over 8 million hectares and the two types of coffee (Arabica and Robusta) cover 6.7 million hectares.

Other major crops across the Amazon include rice (13.8 million hectares), sorghum (10.9 million hectares), cassava (9.8 million hectares), sugarcane (9.6 million hectares), and wheat (5.8 million hectares).

2) Cattle Pasture
Cattle Pasture covers 76.3 million hectares (9% of the Amazon biome). The vast majority (92%) of the pasture is in Brazil, followed by Colombia and Bolivia.

3) Crops & Cattle Pasture
Overall, accounting for overlaps between the data, we estimate that crops and pasture combined cover 115.8 million hectares. This total is the equivalent of 19% of the Amazon biome.

In comparison, open-pit gold mining covered 1.9 million hectares (0.23% of the Amazon biome).

Zooms across the Amazon

Eastern Brazilian Amazon

Figure 2 shows the transition from the soy frontier to the cattle pasture frontier in the eastern Brazilian Amazon. Also note a mix of other crops, such as oil palm, sugarcane, and cassava, and some gold mining.

Figure 2. Eastern Brazilian Amazon. Data: IFRI/SPAM, Lapig/UFG, Mapbiomas, AMW, ACA/MAAP.

Andean Amazon (Peru and Ecuador)

Figure 3. Andean Amazon. Data: IFRI/SPAM, Lapig/UFG, Mapbiomas, AMW, ACA/MAAP.

The land use patterns are quite different in the Andean Amazon regions of Peru and Ecuador.

Figure 3 shows, that instead of soy and cattle pasture, there is instead oil palm, rice, coffee, and cocoa.

Also note the extension of the cattle pasture frontier in the western Brazilian Amazon, towards Peru and Bolivia.


Northeast Amazon (Venezuela, Guyana, Suriname, French Guiana)

Figure 4 shows the general lack of crops in the core Amazon regions Guyana, Suriname, and French Guiana, which is surely a major factor they are all considered High Forest cover, Low Deforestation countries (HFLD). In contrast, note there is abundant gold mining activity throughout this region.

Figure 4. Northeastern Amazon. Data: IFRI/SPAM, Lapig/UFG, Mapbiomas, AMW, ACA/MAAP.

Methods

For the SPAM data, we used the physical area, which is measured in a hectare and represents the actual area where a crop is grown (not counting how often production was harvested from it). We only considered values ​​greater than or equal to 100 ha per pixel.

For the Base Map, due to their importance as primary economic crops, we layered soybean and oil palm as the top two layers, respectively. From there, crops were layered in order of their total physical area across the Amazon. Thus, the full extensions of some crops are not shown if they overlap pixels with other crops that have greater physical area. For overlaps with crops and pasture, we favored the crops.

Notes & Data Sources

1 International Food Policy Research Institute (IFPRI), 2024, “Global Spatially-Disaggregated Crop Production Statistics Data for 2020 Version 1.0” https://doi.org/10.7910/DVN/SWPENT, Harvard Dataverse, V1

Spatial Production Allocation Model (SPAM)
SPAM 2020 v1.0 Global data (Updated 2024-04-16)

2 Note that the spatial resolution is rather low (10-kilometers) so all crop coverage data above should be interpreted as referential only.

3 The Atlas of Pastures (Atlas das Pastagens), open to the public, was developed by the Image Processing and Geoprocessing Laboratory of the Federal University of Goiás (Lapig/UFG), to facilitate access to results and products generated within the MapBiomas initiative, regarding Brazilian pastures.

https://atlasdaspastagens.ufg.br/

4 MapBiomas Collection 5;  https://amazonia.mapbiomas.org/en/

5 See MAAP #212 for more information on Amazon Mining Watch.

Citation

Finer M, Ariñez A (2024) Agriculture in the Amazon: New data reveals key patterns of crops & cattle pasture. MAAP: 214.

MAAP #199: Amazon Carbon Update, based on NASA’s GEDI Mission

As we approach the COP28 climate summit, starting in Dubai in late November, we provide here a concise update on the current state of remaining Amazon carbon reserves.

We present the newly updated version of NASA’s GEDI data1, which uses lasers aboard the International Space Station to provide cutting-edge estimates of aboveground biomass density on a global scale.

Here, we zoom in on the Amazon and take a first look at the newly updated data, which covers the time period of April 2019 – March 2023.2

This data, which is measured in megagrams of aboveground biomass per hectare (Mg/ha) at a 1-kilometer resolution, serves as our estimate for aboveground carbon reserves.

Figure 1 displays aboveground biomass across the Amazon biome. Note the highest carbon densities (indicated in bright yellow) are located in both the northeast Amazon and southwest Amazon.

Aboveground Biomass across the Amazon

Figure 2 also displays aboveground biomass across the Amazon biome, but this time with country boundaries and labels added.

Note that the peak biomass concentrations in the northeast Amazon include Suriname, French Guiana, and the northeast corner of Brazil. The peak biomass concentrations in the southwest Amazon are centered in southern Peru. Also note that many parts of Ecuador, Colombia, Venezuela, Guyana, Bolivia, Brazil, and northern Peru have high carbon densities as well.

Figure 2. Aboveground biomass density (carbon estimate) across the Amazon biome, with country boundaries. Data: NASA/GEDI, NICFI.

Carbon Estimates

We calculated over 78 billion metric tons of aboveground biomass across the Amazon biome (78,184,161,090 metric tons to be exact). Using a general assumption that 48% of this biomass is carbon3, we estimate over 37 billion metric tons of carbon across the Amazon (37,528,397,323 metric tons).

Note that these totals are likely underestimates given that the laser-based data has not yet achieved full coverage across the Amazon (that is, there are many areas where the lasers have not yet recorded data, leaving visible blanks in the maps above).

This is consistent with a previous study based on another independent dataset, where we estimated 6.7 billion metric tons of carbon in the Peruvian Amazon as of 2013 (MAAP #148). The current GEDI data estimates at least 5.3 billion metric tons in the Peruvian Amazon.

Carbon Sink

In a previous report, we showed that the Brazilian Amazon has become a net carbon source, whereas the total Amazon is still a net carbon sink (MAAP #144). Our current report goes one step further in terms of showing just how much carbon is left in that sink.

Notes

1GEDI L4B Gridded Aboveground Biomass Density, Version 2.1. https://daac.ornl.gov/cgi-bin/dsviewer.pl?ds_id=2299

2Note that we previously reported on the initial data release, which covered the time period of April 2019 – August 2021 (see MAAP #160).

3Domke et al (2022) How Much Carbon is in Tree Biomass?. USDA/Forest Service.

Acknowledgements

This work was supported by NORAD (Norwegian Agency for Development Cooperation) and ICFC (International Conservation Fund of Canada).

Citation

Mamani N, Finer M, Ariñez A (2022) Amazon Carbon Update, based on NASA’s GEDI Mission. MAAP: 199.
MAAP #164: Amazon Tipping Point – Where Are We?

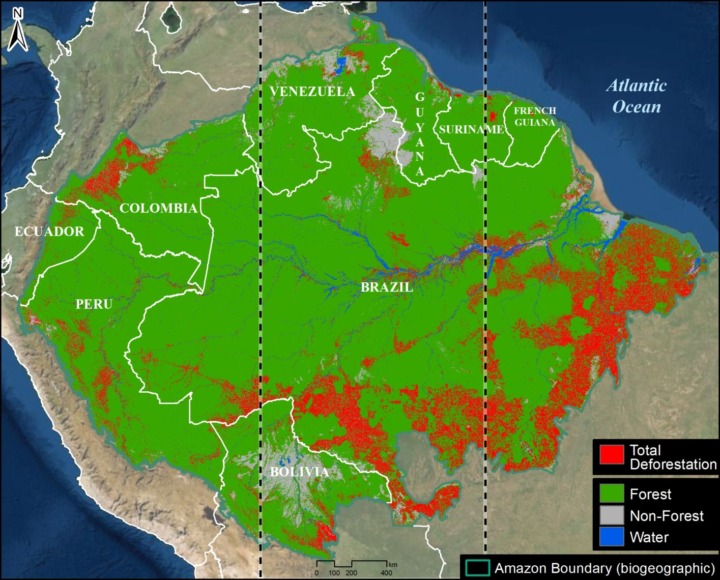
Base Map. Total Amazon forest loss. Data: ACA/MAAP.
It is increasingly reported that the largest rainforest in the world, the Amazon, is rapidly approaching a tipping point.

As repeatedly highlighted by the late Tom Lovejoy (see Acknowledgements), this tipping point is where parts of the rainforest will convert into drier ecosystems due to disrupted precipitation patterns and more intense dry seasons, both exacerbated by deforestation.

The Amazon generates much of its own rainfall by recycling water as air passes from its major source in the Atlantic Ocean. Thus, high deforestation in the eastern Amazon may lead to downwind impacts in the central and western Amazon (see Background section below).

The scientific literature indicates this tipping point could be triggered at 25% Amazon forest loss, in conjunction with climate change impacts.

The literature, however, is less clear on the critical first part of the tipping point equation: how much of the Amazon has already been lost?

There are numerous estimates, including 14% forest loss cited in the recent Science Panel for the Amazon report, but we did not find any actual definitive studies specifically addressing this question.

Here, we directly tackle this key question of how much of the original Amazon has been lost to date.

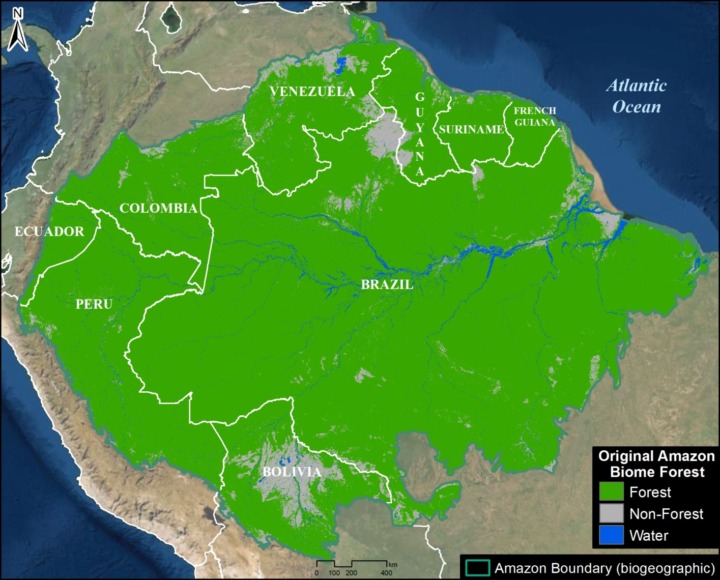
First, we present the first known rigorous estimate of original Amazon biome forest prior to European colonization: over 647 million hectares (1.6 billion acres; see Image 1 below).

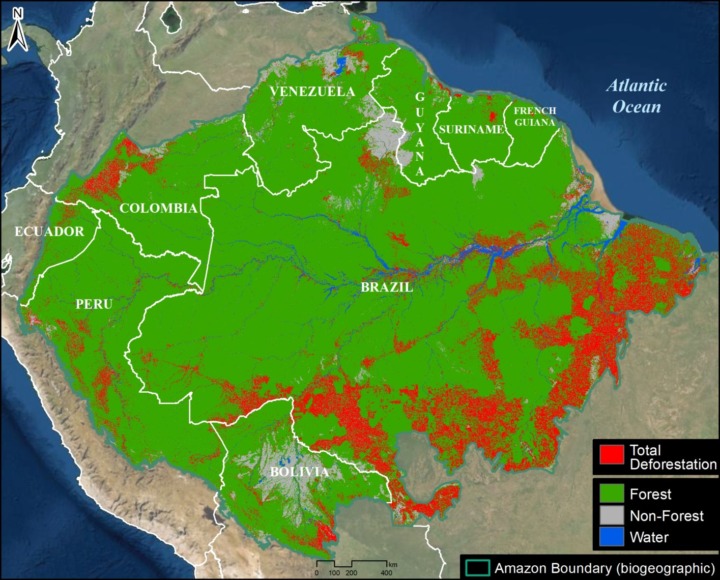
Second, we estimate the accumulated total Amazon forest loss, from the original estimate to the present: over 85 million hectares (211 million acres; see Base Map).

Combining these two results, we estimate that 13% of the original Amazon biome forest has been lost.

More importantly, however, focusing on just the eastern third of the Amazon biome (see Image 2 below), we estimate that 31% of the original forest has been lost, above the speculated tipping point threshold. This finding is critical because the tipping point will likely be triggered in the eastern Amazon, as it is closest to the oceanic source of the water that then flows to the central and western Amazon.

Original Amazon Forest

Image 1 shows the first known estimate of original Amazon forest prior to European colonization. Note that we use a broader biogeographical definition of the Amazon that covers nine countries (Amazon biome) rather than the strict Amazon watershed (see Methodology).

Image 1. Original Amazon biome forest. Data: ACA/MAAP.

This represents the most rigorous effort to date to recreate the original Amazon. For example, we attempted to recreate original forest lost to historic dam reservoirs.

The map has just three classes: Original Amazon forest, Original non-forest (such as natural savannah), and Water.

We found that the original Amazon forest covered over 647 million hectares (647,607,020 ha). This is equivalent to 1.6 billion acres.

Of this total, 61.4% occurred in Brazil, followed by Peru (12%), Colombia (7%), Venezuela (6%), and Bolivia (5%). The remaining four countries (Ecuador, Guyana, Suriname, and French Guiana) make up the final 8%.

Amazon Forest Loss

Image 2 shows the accumulated total Amazon forest loss, from the original estimate to the present (2022).

Image 2. Total Amazon forest loss. Vertical lines indicate the Amazon broken down into thirds. Data: ACA/MAAP.

Of the original forest noted above, we documented the historic loss of over 85 million hectares (85,499,157 ha). This is equivalent to 211 million acres.

The largest loss occurred in Brazil (69.5 million ha), followed by Peru (4.7 million ha), Colombia (4 million ha), Bolivia (3.8 million ha), and Venezuela (1.4 million ha). The remaining four countries (Ecuador, Guyana, Suriname, and French Guiana) make up the final 1.9 million ha.

By comparing the original Amazon biome, we calculated the historic loss of 13.2% of the original Amazon forest due to deforestation and other causes.

More importantly, however, we find that 30.8% of the original Amazon has been lost in the eastern third of the Amazon biome (see vertical dashed lines Image 2), above the speculated tipping point threshold. This finding is critical because as noted above, the tipping point will likely be triggered in the east as it is the source of the water flowing to the central and western Amazon.

In contrast, we find that 10.8% of the original Amazon has been lost in the central third of the Amazon biome and 6.3% has been lost in the western third, both of which are below the speculated tipping point threshold.

Background

The Amazon generates around half of its own rainfall by recycling moisture up to 6 times as air masses move from the Atlantic Ocean in the east across the basin to the west. Thus, the rainforest plays a major part in keeping itself alive, by recycling water through its trees to generate rainfall from east to west.

This unique hydrological cycle has historically supported rainforest ecosystems for vast areas far from the main ocean source.

But it also raises the question of how much deforestation would be required to cause the cycle to degrade to the point of being unable to support these forests, thus the Amazon tipping point hypothesis.

In this scenario, rainforests would transform into drier ecosystems, such as open canopy scrubland and savannah.

The tipping point concept originally referred to an abrupt ecosystem change, but it is now believed that the shift could happen gradually (30-50 years).

It is worth noting that the western Amazon near the Andes mountains would likely maintain its rainforests, as air currents flowing over the mountains would continue causing water vapor to condense and fall as rain.

Methodology

At the core of this work, we generated two major estimates: original Amazon forest and total historical Amazon forest loss.

For both of these estimates, we used the biogeographical boundary of the Amazon (as determined by RAISG 2020), which encompasses nine countries. Thus, we used a broader definition of the Amazon (Amazon biome) rather than the strict Amazon watershed, which omits part of the northeastern Amazon biome.

For original Amazon forest, we defined three major classes: Forest, Non-Forest, and Water. This analysis was based on data from MapBiomas Brazil (collection 2 from 1990) with some additional modifications. Original Forest was made up of these MapBiomas categories: Forest Formation, Mangrove, Flooded Forest, Mosaic of Agriculture and Pasture. Non-Forest was made up of these MapBiomas categories: Savanna Formation, Natural Non-Forest Flood Formation, Grassland, and Other non-Forest Formations. Water was made up of these MapBiomas categories: River, Lake, Ocean and Glacier.

We then made a number of modifications with manual edits based on data from the University of Maryland, INPE (Terrabrasilis), ArcGis satellite images, Planet mosaics, Google Earth Engine Landsat images from 1984-1990, and official government data for several countries (Ministry of the Environment of Ecuador (MAE) and Peru (GeoBosques/MINAM), Forest and Carbon Monitoring System/IDEAM of Colombia, National Institute for Space Research of Brazil (INPE/Terrabrasilis), General Directorate of Forest Management and Development of Bolivia (DGGDF), and the National Service of Protected Areas of Bolivia (SERNAP). As an example of a major modification, deforested areas and historic dam reservoirs were changed to Original Forest based on an analysis of the oldest available satellite image for the area (1984-1990). We also corrected some misclassifications, such as forest patches in clearly non-forest areas were changed to Non-Forest (and vice versa) and mountain forest areas found as water were changed to Forest. Also, agriculture and urban areas in likely savannah areas were changed to Non-Forest. Additional Water data from MapBiomas based on 1985 was incorporated. Overall, our focus was defining Original Forest as best as possible; data confusions between Non-Forest and Water categories were not worked on as thoroughly.

For total historical Amazon forest loss, we used data from the University of Maryland. Specifically, we first used their data layer ‘Tree Cover 2000″ (>30% canopy density) to estimate historical (pre-2000) forest loss. We then added annual forest loss data from 2001 to 2021.

Finally, we divided the original Amazon forest by the total historical loss to estimate how much of the original Amazon has been lost. In addition, we delimited the Amazon in thirds according to distance east to west at the widest point. We then estimated how much of the original Amazon has been lost in each of these three sections.

References

(in chronological order)

Sampaio, G., Nobre, C., Costa, M. H., Satyamurty, P., Soares‐Filho, B. S., & Cardoso, M. (2007). Regional climate change over eastern Amazonia caused by pasture and soybean cropland expansion. Geophysical Research Letters, 34(17).

Hansen, M. C. et. al. (2013) High-Resolution Global Maps of 21st-Century Forest Cover Change. Science 342.

Nobre et al. (2016) Land-use and climate change risks in the Amazon and the need of a novel sustainable development paradigm. PNAS, 113 (39).

Turubanova S., Potapov P., Tyukavina, A., and Hansen M. (2018) Ongoing primary forest loss in Brazil, Democratic Republic of the Congo, and Indonesia. Environmental Research Letters.

Lovejoy, T. E., & Nobre, C. (2018). Amazon Tipping Point. Science Advances, 4(2).

Lovejoy, T. E., & Nobre, C. (2019). Amazon tipping point: Last chance for action. Science Advances, 5 (12).

Bullock et. al. (2019) Satellite-based estimates reveal widespread forest degradation in the Amazon. Glob Change Biol., 26.

Amigo, I. (2020) The Amazon’s fragile future. Nature, 578.

MapBiomas. 2020. MapBiomas Amazonia v2.0. https://amazonia.mapbiomas.org/.

Killeen (2021) A Perfect Storm in the Amazon Wilderness

Berenguer E. et. al. (2021) Ch 19. Drivers and ecological impacts of deforestation and forest degradation. In: Nobre C, Encalada et al. (Eds). Amazon Assessment Report 2021. United Nations Sustainable Development Solutions Network, New York, USA. Available from https://www.theamazonwewant.org/spa-reports

Hirota M et. al (2021) Science Panel for the Amazon, Ch 24. Resilience of the Amazon Forest to Global Changes: Assessing the Risk of Tipping Points. In: Nobre C, Encalada et al. (Eds). Amazon Assessment Report 2021. United Nations Sustainable Development Solutions Network, New York, USA. Available from https://www.theamazonwewant.org/spa-reports/

Wunderling et al (2022) Recurrent droughts increase risk of cascading tipping events by outpacing adaptive capacities in the Amazon rainforest. PNAS 119 (32) e2120777119.

Acknowledgements

This report is in memory of Tom Lovejoy, who helped launch the critical concept of an Amazon tipping point. Starting in 2019, we collaborated with Tom on the need assessment and background research behind this report.

We thank Carmen Thorndike for helping with the initial literature review, and Carlos Nobre for review of the final report. We also thank J. Beavers (ACA), A. Folhadella (ACA), M.E. Gutierrez (ACCA), and C. Josse (EcoCiencia) for additional comments.

This work was supported by NORAD (Norwegian Agency for Development Cooperation) and ICFC (International Conservation Fund of Canada).

Citation

Finer M, Mamani N (2022) Amazon Tipping Point – Where Are We?. MAAP: 164.

MAAP #160: Lasers Estimate Carbon in the Amazon – NASA’s GEDI Mission

Simulation of GEDI lasers collecting data. Source: UMD.

NASA’s GEDI mission uses lasers to provide cutting-edge estimates of aboveground biomass and related carbon on a global scale.

Launched in late 2018 and installed on the International Space Station, GEDI’s lasers return an estimate of aboveground biomass density at greater accuracy and resolution than previously available.

Here, we zoom in on the Amazon and take a first look at the recently available Level 4B data: Gridded Aboveground Biomass Density measured in megagrams per hectare (Mg/ha) at a 1-kilometer resolution.

See the GEDI homepage for more background information on the mission, which extends until January 2023. Be sure to check out this illustrative video.


Base Map – Aboveground Biomass in the Amazon

The Base Map displays the GEDI data for the nine countries of the Amazon biome, displaying aboveground biomass for the time period April 2019 to August 2021.

Base Map. Aboveground Biomass Density in the Amazon. Data: NASA/UMD GEDI L4B. Click twice to enlarge.


We highlight the following initial major findings:

  • The data is not yet comprehensive as there are some areas the lasers have not yet recorded data (indicated in white).
    h
  • The areas with the highest aboveground biomass and related carbon (indicated in dark green and purple) include:
    • Northeast Amazon: Corner of Brazil, Suriname, & French Guiana.
    • Southwest Amazon: Southwest Brazil and adjacent Peru (see zoom below).
    • Northwest Amazon: Northern Peru, Ecuador, and southeast Colombia.

Zoom In – Southwest Amazon

To better visualize the GEDI laser data, we also present a zoom of the Southwest Amazon. Although deforested areas (and natural savannahs) are illustrated in yellow and orange, note the surrounding presence of high carbon forest (green and purple).

Zoom In – Southwest Amazon. Aboveground Biomass Density. Data: NASA/UMD GEDI L4B. Click twice to enlarge.

Zoom Out – Global Scale

Note that tropical forests, including the Amazon, have the highest levels of aboveground biomass globally.

Zoom Out – Glocal scale. Aboveground Biomass Density. Data: NASA/UMD GEDI L4B. Click twice to enlarge.

Acknowledgements

This work was supported by NORAD (Norwegian Agency for Development Cooperation) and ICFC (International Conservation Fund of Canada).

Citation

Finer M, Ariñez A (2022) Lasers Estimate Carbon in the Amazon – NASA’s GEDI Mission. MAAP: 160.