Deforestation continues to increase in the Peruvian Amazon. According to the latest information from the Peruvian Environment Ministry1, 2014 had the highest annual forest loss on record since 2000 (177,500 hectares, or 438,600 acres per year). 2013 and 2012 had the third and fourth-highest annual forest loss totals, respectively (behind only 2009).
To better understand where this deforestation is concentrated, we conducted kernel density estimation. This type of analysis calculates the magnitude per unit area of a particular phenomenon (in this case, forest loss).
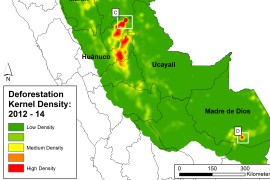
Image 25a shows the kernel density map for forest loss in the Peruvian Amazon between 2012 and 2014 and reveals that recent deforestation is concentrated in a number of “hotspots” in the departments of Loreto, San Martin, Ucyali, Huanuco, and Madre de Dios.
Insets A-D highlight four areas with high densities of forest loss described in previous MAAP articles. We are currently studying the other high density deforestation areas not included in the insets.
Inset A: Cacao in Loreto
Inset A (from Image 25a) indicates the deforestation of over 2,000 hectares (4,940 acres) on property owned by the company United Cacao (through its wholly owned Peruvian subsidiary, Cacao del Peru Norte) near the town of Tamshiyacu in the department of Loreto. MAAP #9 demonstrated that much of this deforestation took place at the expense of primary forest. Image 25b highlights this area, showing the forest loss between December 2012 (left panel) and September 2013 (center panel; the pinkish areas indicate recently cleared forests). The right panel shows the cumulative deforestation between 2012 and 2014. See MAAP #9 and MAAP #2 for more details.
Inset B: Oil Palm in Loreto/San Martin
Inset B (from Image 25a) indicates expanding deforestation within and around two large-scale oil palm plantations along the Loreto-San Martin border. Image 25c highlights this area, showing the forest loss between Setpember 2011 (left panel) and September 2014 (center panel). The right panel shows the cumulative deforestation between 2012 and 2014 (6,363 hectares, or 15,700 acres). See MAAP #16 for more details.
Inset C: Oil Palm in Ucayali
Inset C (from Image 25a) indicates the deforestation of 9,400 hectares (23,200 acres) of primary forest for two large-scale oil palm plantations in the department of Ucayali. Image 25d highlights this area, showing the forest loss between September 2011 (left panel) and September 2013 (center panel; the pinkish-black areas indicate recently cleared forests). The right panel shows the cumulative deforestation between 2012 and 2014. See MAAP #4 for more details.
Inset D: Gold Mining in Madre de Dios
Inset D (from Image 25a) indicates the extensive illegal gold mining deforestation in the buffer zone of Tambopata National Reserve in the department of Madre de Dios. Image 25e highlights this area, showing the forest loss between September 2011 (left panel) and September 2014 (center panel; the lighter areas indicate recently cleared forests). The right panel shows the cumulative deforestation between 2012 and 2014 (4,738 hectares, or 11,700 acres). See MAAP #1 for more details.
It is important to emphasize that in this case, extensive deforestation continued in 2015. See MAAP #12 and MAAP #24 for more details.
Methodology
We conducted this analysis using the Kernel Density tool from Spatial Analyst Tool Box of ArcGis 10.1 software. Our goal was to emphasize local concentrations of deforestation in the raw data while still representing overarching patterns of deforestation between 2012 and 2014. We accomplished this using the following parameters:
Search Radius: 15000 layer units (meters)
Kernel Density Function: Quadratic
Cell Size in the map: 200 x 200 meters (4 hectares)
Everything else was left to the default setting.
References
1MINAGRI-SERFOR/MINAM-PNCB (2015) Compartiendo una visión para la prevención, control y sanción de la deforestación y tala ilegal.
Citation
Finer M, Snelgrove C, Novoa S (2015) Deforestation Hotspots in the Peruvian Amazon, 2012-2014. MAAP: 25.